ARIZE MACHINE LEARNING COURSE
 The Fundamentals
Data Quality Management for MLOps: Cheat Sheet

As the practice of machine learning (ML) becomes more similar to that of other software engineering disciplines, it requires processes and tooling to ensure seamless workflows and reliable outputs. In particular, data quality management has been a consistent focus, as poor data quality management leads to technical, architectural, and organizational bottlenecks.
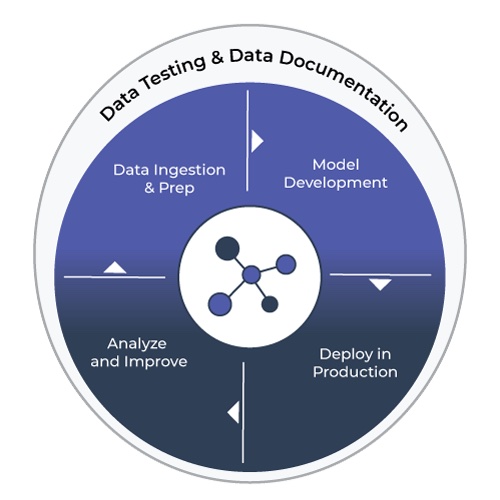
Since ML deals with both code and data, modern MLOps solutions need to take care of both by incorporating tasks such as version control of code used for data transformations and model development, automated testing of ingested data and model code, deployment of the model in production in a stable and scalable environment, and monitoring of the model performance and prediction outputs. Data testing and data documentation fit neatly into different stages of the MLOps pipeline: at the data ingestion stage, during the model development stage, and after the model deployment stage.
It’s critical to recognize that data quality is a journey, not a destination. That is, data quality requires continued investment over time. For ML teams that are still in the nascent stage of dealing with data quality issues, the concept of a data quality flywheel can help kickstart their data quality journey by building trust in the data and improving the data quality in a self-reinforcing cycle.
In this post, we dive deep into the key dimensions of data quality and then explore the fundamental capabilities of robust data quality solutions
The Dimensions of Data Quality
Dimensions of data quality are the categories along which data quality can be grouped. These dimensions can then be instantiated as metrics of data quality that are specific and measurable. This excellent article from the Metaplane team drilled into the 10 data quality dimensions, broken down into intrinsic and extrinsic ones.
The intrinsic dimensions are independent of use cases, easier to implement, and closer to the causes.
- Accuracy: Does the data accurately describe the real world? Do the entities exist and have the attributes you describe in your data model? Do events occur at the times and with the attributes you claim?
- Completeness: How completely does the data describe the real world? There are at least two levels here. First, how complete is your data model? Second, how complete is the data itself within the data model you’ve constructed?
- Consistency: Is the data internally consistent? If there are redundant data values, do they have the same value? Or, if values are aggregations of each other, are the values consistent with each other?
- Privacy and Security: Is data being used in accordance with the intended level of privacy and secured against undesired access? This is especially important in our world of regular data breaches and if your company has compliance (e.g., SOC 2) or regulatory (e.g., HIPAA) requirements.
- Up-To-Dateness: Does the data describe the real world right now? This dimension is closely related to the timeliness of the data, but is compared against the present moment rather than the time of a task.
The extrinsic dimensions are dependent on the use cases, requires cross-functional effort to implement, and are closer to the symptoms:
- Relevance: Does the available data meet the needs of the task at hand? Do stakeholders require more data than is available to meet their use cases?
- Reliability: Is the data regarded as trustworthy and credible by the stakeholders? Some factors that impact the reliability of data are: whether the data is verifiable, whether there is sufficient information about its lineage, whether there are guarantees about its quality, whether bias is minimized.
- Timeliness: Is the data up-to-date and made available for the use cases for which it is intended? There are two components here: is the data up-to-date, and what is the delay to make the data available for the stakeholder?
- Usability: Can data be accessed and understood in a low-friction manner? Some factors that impact usability are: whether the data is easy to interpret correctly and unambiguous.
- Validity: Does the data conform to business rules or definitions?
Now that we have the list of intrinsic and extrinsic data quality dimensions, how can we use ML observability to provide tangible metrics for each of these dimensions? First, it’s important to understand the different types of data.
Categorical Data
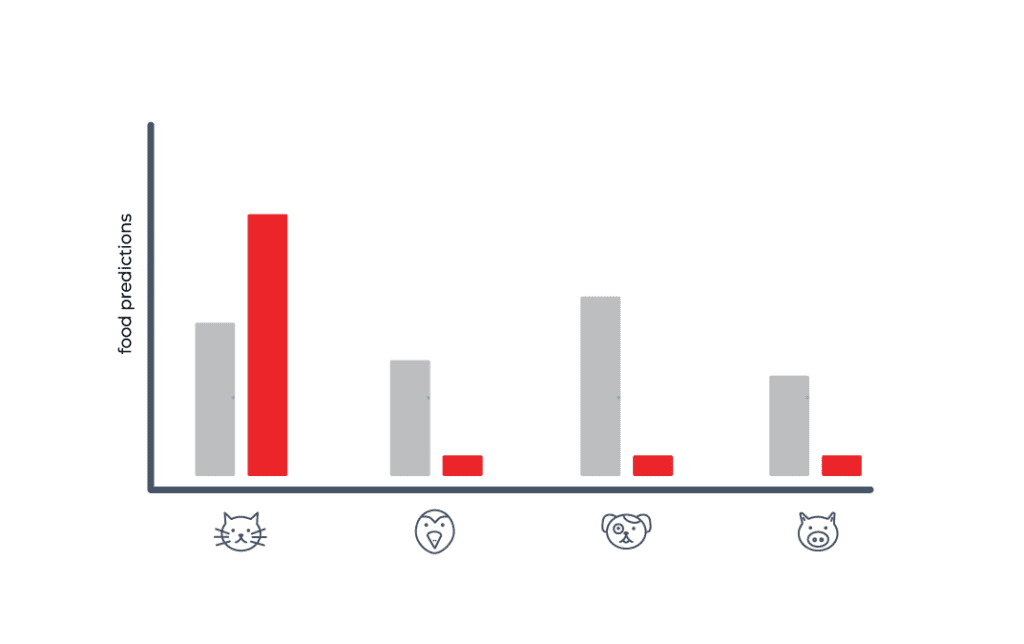
Categorical data is just what it sounds like, a stream of categories like the type of pet someone owns: dog, cat, bird, pig? etc.
Cardinality Shifts
To start, something that can go wrong with a categorical data stream is a sudden shift in the distribution of categories. To take it to an extreme, let’s say your hypothetical model predicting which pet food to buy for your pet supply store starts seeing data saying that people only own cats now. This might cause your model to only purchase cat food, and all your potential customers with dogs will have to go to the pet supply store down the street instead.
Data Type Mismatch
In addition to a sudden cardinality shift in your categorical data, your data stream might start returning values that are not valid to the category. This is, quite simply, a bug in your data stream, and a violation of the contract you have set up between the data and the model. This could happen for a variety of reasons: your data source being unreliable, your data processing code going awry, some downstream schema change, etc. At this point, whatever comes out of your model is undefined behavior, and you need to make sure to protect yourself against type mismatches like this in categorical data streams.
Missing Data
One incredibly common scenario that practitioners run into, is the problem of missing data. With the rising number of data streams used to compute large feature vectors for modern ML models, the likelihood that some of these values will be nil is higher than ever. So what can you do about it?
One thing you certainly can do is throw your hands up in the air and discard the row in a training context, or throw an error in your application in a production context. While this will help you avoid this problem, it’s possibly not the most practical. If you have hundreds, thousands, or tens of thousands of data streams used to compute one feature vector for your model, the chance that one of these streams is missing can be very high!
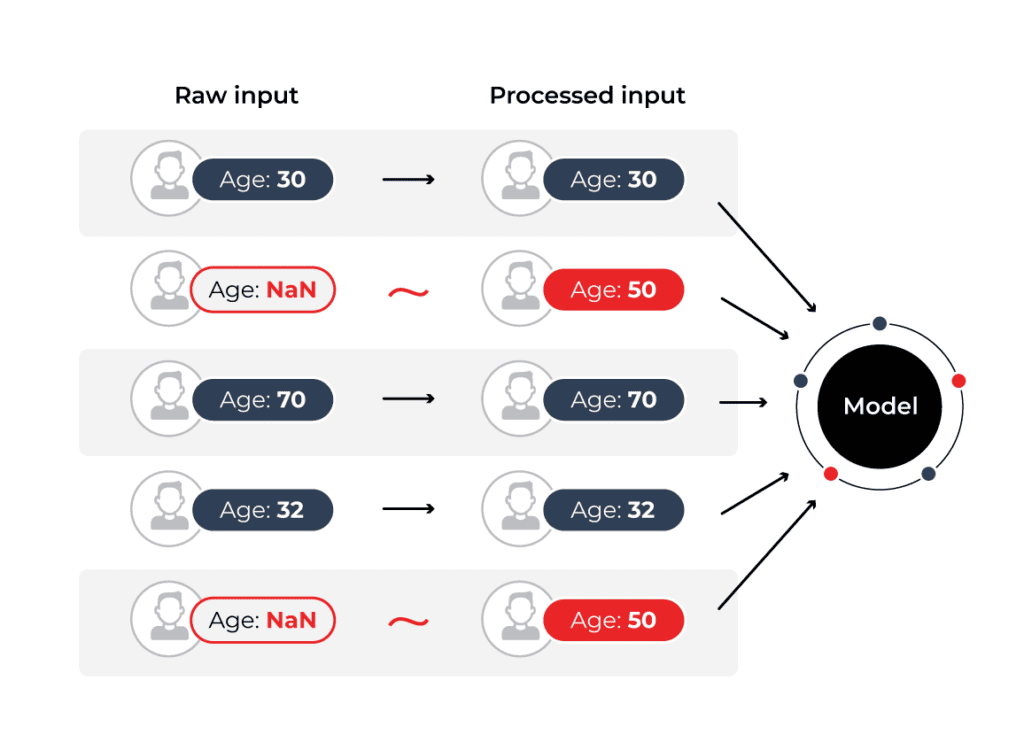
This brings us next to how you might fill this missing value, commonly referred to as imputation. For categorical data, you could choose the most common category that you have historically seen in your data, or you could use the values that are present to predict what this missing value likely is.
Numerical Data
A numerical data stream is also pretty self-explanatory. Numerical data is data that is represented by numbers, such as the amount of money in your bank account, or the temperature outside in Fahrenheit or Celsius.
Out of Range Violations
Often, something that can go wrong with numerical data streams is out of range violations. For example, if age was an input to the model and you are expecting the age to be between 0–120, but suddenly receive a value in the 300s, this would be considered out of range.
Type Mismatch
Type mismatch can also affect numerical data. It’s in the realm of possibility that for a particular data stream where you are expecting a temperature reading that you are returned a categorical data point, and you have to handle this appropriately. It’s possible that the default behavior may be to cast this categorical value to a number that, although now valid, has entirely lost its semantic meaning and is now an error in your data that is incredibly hard to track down.
Challenges with Monitoring Data Quality
Now that we have gotten a better idea of what possible data quality issues you may run into, let’s now briefly dive into some common challenges that practitioners run into when attempting to keep tabs on the quality of their data.
Before we start here, it’s important to note that this is different from the broad product space of data observability. Data observability tools are mostly focused on monitoring the quality of tables and data warehouses, while ML observability is focused on monitoring the inputs and outputs of models. These models are consistency evolving, features are being added and changed, and so the data quality monitoring of models must be able to evolve with the schema of the model.
Too Much Data to Keep Tabs On
It’s not surprising to many current ML practitioners that many models these days rely on tons of features to perform their tasks. One rule of thumb, guided by recent advances in statistical learning theory, suggests that a model can effectively learn approximately a feature for every 100 examples you have in a training set. With training set sizes exploding into the hundreds of millions and even billions, models with feature vector lengths in the tens and hundreds of thousands are not uncommon.
This leads us to a major challenge that practitioners face today. To support these incredibly large feature vectors, teams have poured larger and larger data streams into feature generation. Writing code to monitor the quality of each of these data streams is fundamentally untenable, and the reality is that this data schema will inevitably change often as the team experiments to improve the model.
At the end of the day, no one wants to sit there and hand configure thresholds, baselines and set up a custom data monitoring system for each of these data streams that are feeding into the model. It’s common to add a feature, drop a feature, change how it is computed, and adding more work into the ML development loop will only slow you and your team down.
What now?
Now that we understand some of the current challenges around monitoring and fixing data quality issues, what can we do about it? To start, teams need to start keeping track of how the quality of their data affects the end performance of their model.
Leverage Historical Information
Ultimately the model’s performance is what we care about, and it’s very possible that the quality of some data is worth more than that of others. To avoid manually creating baselines and thresholds for each data stream, teams need to have a history of data to look at either from training sets or from historical production data.
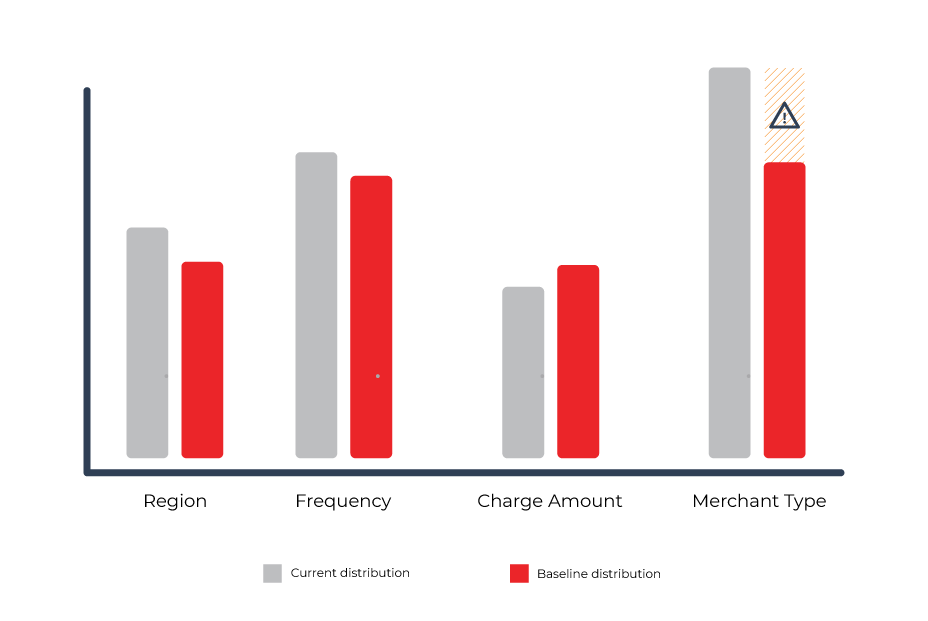
Once these historical distributions have been determined, your monitoring system can have a better idea about what it should consider an outlier in a numerical stream, and generate alerts when a categorical stream has strongly deviated from its historical distribution. From these distributions, intelligent baselines and thresholds can be created to balance how “noisy” or likely to fire these alerts are, giving power to the model team to balance risk vs reward.
On top of setting up automatic alerting systems for all of your data streams, your data quality monitoring system should also allow you to enforce type checks to protect against downstream errors in your model and avoid potential typecasting issues.
Hill Climb Using Model Performance
Lastly, by keeping track of your model’s end performance, your monitoring system should also allow you to test out different imputation methods for your data and give you the performance impact for this new imputation strategy. This provides confidence that the choices you are making are positively impacting the end performance of the model.
As fast as machine learning has progressed and made its way into some of our most crucial products and services, the tooling to support these experiences has lagged behind. These core features of a modern data quality monitoring system bring back control to the ML engineer and remove a large amount of guesswork, which unfortunately has crept very deeply in the art of productionizing machine learning.

