ARIZE MACHINE LEARNING COURSE
 The Fundamentals
Kolmogorov Smirnov Test for AI: When and Where To Use It

What is the Kolmogorov-Smirnov Test (KS test or K-S test)?
The Kolmogorov Smirnov test (KS test or K-S test) is used to compare two distributions to determine if they are pulling from the same underlying distribution.
In the typical ML use case, there are two distributions (A & B) that you are trying to compare. One distribution A might be a feature such as, account balance, in the model training dataset. The other distribution B might be the same feature, account balance, but aggregated in a production window of time (typically daily or hourly). As a model builder, you want to know if the deployed model is being used on a distribution of data that is different from the training dataset. The Kolmogorov-Smirnov (KS) test is a non-parametric statistical test that can be used to compare A and B to see if they are different.
Unlike other metrics that allow you to compare distributions such as JS divergence, PSI and KL divergence that come from mathematician Claude Shannon’s information theory, the K-S test derives from statistics. It’s non-parametric, meaning it works across all types of distributions. Thus, it is not limited to use on well-known distributions such as normal or binomial – your data can take on any form, and the K-S test still works. It’s worth noting that the K-S test statistic also isn’t a metric in the formal sense in that it doesn’t meet triangle inequality.
In machine learning production applications, features can be all types of distributions so using a nonparametric statistic is a requirement for analysis. The KS statistic is limited in its applications to numerical variables such features that are floats or integers and does not work for discrete categorical features.
KS Test Statistic Overview
The goal of the KS test is to determine if two distributions A and B are different. The KS test statistic gives a numeric value related to that difference.
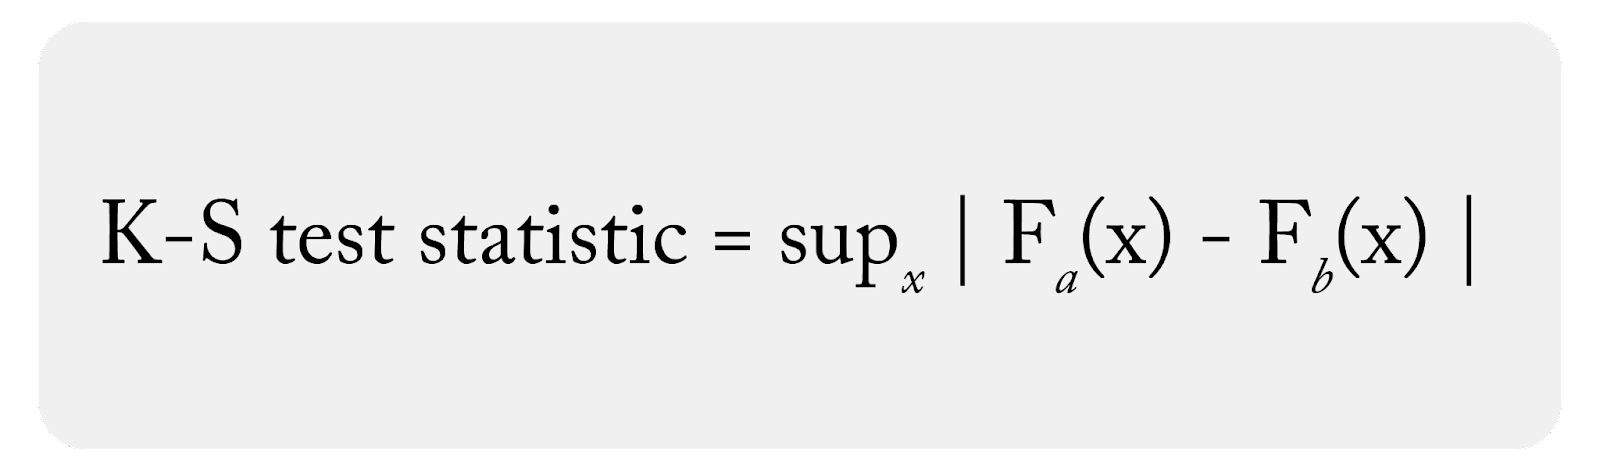
What Is the Formula for Kolmogorov Smirnov Test?
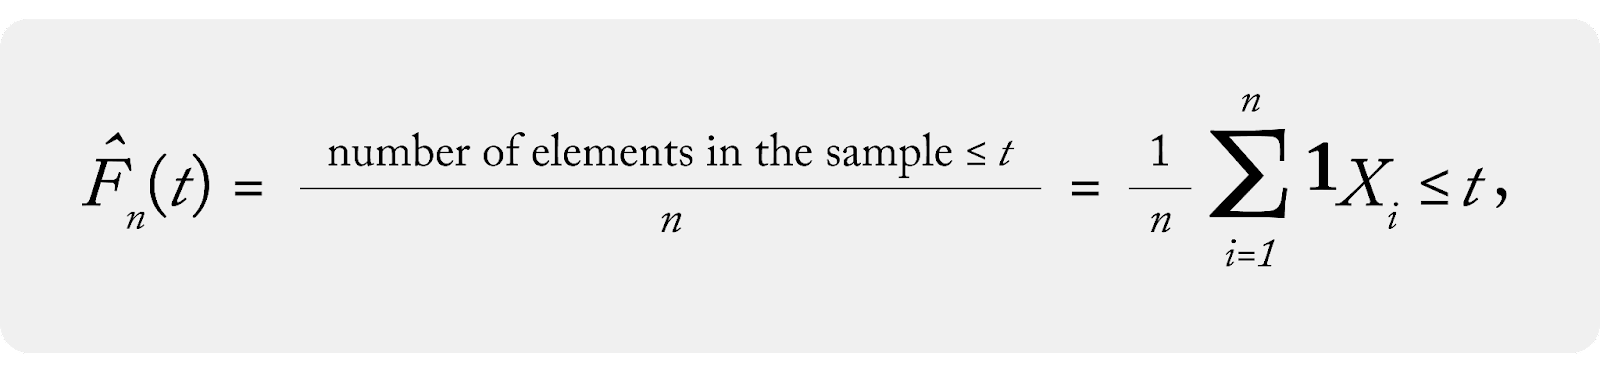
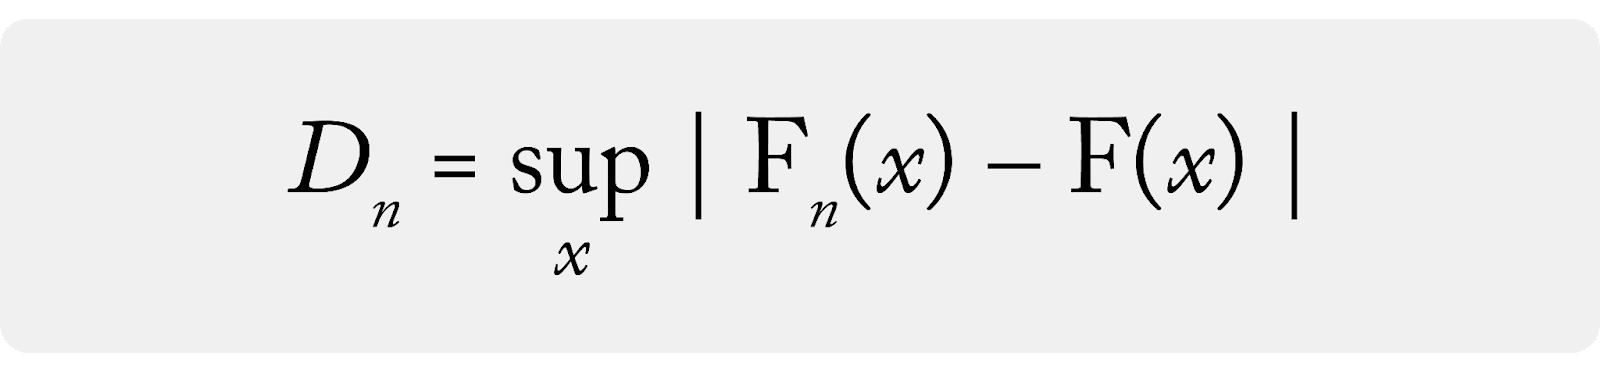
The KS test statistic is defined as the maximum value of the difference between A and B’s cumulative distribution functions (CDF). In machine learning settings, CDFs are typically derived empirically from samples of the datasets and would be called eCDFs.
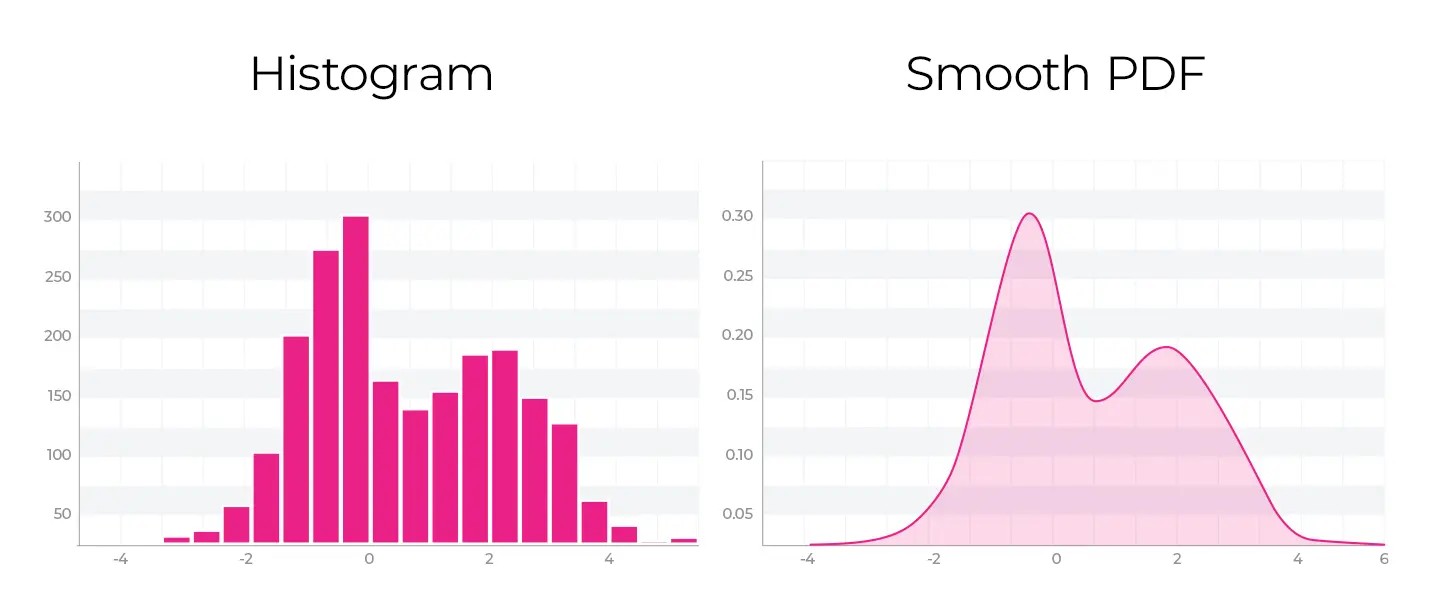
The data you collect for a variable or feature in either training or production may look like the distributions above. An empirical CDF is created by ordering the data by value and creating a piecewise graph.
Here is some simple Python code for CDF:
def ecdf(data):
    """Compute ECDF for a one-dimensional array of measurements."""
    # Number of data points: n
    n = len(data)

    # x-data for the ECDF: x
    x = np.sort(data)

    # y-data for the ECDF: y
    y = np.arange(1, n+1) / n

    return x, y
The CDF creates a stepwise cumulative sum along the range of the data variable.
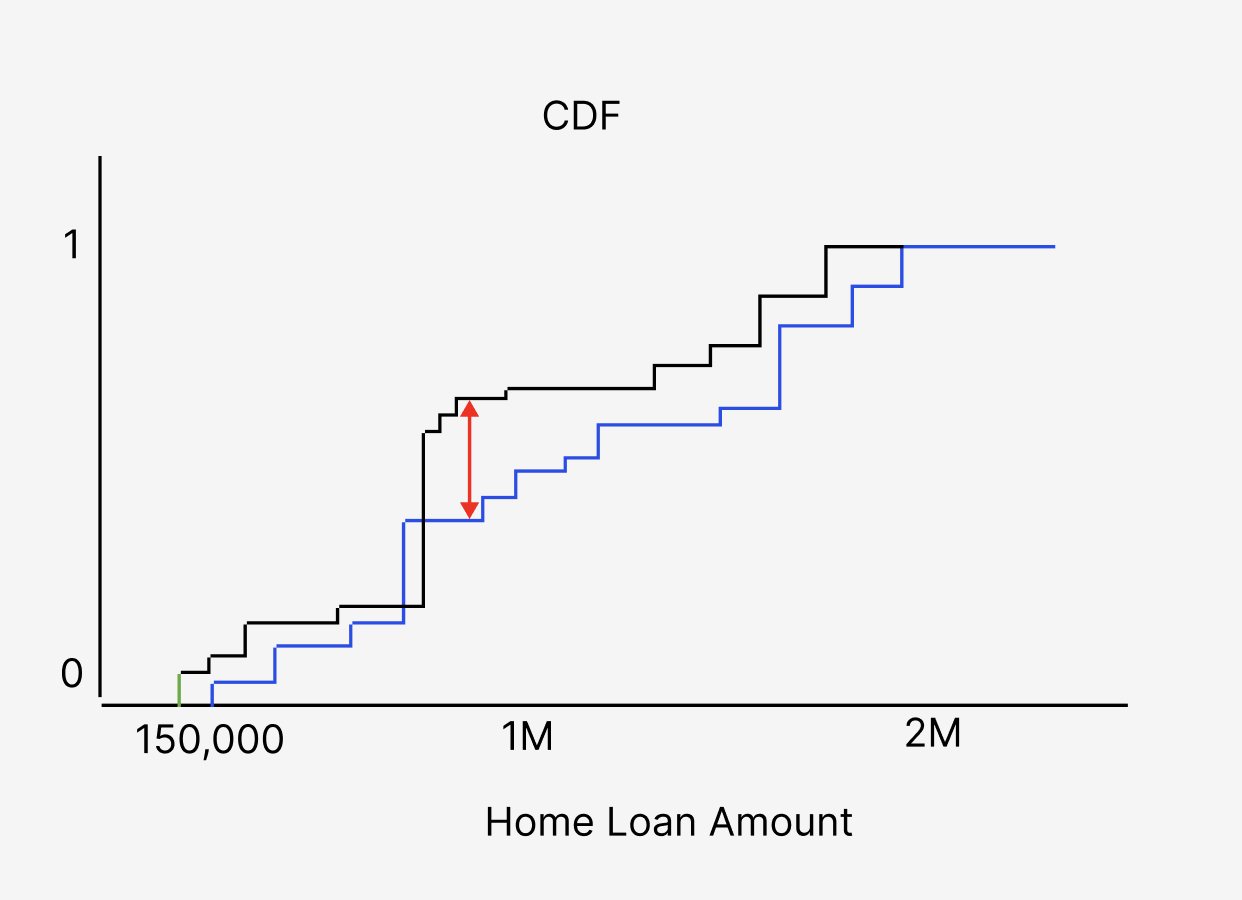
In the example above, one can see the eCDF of the feature account balance from production compared to the account balance eCDF from training. The blue piecewise eCDF is the training data while the black line is the production data. The red arrow represents the K-S test statistic, the maximum difference between the eCDFs.
What Is the Difference Between One Sample KS Test Versus Two Sample KS Test?
There are two versions of the KS test, the one-sample and two-sample (not to be confused with one-side and two-side). The examples above are the two-sample KS test where both distributions are empirical and derived from real data.
- Two-Sample: eCDF of A compared to eCDF of B
- One-Sample: eCDF of A compared to CDF of B
The one-sample KS test is almost never used in production machine learning. The one-sample K-S test is used when you are comparing a single empirical sample to a theoretical parameterized distribution. An example of this might be testing if account balance amount in training (distribution A) is normally distributed (distribution B).
Kolmogorov Distribution and Goodness of Fit
The KS test statistic, which is the value achieved by measuring the maximum difference of the two eCDFs, represents only a single sample. The Kolmogorov distribution is the distribution of K-S test statistics if you were to take a large number of samples from the same distribution.
How Do You Create the Kolmogorov Distribution?
To create the Kolmogorov distribution:
- You can bootstrap your data or gather another eCDF
- Run 500 times to generate 500 eCDFs
- Calculate the K-S for each eCDF
- Plot all 500 of the K-S values as a distribution
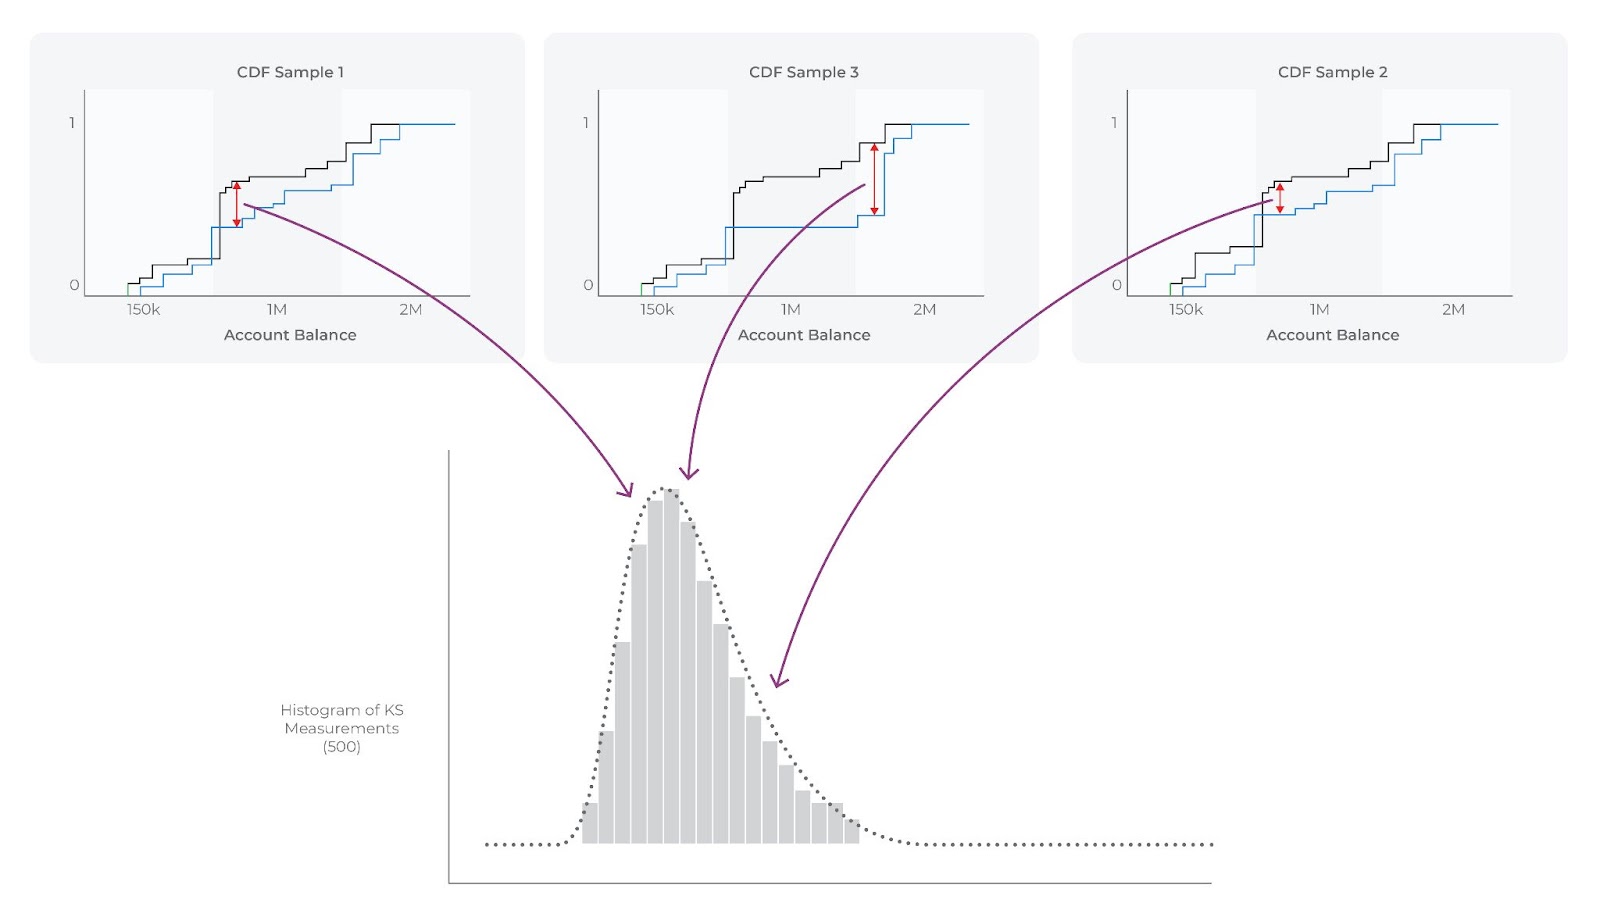
500 samples of K-S test statistic
The above is what the distribution of the K-S would look like with sample sizes of N. Each sample you take will have a different K-S value.
Andrey Kolmogorov notes in his original paper on the subject that the distribution of K-S values from multiple samples take on a particular shape, which is now called a Kolmogorov distribution.
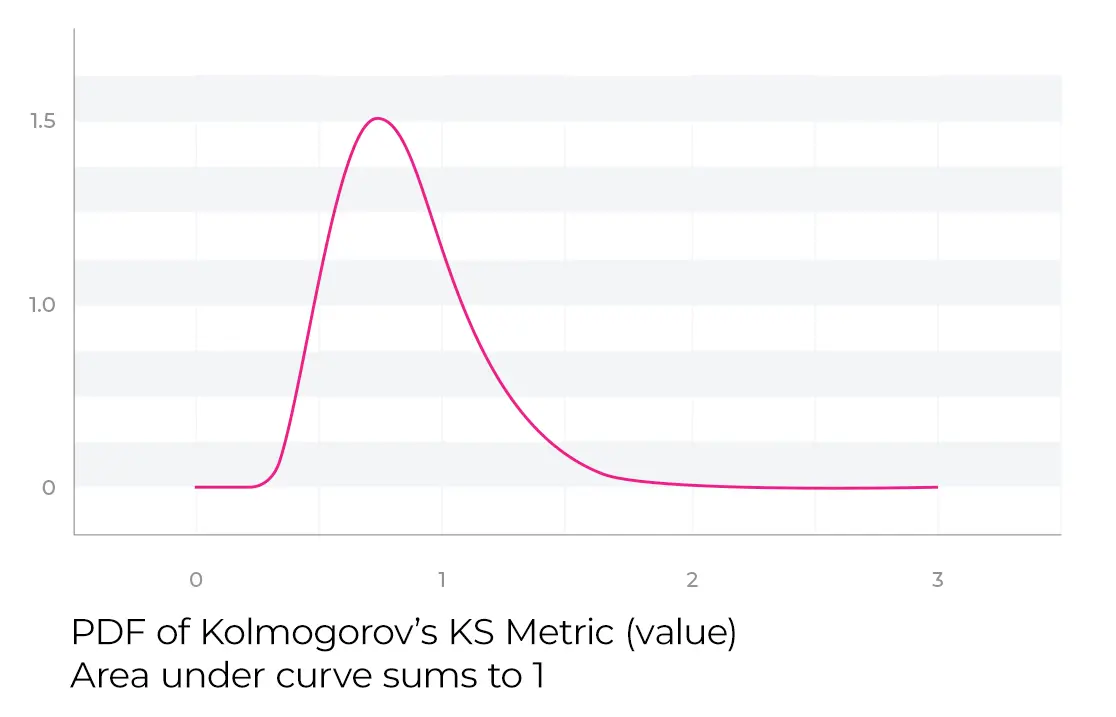
This distribution has a closed-form equation that only depends on the number of samples that were used in the generation of the eCDF. A Kolmogorov distribution is different from a gaussian distribution, but you can still apply some of the same p-value concepts. The p-value returned in python “ks_2samp” is just looking at this distribution based on the number of samples and the K-S test statistic measured. The code determines the probability of K-S test statistic value sampled, assuming the K-S is distributed as a Kolmogorov distribution. This is the goodness-of-fit test. For additional detail, StatsExchange has a great technical deep dive into this topic.
To make this more concrete, you can run a couple examples below (code):
from scipy.stats import ks_2samp
import numpy as np


np.random.seed(12345678)
x = np.random.normal(0, 1, 10000)
y = np.random.normal(0, 1, 100000)
z = np.random.normal(1.1, 0.9, 10000)


print(ks_2samp(x, y))
print(ks_2samp(x, z))


KstestResult(statistic=0.008180000000000076, pvalue=0.5742210629027362)
KstestResult(statistic=0.4332, pvalue=0.0)
If interested in learning more, here is a great overview video on the subject.
Can Kolmogorov Smirnov Test Be Monitored Over Time To Detect Model Drift?
Yes. In typical statistical textbook use of the Kolmogorov Smirnov Test test, it is a static comparison between two A and B distributions. The monitoring use case is distinct from the textbook use of the Kolmogorov Smirnov Test (which would be a static comparison between two A and B distributions) in that data scientists generate eCDFs periodically measuring K-S periodically. Tracking the K-S test statistic over time serves as an indicator that the distribution has moved. The K-S and goodness-of-fit are used as a test on each sample to drive an alerting threshold.
It’s worth noting that running this in practice in a large machine learning operational environment is not as simple as running a goodness-of-fit test daily in a job. When an alert occurs that the job just begins, often figuring out quickly what has changed and how that is related to the data is critical to managing tens to thousands of models and greater than 100 features.
When Is Kolmogorov Smirnov Test Preferable To Population Stability Index, KL Divergence and JS Divergence?
There are a lot of differences between the information theory-based distribution comparison metrics and Kolmogorov Smirnov. One intuition that is helpful to think about is that the information content can change between two distributions, but a K-S test statistic may not change. The eCDF above any arbitrary ordering of points past the maximum does not change the K-S test statistic (if they don’t create a maximum). This would be akin to re-arranging data in the upper bins of the distribution. In the information theory-based metrics, any movement in data between bins is captured in a metric change.
Conclusion
The K-S test is a great statistical test to monitor distributions, compare distributions, and compare goodness-of-fit between distributions. Arize has also found that the Shannon information theory type measures – JS divergence, PSI and KL divergence – are slightly more flexible in practice across feature types. For additional learning, check out this resource on K-S test and the original research paper on the topic.

