


Why Best-Of-Breed ML Monitoring and Observability Solutions Are The Way Forward

Gabe Barcelos
Founding Engineer
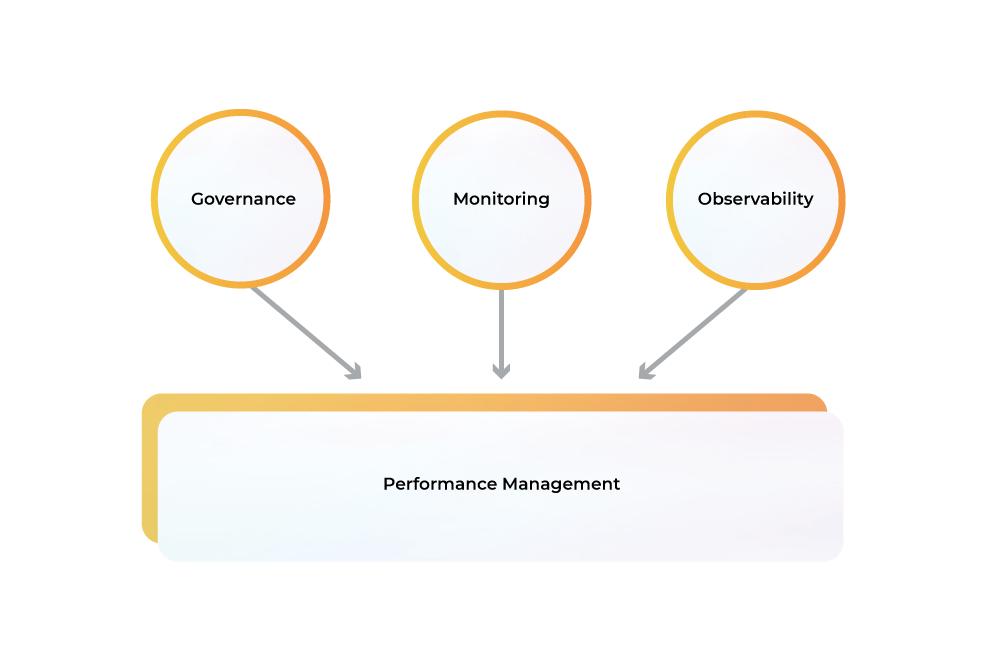
Contrary to what some believe, the deployment of machine learning models is not the final step in the MLOps process. These models need to be continuously governed, monitored, and observed to manage performance. As machine learning models are constantly retrained with new data and tweaked to improve accuracy, they become more complex. In practice, this means that handling model failure is going to be a lot trickier than before.
In order to support these changes in the ML workflow, we need an ML observability and model monitoring platform that can help us understand what’s happening inside the model as it runs. Allowing us to identify when things go wrong (either due to errors in training or internal faults), evaluating how well the algorithms are performing over time, spotting anomalous data, providing the history for tracking feature usage and learning operations through large numbers of iterations—the list goes on and on.
The requirements for effective machine learning deployments are different than of a traditional data pipeline. For many data pipeline operators, their focus is on achieving maximum uptime and ensuring the platform can scale to support new data coming in at a high volume.
Machine learning deployments require a fundamentally different approach. Because model training is incremental, CI/CD is as equally important as maintaining model uptime if an organization wants to continually improve results.
Model failure in production can have far-reaching impact on a company’s revenue, public relations, and even user safety. If a model fails in production, ML teams need the ability to react immediately. If the model stops getting better over time, then we need to know about it so we can investigate why the regression is occurring and correct the course. To make all these things possible, our observability tooling must have a rich set of features to monitor and enable model training in production.
There are two general types of machine learning monitoring and observability solutions — best-of-suite and best-of-breed platforms. Let’s dive into the use cases for both.
Best-of-Suite ML Solutions
These are platforms that cover end-to-end visibility from the time data enters the system until results are delivered back to a business user. These “best-of-suite” systems attempt to be all things for all use cases — think of it as the Swiss Army Knife of tools. They typically have components that will monitor your data pipeline, manage your model training and ML models, and present information about the current system state and historical performance in one place.
The assumption with these platforms is that it’s best if there is a single unified solution for everything. Not only does having an all-in-one tool help reduce complexity, but they also hope that by providing users with a single UI, you’ll develop a deep understanding of how everything fits together instead of using multiple tools along the way, which might or might not be helpful in understanding what’s happening.
Because of the nature of machine learning and the many different ways that models are being trained with hyperparameter tuning, adaptive learning algorithms, and model ensembles, it is unlikely that these platforms will ever have a feature set to cover every possible use case. At best, this may lead teams down the path of using multiple tools in parallel that might not work together in harmony — which increases operational and budget overhead. At worst, teams aren’t reaping the full value out of their ML initiatives because they compromise on functionality or force-fit requirements to the limitations of the suite.
A better alternative for users is to embrace best-of-breed solutions and interoperate them together so that you can take advantage of their strengths while avoiding their weaknesses.
Best-of-Breed ML Platform Solutions
Rather than attempting to be all things for everyone, this category focuses on providing highly specialized tooling for a specific use case. These tools are built to provide an excellent experience for their primary purpose, but with the understanding that they might not have all of the features you need for other parts of your ML deployment. This is where the idea of interoperability between tools becomes more important than ever before — because if you only use one tool then it’s easy to fall victim to vendor lock-in.
Many users prefer using multiple tools instead of trying to find a single solution when their needs don’t align perfectly with any single toolset. Having products from different vendors can also help mitigate risk:
- If one product fails or doesn’t work out as planned, you still have others at your disposal.
- If there is an opportunity for product consolidation or becoming more cost-effective in the future, then you might have a few different options to choose from.
This is of course a much more complex way to approach machine learning monitoring and observability. Although you might have to spend the time integrating components from different vendors, in the end it’s likely that you’ll get capabilities that are more aligned with your specific needs. In addition, you don’t have to worry about vendor lock-in because there is nothing preventing you from switching out one component for another — no matter who makes them.
Monitoring Data Flow
This includes understanding what data is entering the system, how much data is being used, questions about where the source systems are located and mapped against the model training systems. It also includes monitoring a pipeline’s health — from ensuring that disk space limits aren’t exceeded by new incoming training data, to confirming that performance metrics like job latency (and corresponding retry logic ) aren’t being compromised. This problem space can get complicated quickly because of all of the possible sources of data and their supported formats, such as images, text files, database dumps, CSV files, and so on.
Managing ML Model Snapshots
Once you’re able to monitor data coming into your pipeline systems, the second major challenge is being able to manage all of the training artifacts that come out at the other end. This includes managing annotations (training status info) and metadata about the models in a central location (authoring environment). It also covers collecting training logs for both hyperparameter tuning as well as adaptive learning algorithms (LSTM and RNNs are difficult to debug since they produce non-deterministic output).
This use case expands significantly in complexity when one considers different scenarios — like how do you know whether or not to trust your latest snapshot if you don’t have any historical data to compare it against? What if you’re using an algorithm that takes several days to train and there’s no way of knowing whether or not your pipeline is broken until the end of the process? And what about when you want to update a model with new hyperparameters but you don’t actually have any confidence in the training results because they’ve only been trained on a small subset of data from your source repository?
In order for best-of-breed solutions to have value, they need to be able to handle these situations and others that are just as complex. In fact, being able to programmatically manage snapshots may become even more important than managing pipeline data flow — especially since many ML models require regular training and the associated data.
Why Choose Best-of-Breed Monitoring and Observability Solutions
One reason why organizations may want to take a “best-of-breed” approach is that they’re not happy with the current state of machine learning monitoring and observability solutions on the market. It’s also possible that you might decide that your needs are so complex or different from other platforms that it makes more sense for you to roll your own solution (with or without support from a software vendor).
In addition, if one platform supports features beyond what another offers, then there may be an incentive to develop custom integrations between them— especially in cases where data pipeline monitoring solutions don’t have sophisticated support for the ML model lifecycle.
It also helps when you consider how many different types of data systems exist and their capabilities in terms of supporting training and serving ML models. For example, if one platform can help you easily scale out to very large data repositories (more than 100 PB), then it might make sense to integrate that into your software stack.
The ability for a solution to support multiple model management use cases is also helpful since some of them require their own specialized metrics collection mechanisms, which other platforms aren’t equipped with.
When they can collect baseline data about the source systems associated with a pipeline and generate monitoring artifacts in an automated way, maintaining and managing different types of models becomes much easier because you’re not having to manually adjust integrations for every new pipeline or dataset that enters your organization.
So why has this problem evaded resolution until now? For starters, a lot of the technology for scaling ML has only been available relatively recently — such as GPUs and distributed backend storage engines (e.g., Apache Spark) capable of ingesting data at scale with minimal overhead. Another reason is that it’s not clear how many use cases there are beyond training and serving models — ML monitoring and observability tools weren’t capable of supporting them until now. Which brings us to two key realities for organizations thinking about or actively investing in AI and ML today:
Reality #1: Your Business Intelligence Tools Are Not Your ML Monitoring or Observability Tools
While there are many great tools on the market that can help you with your data pipeline monitoring (e.g. Sumo Logic, Splunk Enterprise), they only allow you to generate data from an end-to-end perspective — that is, from the source through the ML model serving layer and any downstream systems and backends that handle analytical queries.
By contrast, best-of-breed machine learning monitoring focuses more heavily on providing insights into a specific process or tool in order to better manage it. This approach has benefits over general-purpose business intelligence software like Tableau and Excel because its sole focus is on helping users make sense of how their pipelines work so they can deliver consistent value over time.
Most businesses take this functionality for granted. They already have systems that collect and monitor the data associated with their production pipelines — such as New Relic, Librato, AppDynamics, Dynatrace (aka HPE), Datadog, or any similar solution for your stack.
However, many of these monitoring solutions only handle data from a pipeline perspective. They don’t provide the functionality to help you maintain training or serving models — especially when it can only be taken advantage of if ML system integrations are completely automated.
Reality #2: Your Software Infrastructure Tools Aren’t Your ML Monitoring or Observability Tools
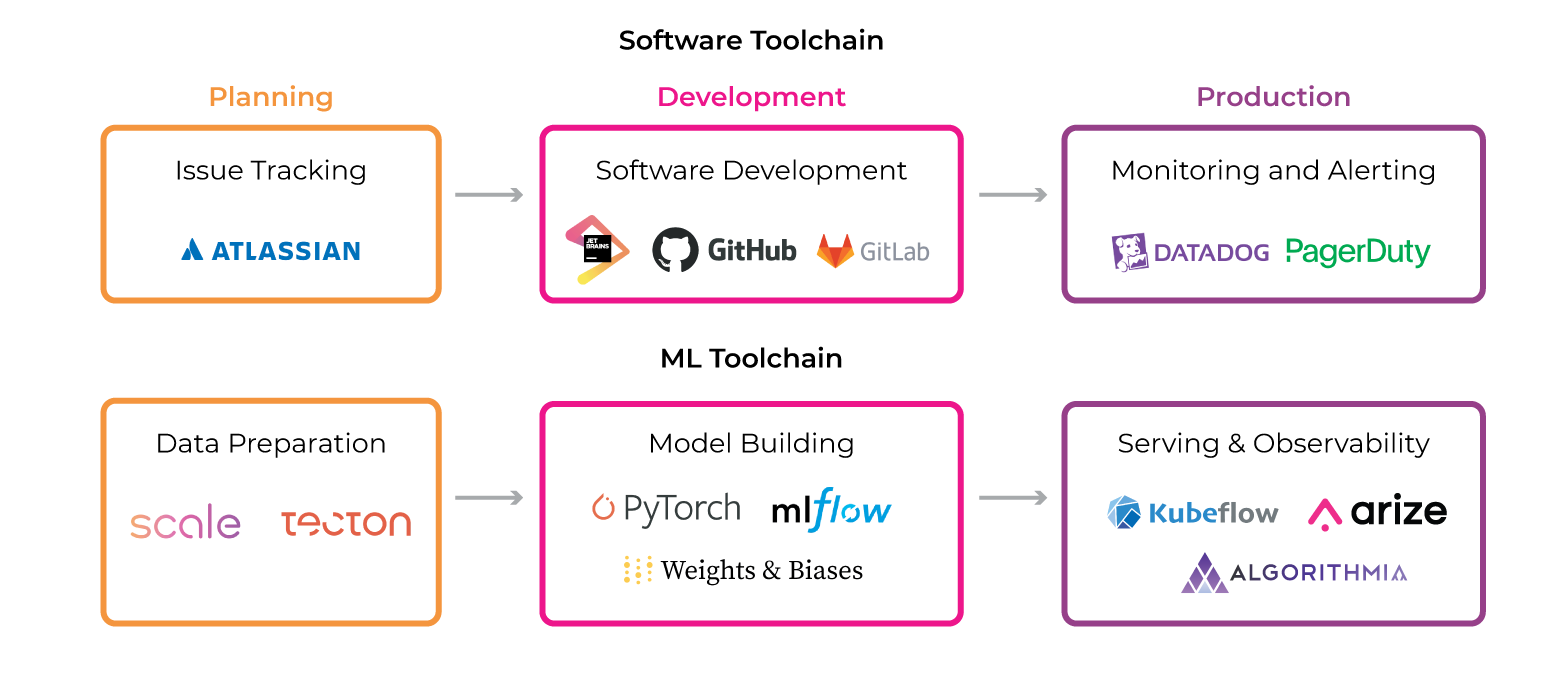
If you think about it, infrastructure monitoring solutions offer tremendous value to organizations because they can help not only identify anomalies in the systems and processes people have been using since the dawn of technology but also provide insights into how things should be running so things are both predictable (e.g., if there’s a one-hour train delay from Penn Station to Grand Central on the 7 train line due to track maintenance) and stable (i.e., nothing falls over or goes offline).
In other words, business users can rely on them for business continuity as well as cost savings when they get alerted about capacity constraints during CPU or memory spikes before they become major problems— allowing them to prevent outages or quickly recover from them by more easily rebalancing workloads or scaling up on-demand.
However, when it comes to their ML pipelines, the infrastructure monitoring solutions that they’ve been using for years are probably insufficient and inappropriate because most of them aren’t capable of generating data specific to these processes — especially if they’re more complex models like neural networks with multiple layers.
Another reason why traditional infrastructure monitoring software isn’t ideal is that it’s often geared towards analyzing metrics at a system level — but not so much at an actionable process level. As a result, you might be able to see when things start going down in your pipeline but not be able to quickly uncover what went wrong as easily as you can with a datacenter server crash alert.
This limitation probably stems from the fact that most machine learning monitoring solutions on the market today have been designed to target more complex ML models like deep neural networks with multiple layers whose inner workings can be difficult to parse. Since these models are relatively new, existing products either haven’t been built with them in mind or don’t have functionality specific for them (even though feature sets might be included but not easy to find).
Best-of-Breed Monitoring and Observability Solutions are Ideal for Companies that Take Their AI Investment Seriously
The truth is that ML monitoring and observability solutions require a lot of effort to design, build and integrate into your stack if you want them to scale in a meaningful way. Engineers are trained on particular specifications or APIs, so they often need additional guidance from teams that specialize in this type of work. This can become an expensive endeavor for companies with limited capital or expertise — particularly those whose core competency and product aren’t squarely focused on AI or ML.
What’s more, many companies don’t have the luxury of building and maintaining their own custom integrations because it doesn’t provide enough value to justify the time investment. It also increases exposure to security risks (particularly when integrating third party software), which is especially problematic given how much people are now valuing data privacy. For these reasons, companies are looking for all available options.
That is why best-of-breed solutions are the best option for anyone who wants to lower their risk while also reducing time-to-value. You’d be surprised how affordable and accessible these solutions are — oftentimes costing less than a single sales engineer or consultant.
Can you really afford not to know whether your models are working or how to improve their performance? If you can’t, manual monitoring or bootstrapping your infrastructure stack won’t cut it. You need a purpose-built, automated solution that will give you insight into what’s working, where it fails, and why without having to fiddle around under the hood every time something changes.