> ## Documentation Index
> Fetch the complete documentation index at: https://arize-ax.mintlify.site/docs/llms.txt
> Use this file to discover all available pages before exploring further.
# Signals, Spans, Traces, and Sessions
> The data shapes OpenTelemetry produces — signals, spans, traces, and sessions — and how they fit together into the trace tree Arize AX visualizes.
OpenTelemetry organizes telemetry into a handful of **signals** — the three you'll encounter most often are **traces**, **metrics**, and **logs**. Traces are the focus for AI applications: they're how you see what your app did, step by step, for a single request. Spans are the building blocks of a trace. Traces group into sessions when you're tracking multi-turn conversations.
This page covers the data shapes. The rest of the pages in this section cover the OTel and OpenInference machinery that produces and ships them.
# Signals
A signal is a category of telemetry data. The three most-used signals in OpenTelemetry today:
| Signal | What it is | Used to track |
| :---------- | :------------------------------------------------------------------------------------------------------------------------- | :-------------------------------------------------------------------------- |
| **Traces** | The path of a request through your application. A span is the unit of work that, with its peers, forms a tree (the trace). | LLM calls, tool invocations, retrievals, agent steps. |
| **Metrics** | A measurement captured at runtime. | Aggregates like latency percentiles, request counts, token usage over time. |
| **Logs** | A recording of an event. | One-off events, errors, audit entries. |
Each signal has its own exporter and provider. The OpenTelemetry specification also defines **baggage** as a signal, with **events** and **profiles** in development — see the [OpenTelemetry signals documentation](https://opentelemetry.io/docs/concepts/signals/) for the current full set. Arize AX focuses on traces, since traces are what make AI application behavior legible.
# Span Structure
A **span** is a structured log representing a single unit of work — one LLM call, one tool invocation, one retrieval. It's the atomic unit of a trace, and it carries everything you need to understand what happened:
| Field | Description |
| :--------------------------- | :------------------------------------------------------------------------------------------------------------------------------------------------------------------------------------------------------------------------- |
| **Name** | A short label for the operation (e.g. `chat.completion`, `retrieve_docs`). |
| **Start and end timestamps** | When the operation began and finished. |
| **Span context** | An immutable object representing the span's identity. Contains the span ID, trace ID, trace flags, and trace state. |
| **Parent span ID** | The ID of the parent span. Empty for a root span. |
| **Attributes** | Key-value pairs describing what happened. This is where the [OpenInference semantic conventions](/ax/concepts/otel-openinference/semantic-conventions) live (`llm.model_name`, `llm.input_messages`, `input.value`, etc.). |
| **Span events** | Structured log messages attached to a span at a specific moment. |
| **Span links** | Pointers to related spans in other traces. |
| **Span status** | `Ok`, `Error`, or `Unset`. |
| **Span kind** | The category of operation. OTel defines its own kinds for network spans; OpenInference adds AI-specific kinds — see [Span Kinds](/ax/concepts/otel-openinference/span-kinds). |
For the canonical specification, see [Span Structure](https://opentelemetry.io/docs/concepts/signals/traces/#spans).
# Spans, Traces, and Sessions
Spans, traces, and sessions form a three-level hierarchy. The analogy that often helps:
> A **session** is a conversation. A **trace** is one turn — one user input, one bot output. The **spans** inside the trace are the steps that produced that output.
## Span
The individual step the application takes. Spans can be nested via `parent_id`:
* **Child span** — `parent_id` equals the span ID of another span in the same trace.
* **Root span** — `parent_id` is `null`. The top of the tree.
* **Orphan span** — `parent_id` references a span that doesn't exist in the project. Usually a sign of incomplete instrumentation or context propagation gone wrong.
**Arize AX UI behavior**: Arize AX reads the trace-level **input** and **output** from the root span. If those columns are empty on the root, the trace list shows blank I/O — even when child spans have data. Configure [source mapping](/ax/observe/tracing/view-and-manage-traces#source-mapping) or set `input.value` / `output.value` on the root during instrumentation. This matters most for manually built traces; auto-instrumentors usually work without custom mapping.
## Trace
A collection of spans sharing the same `trace_id`. One trace represents the end-to-end work for a single request — a single user turn in a chat, a single API call, a single agent run.
## Session
A collection of traces sharing the same `session.id`. A session typically represents a multi-turn conversation — every user message and every bot response across that conversation is its own trace, all linked together by a shared session ID.
You set `session.id` on your spans either:
* via the [`using_session` context manager](/ax/concepts/otel-openinference/context-managers), or
* by setting the `session.id` attribute directly on each span.
For practical setup, see [Set up sessions](/ax/instrument/set-up-sessions).
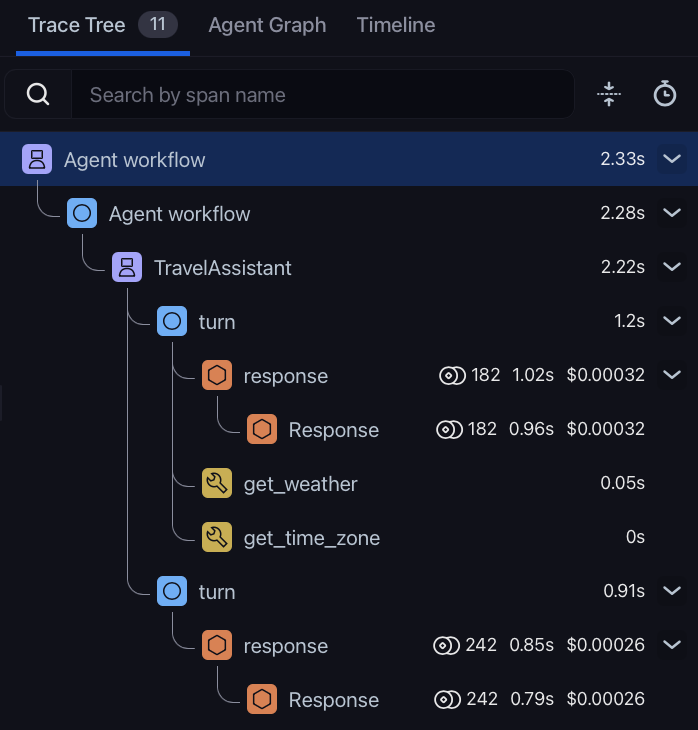
# How They Fit Together in a Trace
In a typical AI application, a single user turn might produce a trace that looks like this:
```
Session (session.id = "user-42-conv-7")
└── Trace (one user turn)
└── Agent span [root]
├── LLM span "decide which tool to call"
├── Tool span "search the knowledge base"
│ └── Retriever span
└── LLM span "answer using retrieved docs"
```
Each span has its own attributes (model name, input/output, token counts), its own status, and its own start/end time. The tree structure comes entirely from `parent_id` references, and the Arize AX UI renders it visually so you can drill into any span to see exactly what happened.
***
## Next step
You know what spans, traces, and sessions are. Next, the first of the four OTel tracing components — the Resource, which describes who is producing the telemetry: