Loading...
Loading...
Loading...
Loading...
Loading...
Loading...
Loading...
phoenix.otel is a lightweight wrapper around OpenTelemetry primitives with Phoenix-aware defaults.
pip install arize-phoenix-otelThese defaults are aware of environment variables you may have set to configure Phoenix:
PHOENIX_COLLECTOR_ENDPOINT
PHOENIX_PROJECT_NAME
PHOENIX_CLIENT_HEADERS
PHOENIX_API_KEY
PHOENIX_GRPC_PORT
phoenix.otel.registerThe phoenix.otel module provides a high-level register function to configure OpenTelemetry tracing by setting a global TracerProvider. The register function can also configure headers and whether or not to process spans one by one or by batch.
from phoenix.otel import register
tracer_provider = register(
    project_name="default", # sets a project name for spans
    batch=True, # uses a batch span processor
    auto_instrument=True, # uses all installed OpenInference instrumentors
)If the PHOENIX_API_KEY environment variable is set, register will automatically add an authorization header to each span payload.
There are two ways to configure the collector endpoint:
Using environment variables
Using the endpoint keyword argument
If you're setting the PHOENIX_COLLECTOR_ENDPOINT environment variable, register will
automatically try to send spans to your Phoenix server using gRPC.
# export PHOENIX_COLLECTOR_ENDPOINT=https://your-phoenix.com:6006

from phoenix.otel import register

# sends traces to https://your-phoenix.com:4317
tracer_provider = register()# export PHOENIX_COLLECTOR_ENDPOINT=https://your-phoenix.com:6006
from phoenix.otel import register
# sends traces to https://your-phoenix.com/v1/traces
tracer_provider = register(
protocol="http/protobuf",
)endpoint directlyWhen passing in the endpoint argument, you must specify the fully qualified endpoint. If the PHOENIX_GRPC_PORT environment variable is set, it will override the default gRPC port.
The HTTP transport protocol is inferred from the endpoint
from phoenix.otel import register
tracer_provider = register(endpoint="http://localhost:6006/v1/traces")The GRPC transport protocol is inferred from the endpoint
from phoenix.otel import register
tracer_provider = register(endpoint="http://localhost:4317")Additionally, the protocol argument can be used to enforce the OTLP transport protocol regardless of the endpoint. This might be useful in cases such as when the GRPC endpoint is bound to a different port than the default (4317). The valid protocols are: "http/protobuf", and "grpc".
from phoenix.otel import register
tracer_provider = register(
    endpoint="http://localhost:9999",
    protocol="grpc", # use "http/protobuf" for http transport
)register can be configured with different keyword arguments:
project_name: The Phoenix project name
or use PHOENIX_PROJECT_NAME env. var
headers: Headers to send along with each span payload
or use PHOENIX_CLIENT_HEADERS env. var
batch: Whether or not to process spans in batch
from phoenix.otel import register
tracer_provider = register(
    project_name="otel-test",
    headers={"Authorization": "Bearer TOKEN"},
    batch=True,
)Once you've connected your application to your Phoenix instance using phoenix.otel.register, you need to instrument your application. You have a few options to do this:
Using OpenInference auto-instrumentors. If you've used the auto_instrument flag above, then any instrumentor packages in your environment will be called automatically. For a full list of OpenInference packages, see https://arize.com/docs/phoenix/integrations
Using Phoenix Decorators.
Using Base OTEL.
Learn how to use the phoenix.otel library
Learn how you can use basic OpenTelemetry to instrument your application.
Learn how to use Phoenix's decorators to easily instrument specific methods or code blocks in your application.
Setup tracing for your TypeScript application.
Learn about Projects in Phoenix, and how to use them.
Understand Sessions and how they can be used to group user conversations.
Phoenix uses projects to group traces. If left unspecified, all traces are sent to a default project.
In the notebook, you can set the PHOENIX_PROJECT_NAME environment variable before adding instrumentation or running any of your code.
In python this would look like:
import os

os.environ['PHOENIX_PROJECT_NAME'] = "<your-project-name>"
Note that setting a project via an environment variable only works in a notebook and must be done BEFORE instrumentation is initialized. If you are using OpenInference Instrumentation, see the Server tab for how to set the project name in the Resource attributes.
Alternatively, you can set the project name in your register function call:
from phoenix.otel import register

tracer_provider = register(
    project_name="my-project-name",
    ....
)If you are using Phoenix as a collector and running your application separately, you can set the project name in the Resource attributes for the trace provider.
from openinference.semconv.resource import ResourceAttributes
from openinference.instrumentation.llama_index import LlamaIndexInstrumentor
from opentelemetry import trace as trace_api
from opentelemetry.exporter.otlp.proto.http.trace_exporter import OTLPSpanExporter
from opentelemetry.sdk import trace as trace_sdk
from opentelemetry.sdk.resources import Resource
from opentelemetry.sdk.trace.export import SimpleSpanProcessor

resource = Resource(attributes={
    ResourceAttributes.PROJECT_NAME: '<your-project-name>'
})
tracer_provider = trace_sdk.TracerProvider(resource=resource)
span_exporter = OTLPSpanExporter(endpoint="http://phoenix:6006/v1/traces")
span_processor = SimpleSpanProcessor(span_exporter=span_exporter)
tracer_provider.add_span_processor(span_processor=span_processor)
trace_api.set_tracer_provider(tracer_provider=tracer_provider)
# Add any auto-instrumentation you want
LlamaIndexInstrumentor().instrument()
Projects work by setting something called the Resource attributes (as seen in the OTEL example above). The phoenix server uses the project name attribute to group traces into the appropriate project.
Typically you want traces for an LLM app to all be grouped in one project. However, while working with Phoenix inside a notebook, we provide a utility to temporarily associate spans with different projects. You can use this to trace things like evaluations.
from phoenix.trace import using_project

# Switch project to run evals
with using_project("my-eval-project"):
    # all spans created within this context will be associated with
    # the "my-eval-project" project.
# Run evaluations here...How to track sessions across multiple traces
Sessions UI is available in Phoenix 7.0 and requires a db migration if you're coming from an older version of Phoenix.
A Session is a sequence of traces representing a single session (e.g. a session or a thread). Each response is represented as its own trace, but these traces are linked together by being part of the same session.
To associate traces together, you need to pass in a special metadata key where the value is the unique identifier for that thread.
OpenAI tracing with Sessions
Python
LlamaIndex tracing with Sessions
Python
OpenAI tracing with Sessions
TS/JS
Below is an example of logging conversations:
First make sure you have the required dependancies installed
pip install openinference-instrumentationBelow is an example of how to use openinference.instrumentation to the traces created.
import uuid

import openai
from openinference.instrumentation import using_session
from openinference.semconv.trace import SpanAttributes
from opentelemetry import trace

client = openai.Client()
session_id = str(uuid.uuid4())

tracer = trace.get_tracer(__name__)

@tracer.start_as_current_span(name="agent", attributes={SpanAttributes.OPENINFERENCE_SPAN_KIND: "agent"})
def assistant(
  messages: list[dict],
  session_id: str = str,
):
  current_span = trace.get_current_span()
  current_span.set_attribute(SpanAttributes.SESSION_ID, session_id)
  current_span.set_attribute(SpanAttributes.INPUT_VALUE, messages[-1].get('content'))

  # Propagate the session_id down to spans crated by the OpenAI instrumentation
  # This is not strictly necessary, but it helps to correlate the spans to the same session
  with using_session(session_id):
   response = client.chat.completions.create(
       model="gpt-3.5-turbo",
       messages=[{"role": "system", "content": "You are a helpful assistant."}] + messages,
   ).choices[0].message

  current_span.set_attribute(SpanAttributes.OUTPUT_VALUE, response.content)
  return response

messages = [
  {"role": "user", "content": "hi! im bob"}
]
response = assistant(
  messages,
  session_id=session_id,
)
messages = messages + [
  response,
  {"role": "user", "content": "what's my name?"}
]
response = assistant(
  messages,
  session_id=session_id,
)The easiest way to add sessions to your application is to install @arizeai/openinfernce-core
npm install @arizeai/openinference-core --saveYou now can use either the session.id semantic attribute or the setSession utility function from openinference-core to associate traces with a particular session:
import { trace } from "@opentelemetry/api";
import { SemanticConventions } from "@arizeai/openinference-semantic-conventions";
import { context } from "@opentelemetry/api";
import { setSession } from "@arizeai/openinference-core";

const tracer = trace.getTracer("agent");

const client = new OpenAI({
  apiKey: process.env["OPENAI_API_KEY"], // This is the default and can be omitted
});

async function assistant(params: {
  messages: { role: string; content: string }[];
  sessionId: string;
}) {
  return tracer.startActiveSpan("agent", async (span: Span) => {
    span.setAttribute(SemanticConventions.OPENINFERENCE_SPAN_KIND, "agent");
    span.setAttribute(SemanticConventions.SESSION_ID, params.sessionId);
    span.setAttribute(
      SemanticConventions.INPUT_VALUE,
      messages[messages.length - 1].content,
    );
    try {
      // This is not strictly necessary but it helps propagate the session ID
      // to all child spans
      return context.with(
        setSession(context.active(), { sessionId: params.sessionId }),
        async () => {
          // Calls within this block will generate spans with the session ID set
          const chatCompletion = await client.chat.completions.create({
            messages: params.messages,
            model: "gpt-3.5-turbo",
          });
          const response = chatCompletion.choices[0].message;
          span.setAttribute(SemanticConventions.OUTPUT_VALUE, response.content);
          span.end();
          return response;
        },
      );
    } catch (e) {
      span.error(e);
    }
  });
}

const sessionId = crypto.randomUUID();

let messages = [{ role: "user", content: "hi! im Tim" }];

const res = await assistant({
  messages,
  sessionId: sessionId,
});

messages = [res, { role: "assistant", content: "What is my name?" }];

await assistant({
  messages,
  sessionId: sessionId,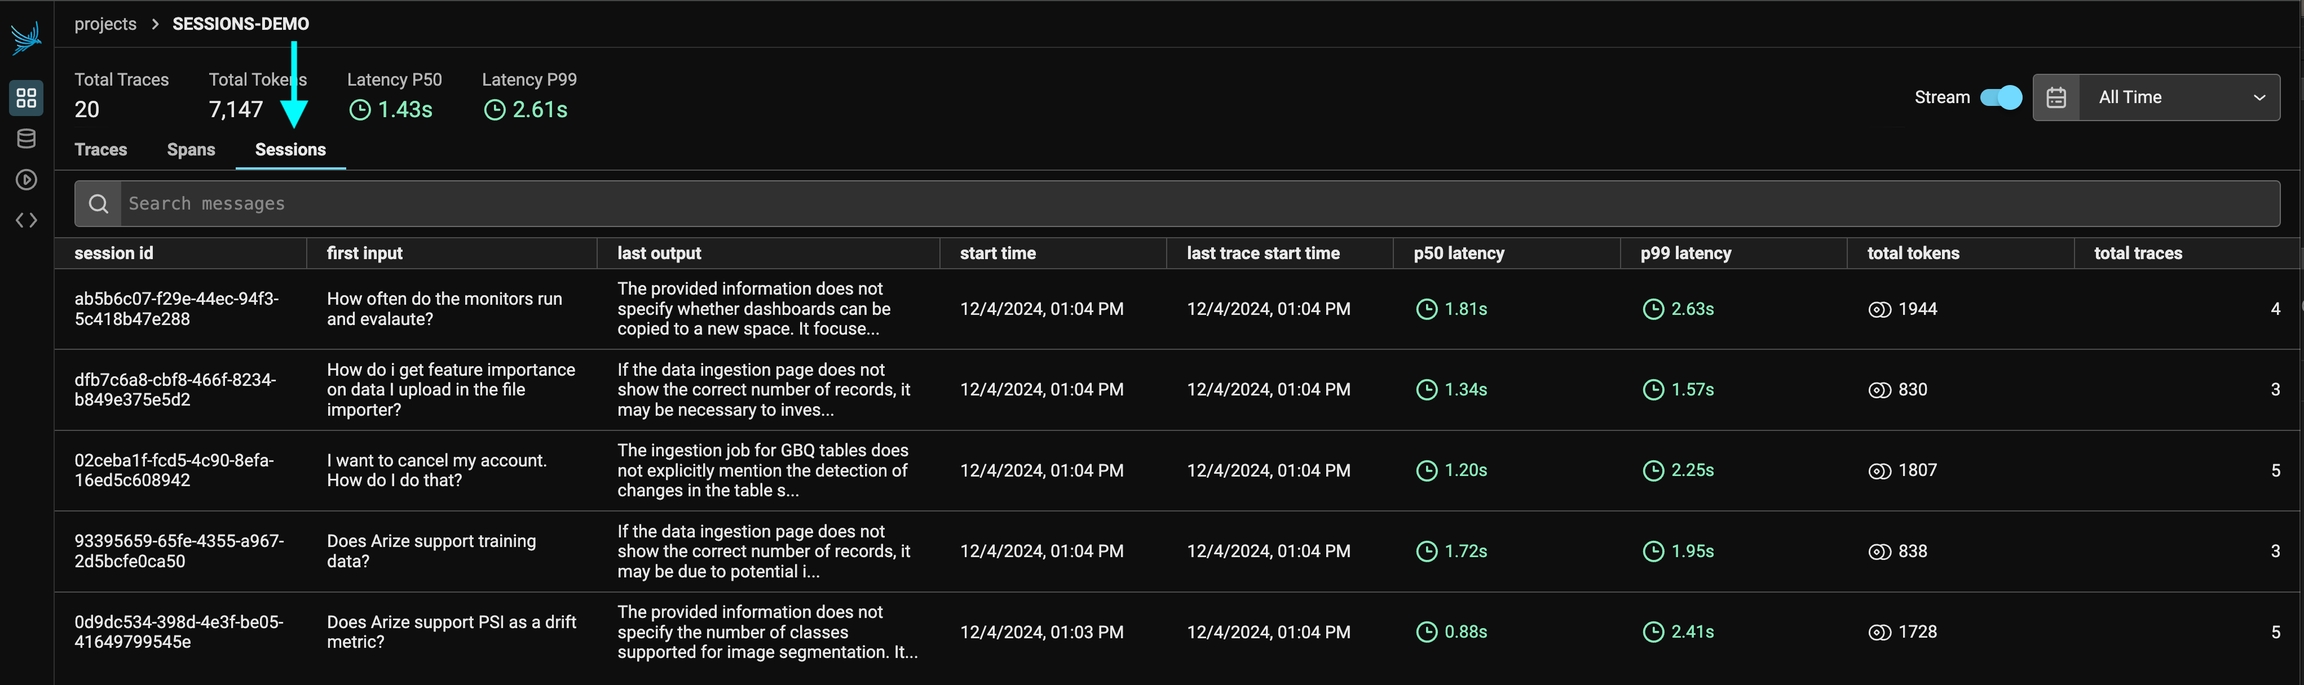
});You can view the sessions for a given project by clicking on the "Sessions" tab in the project. You will see a list of all the recent sessions as well as some analytics. You can search the content of the messages to narrow down the list.
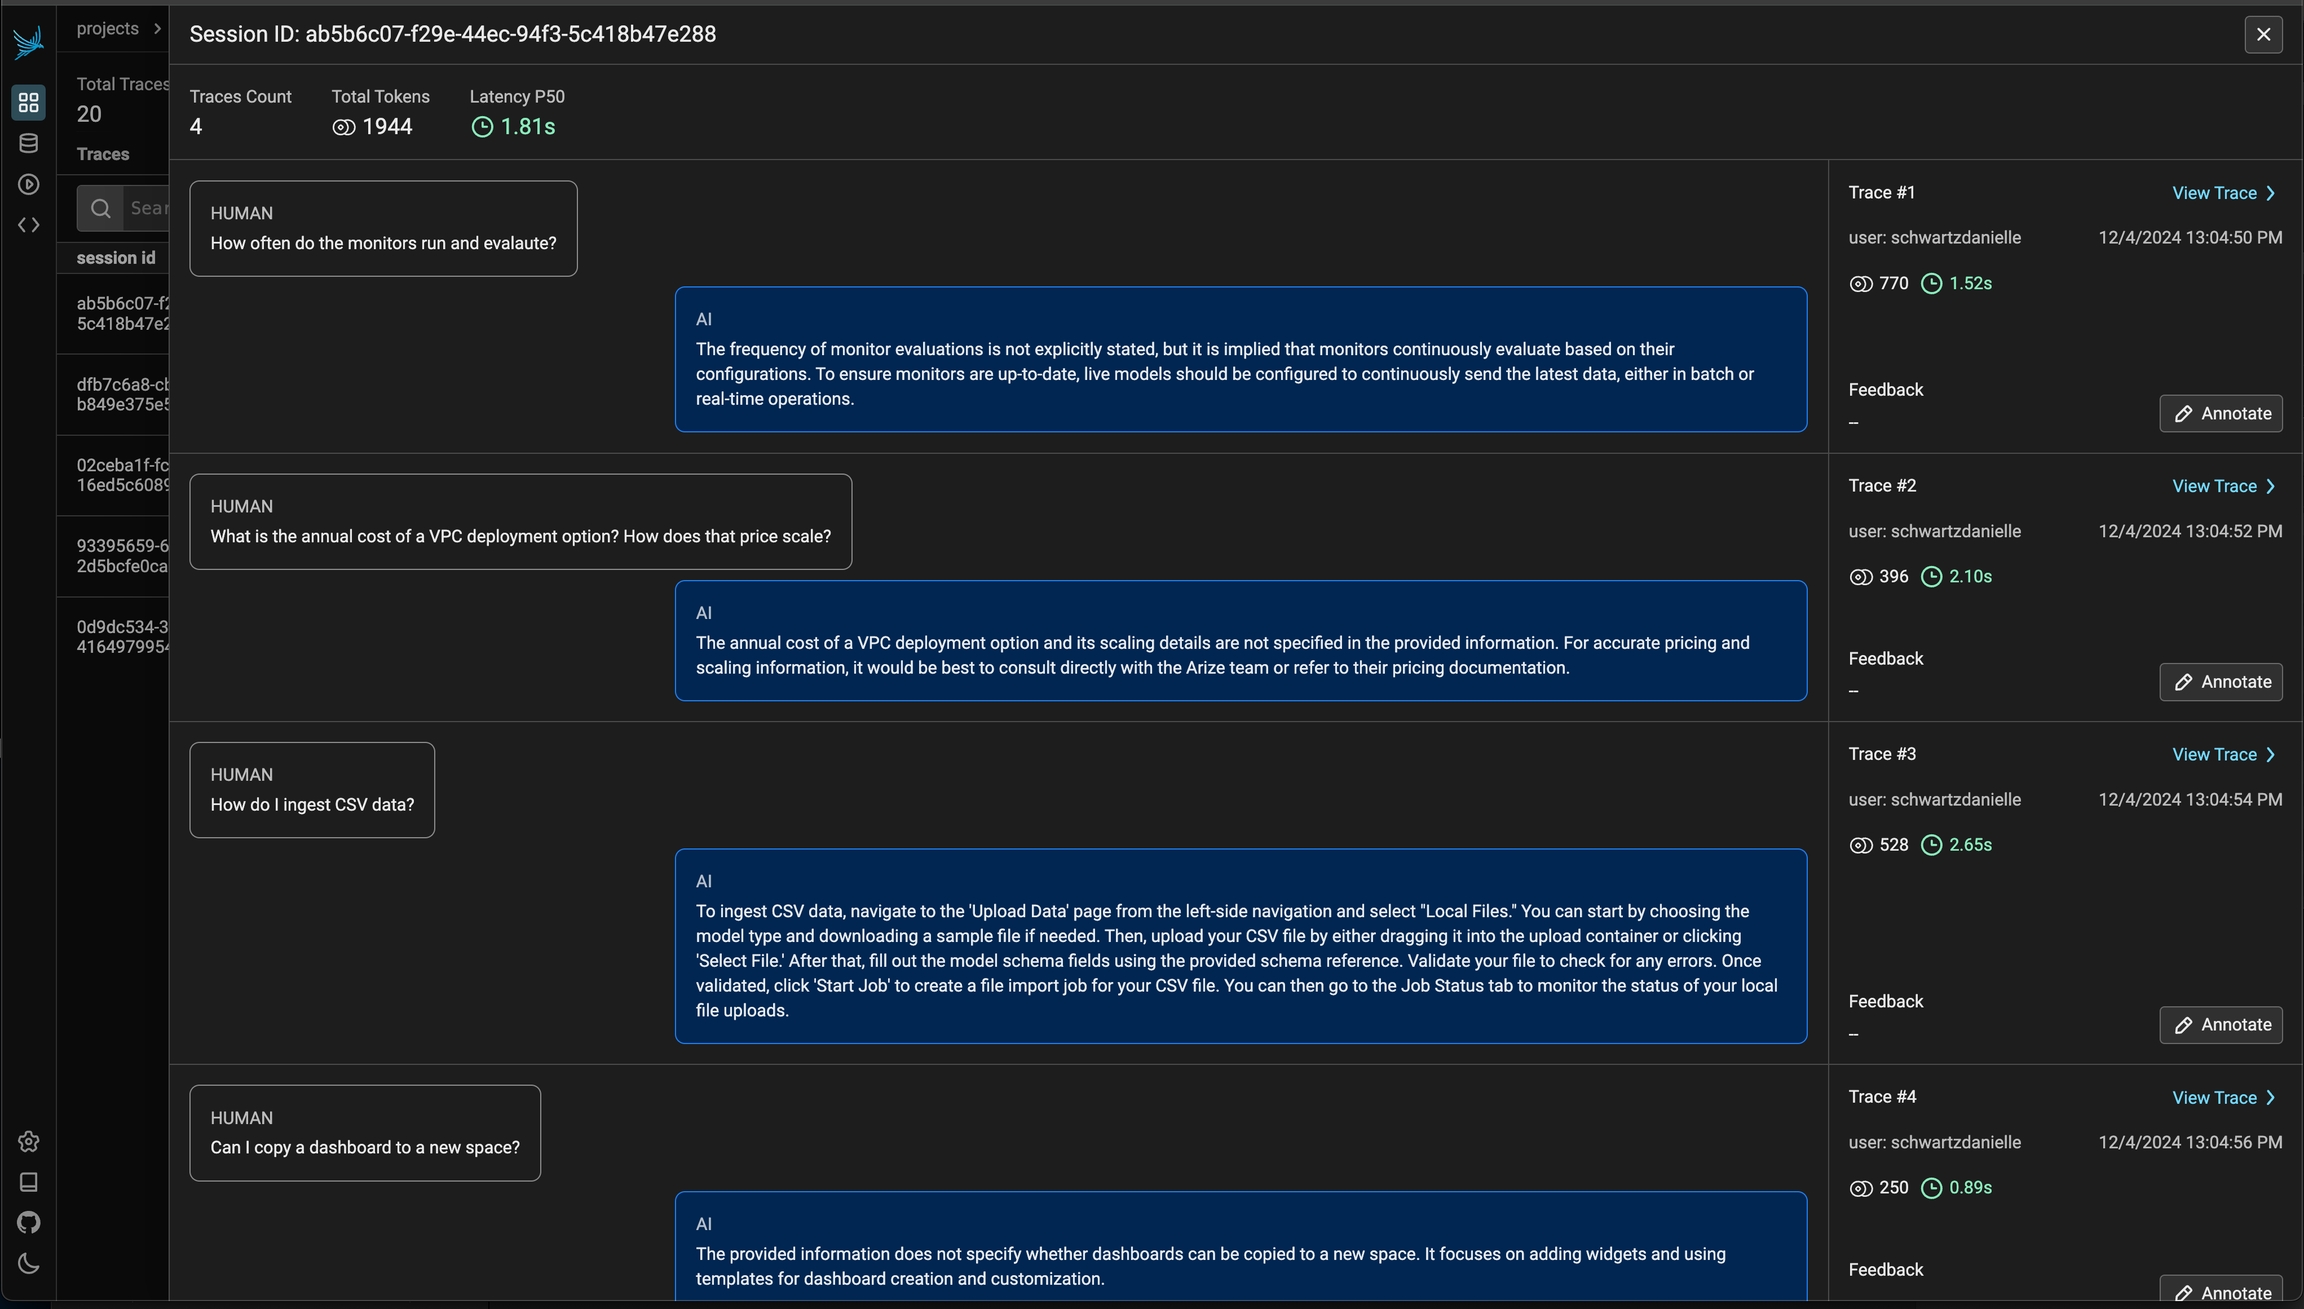
You can then click into a given session. This will open the history of a particular session. If the sessions contain input / output, you will see a chatbot-like UI where you can see the a history of inputs and outputs.
For LangChain, in order to log runs as part of the same thread you need to pass a special metadata key to the run. The key value is the unique identifier for that conversation. The key name should be one of:
session_id
thread_id
conversation_id.
As part of the OpenInference library, Phoenix provides helpful abstractions to make manual instrumentation easier.
This documentation provides a guide on using OpenInference OTEL tracing decorators and methods for instrumenting functions, chains, agents, and tools using OpenTelemetry.
These tools can be combined with, or used in place of, OpenTelemetry instrumentation code. They are designed to simplify the instrumentation process.
If you'd prefer to use pure OTEL instead, see Setup using base OTEL
Ensure you have OpenInference and OpenTelemetry installed:
pip install openinference-semantic-conventions opentelemetry-api opentelemetry-sdkYou can configure the tracer using either TracerProvider from openinference.instrumentation or using phoenix.otel.register.
from phoenix.otel import register

tracer_provider = register(protocol="http/protobuf", project_name="your project name")
tracer = tracer_provider.get_tracer(__name__)from opentelemetry.exporter.otlp.proto.http.trace_exporter import OTLPSpanExporter
from opentelemetry.sdk.resources import Resource
from opentelemetry.sdk.trace.export import ConsoleSpanExporter, SimpleSpanProcessor
from openinference.instrumentation import TracerProvider
from openinference.semconv.resource import ResourceAttributes
endpoint = "http://127.0.0.1:6006/v1/traces"
resource = Resource(attributes={ResourceAttributes.PROJECT_NAME: "openinference-tracer"})
tracer_provider = TracerProvider(resource=resource)
tracer_provider.add_span_processor(SimpleSpanProcessor(OTLPSpanExporter(endpoint)))
tracer = tracer_provider.get_tracer(__name__)Your tracer object can now be used in two primary ways:
@tracer.chain
def my_func(input: str) -> str:
    return "output"
This entire function will appear as a Span in Phoenix. Input and output attributes in Phoenix will be set automatically based on my_func's parameters and return. The status attribute will also be set automatically.
with tracer.start_as_current_span(
    "my-span-name",
    openinference_span_kind="chain",
) as span:
    span.set_input("input")
    span.set_output("output")
    span.set_status(Status(StatusCode.OK))
The code within this clause will be captured as a Span in Phoenix. Here the input, output, and status must be set manually.
This approach is useful when you need only a portion of a method to be captured as a Span.
OpenInference Span Kinds denote the possible types of spans you might capture, and will be rendered different in the Phoenix UI.
The possible values are:\
CHAIN
General logic operations, functions, or code blocks
LLM
Making LLM calls
TOOL
Completing tool calls
RETRIEVER
Retrieving documents
EMBEDDING
Generating embeddings
AGENT
Agent invokations - typically a top level or near top level span
RERANKER
Reranking retrieved context
UNKNOWN
Unknown
GUARDRAIL
Guardrail checks
EVALUATOR
Evaluators - typically only use by Phoenix when automatically tracing evaluation and experiment calls
with tracer.start_as_current_span(
    "chain-span-with-plain-text-io",
    openinference_span_kind="chain",
) as span:
    span.set_input("input")
    span.set_output("output")
span.set_status(Status(StatusCode.OK))@tracer.chain
def decorated_chain_with_plain_text_output(input: str) -> str:
return "output"
decorated_chain_with_plain_text_output("input")@tracer.chain
def decorated_chain_with_json_output(input: str) -> Dict[str, Any]:
return {"output": "output"}
decorated_chain_with_json_output("input")@tracer.chain(name="decorated-chain-with-overriden-name")
def this_name_should_be_overriden(input: str) -> Dict[str, Any]:
return {"output": "output"}
this_name_should_be_overriden("input")with tracer.start_as_current_span(
"agent-span-with-plain-text-io",
openinference_span_kind="agent",
) as span:
span.set_input("input")
span.set_output("output")
span.set_status(Status(StatusCode.OK))@tracer.agent
def decorated_agent(input: str) -> str:
return "output"
decorated_agent("input")with tracer.start_as_current_span(
"tool-span",
openinference_span_kind="tool",
) as span:
span.set_input("input")
span.set_output("output")
span.set_tool(
name="tool-name",
description="tool-description",
parameters={"input": "input"},
)
span.set_status(Status(StatusCode.OK))@tracer.tool
def decorated_tool(input1: str, input2: int) -> None:
"""
tool-description
"""
decorated_tool("input1", 1)@tracer.tool(
name="decorated-tool-with-overriden-name",
description="overriden-tool-description",
)
def this_tool_name_should_be_overriden(input1: str, input2: int) -> None:
"""
this tool description should be overriden
"""
this_tool_name_should_be_overriden("input1", 1)Like other span kinds, LLM spans can be instrumented either via a context manager or via a decorator pattern. It's also possible to directly patch client methods.
While this guide uses the OpenAI Python client for illustration, in practice, you should use the OpenInference auto-instrumentors for OpenAI whenever possible and resort to manual instrumentation for LLM spans only as a last resort.
To run the snippets in this section, set your OPENAI_API_KEY environment variable.
from openai import OpenAI
from opentelemetry.trace import Status, StatusCode

openai_client = OpenAI()

messages = [{"role": "user", "content": "Hello, world!"}]
with tracer.start_as_current_span("llm_span", openinference_span_kind="llm") as span:
    span.set_input(messages)
    try:
        response = openai_client.chat.completions.create(
            model="gpt-4",
            messages=messages,
        )
    except Exception as error:
        span.record_exception(error)
        span.set_status(Status(StatusCode.ERROR))
    else:
        span.set_output(response)
span.set_status(Status(StatusCode.OK))from typing import List
from openai import OpenAI
from openai.types.chat import ChatCompletionMessageParam
openai_client = OpenAI()
@tracer.llm
def invoke_llm(
messages: List[ChatCompletionMessageParam],
) -> str:
response = openai_client.chat.completions.create(
model="gpt-4o",
messages=messages,
)
message = response.choices[0].message
return message.content or ""
invoke_llm([{"role": "user", "content": "Hello, world!"}])This decorator pattern above works for sync functions, async coroutine functions, sync generator functions, and async generator functions. Here's an example with an async generator.
from typing import AsyncGenerator, List

from openai import AsyncOpenAI
from openai.types.chat import ChatCompletionMessageParam

openai_async_client = AsyncOpenAI()


@tracer.llm
async def stream_llm_responses(
    messages: List[ChatCompletionMessageParam],
) -> AsyncGenerator[str, None]:
    stream = await openai_async_client.chat.completions.create(
        model="gpt-4o",
        messages=messages,
        stream=True,
    )
    async for chunk in stream:
        if chunk.choices[0].delta.content:
            yield chunk.choices[0].delta.content


# invoke inside of an async context
async for token in stream_llm_responses([{"role": "user", "content": "Hello, world!"}]):
    print(token, end="")
It's also possible to directly patch methods on a client. This is useful if you want to transparently use the client in your application with instrumentation logic localized in one place.
from openai import OpenAI

openai_client = OpenAI()

# patch the create method
wrapper = tracer.llm
openai_client.chat.completions.create = wrapper(openai_client.chat.completions.create)

# invoke the patched method normally
openai_client.chat.completions.create(
    model="gpt-4o",
    messages=[{"role": "user", "content": "Hello, world!"}],
)
The snippets above produce LLM spans with input and output values, but don't offer rich UI for messages, tools, invocation parameters, etc. In order to manually instrument LLM spans with these features, users can define their own functions to wrangle the input and output of their LLM calls into OpenInference format. The openinference-instrumentation library contains helper functions that produce valid OpenInference attributes for LLM spans:
get_llm_attributes
get_input_attributes
get_output_attributes
For OpenAI, these functions might look like this:
from typing import Any, Dict, List, Optional, Union

from openai.types.chat import (
    ChatCompletion,
    ChatCompletionMessage,
    ChatCompletionMessageParam,
    ChatCompletionToolParam,
)
from opentelemetry.util.types import AttributeValue

import openinference.instrumentation as oi
from openinference.instrumentation import (
    get_input_attributes,
    get_llm_attributes,
    get_output_attributes,
)


def process_input(
    messages: List[ChatCompletionMessageParam],
    model: str,
    temperature: Optional[float] = None,
    tools: Optional[List[ChatCompletionToolParam]] = None,
    **kwargs: Any,
) -> Dict[str, AttributeValue]:
    oi_messages = [convert_openai_message_to_oi_message(message) for message in messages]
    oi_tools = [convert_openai_tool_param_to_oi_tool(tool) for tool in tools or []]
    return {
        **get_input_attributes(
            {
                "messages": messages,
                "model": model,
                "temperature": temperature,
                "tools": tools,
                **kwargs,
            }
        ),
        **get_llm_attributes(
            provider="openai",
            system="openai",
            model_name=model,
            input_messages=oi_messages,
            invocation_parameters={"temperature": temperature},
            tools=oi_tools,
        ),
    }


def convert_openai_message_to_oi_message(
    message_param: Union[ChatCompletionMessageParam, ChatCompletionMessage],
) -> oi.Message:
    if isinstance(message_param, ChatCompletionMessage):
        role: str = message_param.role
        oi_message = oi.Message(role=role)
        if isinstance(content := message_param.content, str):
            oi_message["content"] = content
        if message_param.tool_calls is not None:
            oi_tool_calls: List[oi.ToolCall] = []
            for tool_call in message_param.tool_calls:
                function = tool_call.function
                oi_tool_calls.append(
                    oi.ToolCall(
                        id=tool_call.id,
                        function=oi.ToolCallFunction(
                            name=function.name,
                            arguments=function.arguments,
                        ),
                    )
                )
            oi_message["tool_calls"] = oi_tool_calls
        return oi_message

    role = message_param["role"]
    assert isinstance(message_param["content"], str)
    content = message_param["content"]
    return oi.Message(role=role, content=content)


def convert_openai_tool_param_to_oi_tool(tool_param: ChatCompletionToolParam) -> oi.Tool:
    assert tool_param["type"] == "function"
    return oi.Tool(json_schema=dict(tool_param))


def process_output(response: ChatCompletion) -> Dict[str, AttributeValue]:
    message = response.choices[0].message
    role = message.role
    oi_message = oi.Message(role=role)
    if isinstance(message.content, str):
        oi_message["content"] = message.content
    if isinstance(message.tool_calls, list):
        oi_tool_calls: List[oi.ToolCall] = []
        for tool_call in message.tool_calls:
            tool_call_id = tool_call.id
            function_name = tool_call.function.name
            function_arguments = tool_call.function.arguments
            oi_tool_calls.append(
                oi.ToolCall(
                    id=tool_call_id,
                    function=oi.ToolCallFunction(
                        name=function_name,
                        arguments=function_arguments,
                    ),
                )
            )
        oi_message["tool_calls"] = oi_tool_calls
    output_messages = [oi_message]
    token_usage = response.usage
    oi_token_count: Optional[oi.TokenCount] = None
    if token_usage is not None:
        prompt_tokens = token_usage.prompt_tokens
        completion_tokens = token_usage.completion_tokens
        oi_token_count = oi.TokenCount(
            prompt=prompt_tokens,
            completion=completion_tokens,
        )
    return {
        **get_llm_attributes(
            output_messages=output_messages,
            token_count=oi_token_count,
        ),
        **get_output_attributes(response),
}When using a context manager to create LLM spans, these functions can be used to wrangle inputs and outputs.
import json

from openai import OpenAI
from openai.types.chat import (
    ChatCompletionMessage,
    ChatCompletionMessageParam,
    ChatCompletionToolMessageParam,
    ChatCompletionToolParam,
    ChatCompletionUserMessageParam,
)
from opentelemetry.trace import Status, StatusCode

openai_client = OpenAI()


@tracer.tool
def get_weather(city: str) -> str:
    # make an call to a weather API here
    return "sunny"


messages: List[Union[ChatCompletionMessage, ChatCompletionMessageParam]] = [
    ChatCompletionUserMessageParam(
        role="user",
        content="What's the weather like in San Francisco?",
    )
]
temperature = 0.5
invocation_parameters = {"temperature": temperature}
tools: List[ChatCompletionToolParam] = [
    {
        "type": "function",
        "function": {
            "name": "get_weather",
            "description": "finds the weather for a given city",
            "parameters": {
                "type": "object",
                "properties": {
                    "city": {
                        "type": "string",
                        "description": "The city to find the weather for, e.g. 'London'",
                    }
                },
                "required": ["city"],
            },
        },
    },
]

with tracer.start_as_current_span(
    "llm_tool_call",
    attributes=process_input(
        messages=messages,
        invocation_parameters={"temperature": temperature},
        model="gpt-4",
    ),
    openinference_span_kind="llm",
) as span:
    try:
        response = openai_client.chat.completions.create(
            model="gpt-4o",
            messages=messages,
            temperature=temperature,
            tools=tools,
        )
    except Exception as error:
        span.record_exception(error)
        span.set_status(Status(StatusCode.ERROR))
    else:
        span.set_attributes(process_output(response))
        span.set_status(Status(StatusCode.OK))

output_message = response.choices[0].message
tool_calls = output_message.tool_calls
assert tool_calls and len(tool_calls) == 1
tool_call = tool_calls[0]
city = json.loads(tool_call.function.arguments)["city"]
weather = get_weather(city)
messages.append(output_message)
messages.append(
    ChatCompletionToolMessageParam(
        content=weather,
        role="tool",
        tool_call_id=tool_call.id,
    )
)

with tracer.start_as_current_span(
    "tool_call_response",
    attributes=process_input(
        messages=messages,
        invocation_parameters={"temperature": temperature},
        model="gpt-4",
    ),
    openinference_span_kind="llm",
) as span:
    try:
        response = openai_client.chat.completions.create(
            model="gpt-4o",
            messages=messages,
            temperature=temperature,
        )
    except Exception as error:
        span.record_exception(error)
        span.set_status(Status(StatusCode.ERROR))
    else:
        span.set_attributes(process_output(response))
        span.set_status(Status(StatusCode.OK))
When using the tracer.llm decorator, these functions are passed via the process_input and process_output parameters and should satisfy the following:
The input signature of process_input should exactly match the input signature of the decorated function.
The input signature of process_output has a single argument, the output of the decorated function. This argument accepts the returned value when the decorated function is a sync or async function, or a list of yielded values when the decorated function is a sync or async generator function.
Both process_input and process_output should output a dictionary mapping attribute names to values.
from openai import NOT_GIVEN, OpenAI
from openai.types.chat import ChatCompletion

openai_client = OpenAI()


@tracer.llm(
    process_input=process_input,
    process_output=process_output,
)
def invoke_llm(
    messages: List[ChatCompletionMessageParam],
    model: str,
    temperature: Optional[float] = None,
    tools: Optional[List[ChatCompletionToolParam]] = None,
) -> ChatCompletion:
    response: ChatCompletion = openai_client.chat.completions.create(
        messages=messages,
        model=model,
        tools=tools or NOT_GIVEN,
        temperature=temperature,
    )
    return response


invoke_llm(
    messages=[{"role": "user", "content": "Hello, world!"}],
    temperature=0.5,
    model="gpt-4",
)
When decorating a generator function, process_output should accept a single argument, a list of the values yielded by the decorated function.
from typing import Dict, List, Optional

from openai.types.chat import ChatCompletionChunk
from opentelemetry.util.types import AttributeValue

import openinference.instrumentation as oi
from openinference.instrumentation import (
    get_llm_attributes,
    get_output_attributes,
)


def process_generator_output(
    outputs: List[ChatCompletionChunk],
) -> Dict[str, AttributeValue]:
    role: Optional[str] = None
    content = ""
    oi_token_count = oi.TokenCount()
    for chunk in outputs:
        if choices := chunk.choices:
            assert len(choices) == 1
            delta = choices[0].delta
            if isinstance(delta.content, str):
                content += delta.content
            if isinstance(delta.role, str):
                role = delta.role
        if (usage := chunk.usage) is not None:
            if (prompt_tokens := usage.prompt_tokens) is not None:
                oi_token_count["prompt"] = prompt_tokens
            if (completion_tokens := usage.completion_tokens) is not None:
                oi_token_count["completion"] = completion_tokens
    oi_messages = []
    if role and content:
        oi_messages.append(oi.Message(role=role, content=content))
    return {
        **get_llm_attributes(
            output_messages=oi_messages,
            token_count=oi_token_count,
        ),
        **get_output_attributes(content),
    }
Then the decoration is the same as before.
from typing import AsyncGenerator

from openai import AsyncOpenAI
from openai.types.chat import ChatCompletionChunk

openai_async_client = AsyncOpenAI()


@tracer.llm(
    process_input=process_input,  # same as before
    process_output=process_generator_output,
)
async def stream_llm_response(
    messages: List[ChatCompletionMessageParam],
    model: str,
    temperature: Optional[float] = None,
) -> AsyncGenerator[ChatCompletionChunk, None]:
    async for chunk in await openai_async_client.chat.completions.create(
        messages=messages,
        model=model,
        temperature=temperature,
        stream=True,
    ):
        yield chunk


async for chunk in stream_llm_response(
    messages=[{"role": "user", "content": "Hello, world!"}],
    temperature=0.5,
    model="gpt-4",
):
print(chunk)As before, it's possible to directly patch the method on the client. Just ensure that the input signatures of process_input and the patched method match.
from openai import OpenAI
from openai.types.chat import ChatCompletionMessageParam

openai_client = OpenAI()

# patch the create method
wrapper = tracer.llm(
    process_input=process_input,
    process_output=process_output,
)
openai_client.chat.completions.create = wrapper(openai_client.chat.completions.create)

# invoke the patched method normally
openai_client.chat.completions.create(
    model="gpt-4o",
    messages=[{"role": "user", "content": "Hello, world!"}],
)The OpenInference Tracer shown above respects context Managers for Suppressing Tracing & Adding Metadata
with suppress_tracing():
    # this trace will not be recorded
    with tracer.start_as_current_span(
        "THIS-SPAN-SHOULD-NOT-BE-TRACED",
        openinference_span_kind="chain",
    ) as span:
        span.set_input("input")
        span.set_output("output")
span.set_status(Status(StatusCode.OK))with using_attributes(session_id="123"):
# this trace has session id "123"
with tracer.start_as_current_span(
"chain-span-with-context-attributes",
openinference_span_kind="chain",
) as span:
span.set_input("input")
span.set_output("output")
span.set_status(Status(StatusCode.OK))OpenInference includes message types that can be useful in composing text and image or other file inputs and outputs:
import openinference.instrumentation as oi

image_url = "https://upload.wikimedia.org/wikipedia/commons/thumb/d/dd/Gfp-wisconsin-madison-the-nature-boardwalk.jpg/2560px-Gfp-wisconsin-madison-the-nature-boardwalk.jpg"
text = "describe the weather in this image"
content = [
        {"type": "text", "text": text},
        {
            "type": "image_url",
            "image_url": {"url": image_url, "detail": "low"},
        },
    ]

image = oi.Image(url=image_url)
contents = [
    oi.TextMessageContent(
        type="text",
        text=text,
    ),
    oi.ImageMessageContent(
        type="image",
        image=image,
    ),
]
messages = [
    oi.Message(
        role="user",
        contents=contents,
    )
]

with tracer.start_as_current_span(
    "my-span-name",
    openinference_span_kind="llm",
    attributes=oi.get_llm_attributes(input_messages=messages)
) as span:
    span.set_input(text)

    # Call your LLM here
    response = "This is a test response"

    span.set_output(response)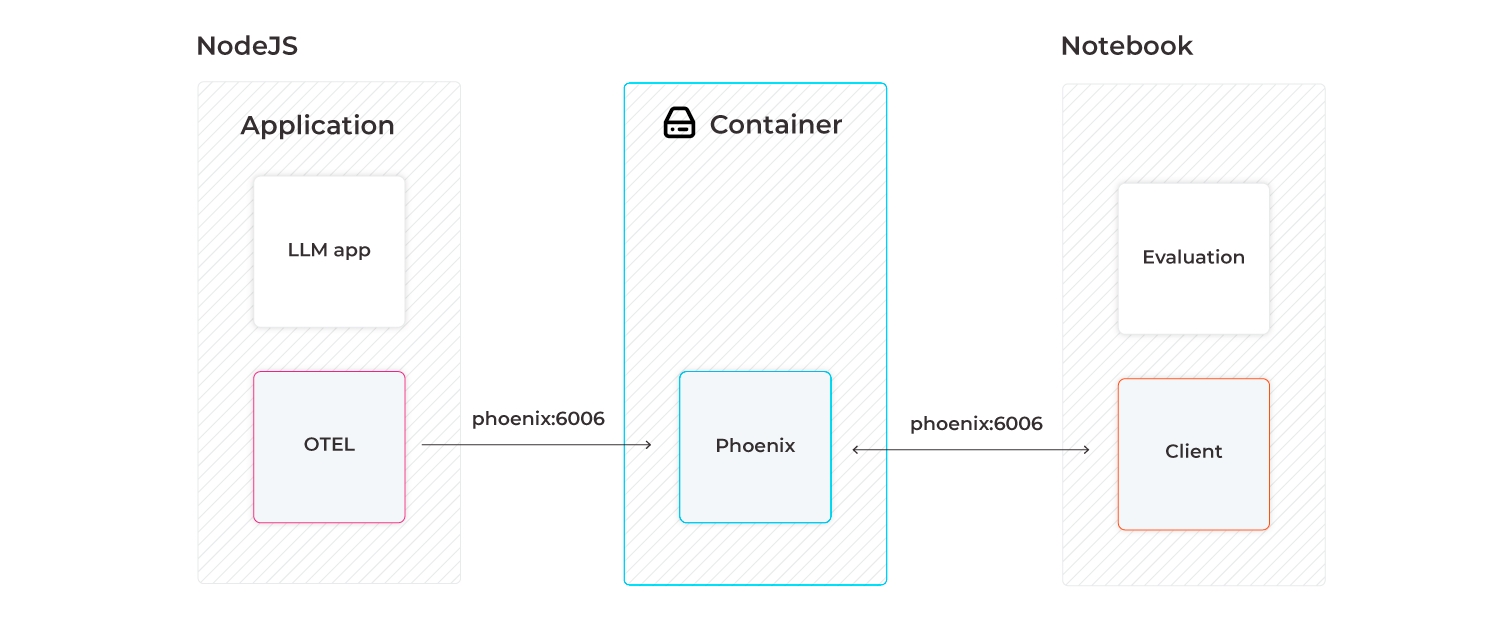
print(response.content)Phoenix is written and maintained in Python to make it natively runnable in Python notebooks. However, it can be stood up as a trace collector so that your LLM traces from your NodeJS application (e.g., LlamaIndex.TS, Langchain.js) can be collected. The traces collected by Phoenix can then be downloaded to a Jupyter notebook and used to run evaluations (e.g., LLM Evals, Ragas).
Instrumentation is the act of adding observability code to an app yourself.
If you’re instrumenting an app, you need to use the OpenTelemetry SDK for your language. You’ll then use the SDK to initialize OpenTelemetry and the API to instrument your code. This will emit telemetry from your app, and any library you installed that also comes with instrumentation.
Phoenix natively supports automatic instrumentation provided by OpenInference. For more details on OpenInference, checkout the project on GitHub.
Now lets walk through instrumenting, and then tracing, a sample express application.
Install OpenTelemetry API packages:
# npm, pnpm, yarn, etc
npm install @opentelemetry/semantic-conventions @opentelemetry/api @opentelemetry/instrumentation @opentelemetry/resources @opentelemetry/sdk-trace-base @opentelemetry/sdk-trace-node @opentelemetry/exporter-trace-otlp-proto
Install OpenInference instrumentation packages. Below is an example of adding instrumentation for OpenAI as well as the semantic conventions for OpenInference.
# npm, pnpm, yarn, etc
npm install openai @arizeai/openinference-instrumentation-openai @arizeai/openinference-semantic-conventionsTo enable tracing in your app, you’ll need to have an initialized TracerProvider.
If a TracerProvider is not created, the OpenTelemetry APIs for tracing will use a no-op implementation and fail to generate data. As explained next, create an instrumentation.ts (or instrumentation.js) file to include all of the provider initialization code in Node.
Node.js
Create instrumentation.ts (or instrumentation.js) to contain all the provider initialization code:
// instrumentation.ts
import { registerInstrumentations } from "@opentelemetry/instrumentation";
import { OpenAIInstrumentation } from "@arizeai/openinference-instrumentation-openai";
import { diag, DiagConsoleLogger, DiagLogLevel } from "@opentelemetry/api";
import { OTLPTraceExporter } from "@opentelemetry/exporter-trace-otlp-proto";
import { resourceFromAttributes } from "@opentelemetry/resources";
import { BatchSpanProcessor } from "@opentelemetry/sdk-trace-base";
import { NodeTracerProvider } from "@opentelemetry/sdk-trace-node";
import { ATTR_SERVICE_NAME } from "@opentelemetry/semantic-conventions";
import { SEMRESATTRS_PROJECT_NAME } from "@arizeai/openinference-semantic-conventions";
import OpenAI from "openai";

// For troubleshooting, set the log level to DiagLogLevel.DEBUG
diag.setLogger(new DiagConsoleLogger(), DiagLogLevel.DEBUG);

const tracerProvider = new NodeTracerProvider({
  resource: resourceFromAttributes({
    [ATTR_SERVICE_NAME]: "openai-service",
    // Project name in Phoenix, defaults to "default"
    [SEMRESATTRS_PROJECT_NAME]: "openai-service",
  }),
  spanProcessors: [
    // BatchSpanProcessor will flush spans in batches after some time,
    // this is recommended in production. For development or testing purposes
    // you may try SimpleSpanProcessor for instant span flushing to the Phoenix UI.
    new BatchSpanProcessor(
      new OTLPTraceExporter({
        url: `http://localhost:6006/v1/traces`,
        // (optional) if connecting to Phoenix Cloud
        // headers: { "api_key": process.env.PHOENIX_API_KEY },
        // (optional) if connecting to self-hosted Phoenix with Authentication enabled
        // headers: { "Authorization": `Bearer ${process.env.PHOENIX_API_KEY}` }
      })
    ),
  ],
});
tracerProvider.register();

const instrumentation = new OpenAIInstrumentation();
instrumentation.manuallyInstrument(OpenAI);

registerInstrumentations({
  instrumentations: [instrumentation],
});

console.log("👀 OpenInference initialized");
This basic setup has will instrument chat completions via native calls to the OpenAI client.
As shown above with OpenAI, you can register additional instrumentation libraries with the OpenTelemetry provider in order to generate telemetry data for your dependencies. For more information, see Integrations.
Picking the right span processor
In our instrumentation.ts file above, we use the BatchSpanProcessor. The BatchSpanProcessor processes spans in batches before they are exported. This is usually the right processor to use for an application.
In contrast, the SimpleSpanProcessor processes spans as they are created. This means that if you create 5 spans, each will be processed and exported before the next span is created in code. This can be helpful in scenarios where you do not want to risk losing a batch, or if you’re experimenting with OpenTelemetry in development. However, it also comes with potentially significant overhead, especially if spans are being exported over a network - each time a call to create a span is made, it would be processed and sent over a network before your app’s execution could continue.
In most cases, stick with BatchSpanProcessor over SimpleSpanProcessor.
Tracing instrumented libraries
Now that you have configured a tracer provider, and instrumented the openai package, lets see how we can generate traces for a sample application.
First, install the dependencies required for our sample app.
# npm, pnpm, yarn, etc
npm install express
Next, create an app.ts (or app.js ) file, that hosts a simple express server for executing OpenAI chat completions.
// app.ts
import express from "express";
import OpenAI from "openai";

const PORT: number = parseInt(process.env.PORT || "8080");
const app = express();

const openai = new OpenAI({
  apiKey: process.env.OPENAI_API_KEY,
});

app.get("/chat", async (req, res) => {
  const message = req.query.message;
  const chatCompletion = await openai.chat.completions.create({
    messages: [{ role: "user", content: message }],
    model: "gpt-4o",
  });
  res.send(chatCompletion.choices[0].message.content);
});

app.listen(PORT, () => {
  console.log(`Listening for requests on http://localhost:${PORT}`);
});
Then, we will start our application, loading the instrumentation.ts file before app.ts so that our instrumentation code can instrument openai .
# node v23
node --require ./instrumentation.ts app.tsFinally, we can execute a request against our server
curl "http://localhost:8080/chat?message=write%20me%20a%20haiku"After a few moments, a new project openai-service will appear in the Phoenix UI, along with the trace generated by our OpenAI chat completion!
Anywhere in your application where you write manual tracing code should call getTracer to acquire a tracer. For example:
import opentelemetry from '@opentelemetry/api';
//...

const tracer = opentelemetry.trace.getTracer(
  'instrumentation-scope-name',
  'instrumentation-scope-version',
);

// You can now use a 'tracer' to do tracing!
The values of instrumentation-scope-name and instrumentation-scope-version should uniquely identify the Instrumentation Scope, such as the package, module or class name. While the name is required, the version is still recommended despite being optional.
It’s generally recommended to call getTracer in your app when you need it rather than exporting the tracer instance to the rest of your app. This helps avoid trickier application load issues when other required dependencies are involved.
Below is an example of acquiring a tracer within application scope.
// app.ts
import { trace } from '@opentelemetry/api';
import express from 'express';
import OpenAI from "openai";

const tracer = trace.getTracer('llm-server', '0.1.0');

const PORT: number = parseInt(process.env.PORT || "8080");
const app = express();

const openai = new OpenAI({
  apiKey: process.env.OPENAI_API_KEY,
});

app.get("/chat", async (req, res) => {
  const message = req.query.message;
  const chatCompletion = await openai.chat.completions.create({
    messages: [{ role: "user", content: message }],
    model: "gpt-4o",
  });
  res.send(chatCompletion.choices[0].message.content);
});

app.listen(PORT, () => {
  console.log(`Listening for requests on http://localhost:${PORT}`);
});Now that you have tracers initialized, you can create spans.
The API of OpenTelemetry JavaScript exposes two methods that allow you to create spans:
tracer.startSpan: Starts a new span without setting it on context.
tracer.startActiveSpan: Starts a new span and calls the given callback function passing it the created span as first argument. The new span gets set in context and this context is activated for the duration of the function call.
In most cases you want to use the latter (tracer.startActiveSpan), as it takes care of setting the span and its context active.
The code below illustrates how to create an active span.
import { trace, Span } from "@opentelemetry/api";
import { SpanKind } from "@opentelemetry/api";
import {
    SemanticConventions,
    OpenInferenceSpanKind,
} from "@arizeai/openinference-semantic-conventions";

export function chat(message: string) {
    // Create a span. A span must be closed.
    return tracer.startActiveSpan(
        "chat",
        (span: Span) => {
            span.setAttributes({
                [SemanticConventions.OPENINFERENCE_SPAN_KIND]: OpenInferenceSpanKind.chain,
                [SemanticConventions.INPUT_VALUE]: message,
            });
            let chatCompletion = await openai.chat.completions.create({
                messages: [{ role: "user", content: message }],
                model: "gpt-3.5-turbo",
            });
            span.setAttributes({
                attributes: {
                    [SemanticConventions.OUTPUT_VALUE]: chatCompletion.choices[0].message,
                },
            });
            // Be sure to end the span!
            span.end();
            return result;
        }
    );
}
The above instrumented code can now be pasted in the /chat handler. You should now be able to see spans emitted from your app.
Start your app as follows, and then send it requests by visiting http://localhost:8080/chat?message="how long is a pencil" with your browser or curl.
ts-node --require ./instrumentation.ts app.tsAfter a while, you should see the spans printed in the console by the ConsoleSpanExporter, something like this:
{
  "traceId": "6cc927a05e7f573e63f806a2e9bb7da8",
  "parentId": undefined,
  "name": "chat",
  "id": "117d98e8add5dc80",
  "kind": 0,
  "timestamp": 1688386291908349,
  "duration": 501,
  "attributes": {
    "openinference.span.kind": "chain"
    "input.value": "how long is a pencil"
  },
  "status": { "code": 0 },
  "events": [],
  "links": []
}Sometimes it’s helpful to do something with the current/active span at a particular point in program execution.
const activeSpan = opentelemetry.trace.getActiveSpan();

// do something with the active span, optionally ending it if that is appropriate for your use case.It can also be helpful to get the span from a given context that isn’t necessarily the active span.
const ctx = getContextFromSomewhere();
const span = opentelemetry.trace.getSpan(ctx);

// do something with the acquired span, optionally ending it if that is appropriate for your use case.
Attributes let you attach key/value pairs to a Span so it carries more information about the current operation that it’s tracking. For OpenInference related attributes, use the @arizeai/openinference-semantic-conventions keys. However you are free to add any attributes you'd like!
function chat(message: string, user: User) {
  return tracer.startActiveSpan(`chat:${i}`, (span: Span) => {
    const result = Math.floor(Math.random() * (max - min) + min);

    // Add an attribute to the span
    span.setAttribute('mycompany.userid', user.id);

    span.end();
    return result;
  });
}
You can also add attributes to a span as it’s created:
tracer.startActiveSpan(
  'app.new-span',
  { attributes: { attribute1: 'value1' } },
  (span) => {
    // do some work...

    span.end();
  },
);function chat(session: Session) {
return tracer.startActiveSpan(
'chat',
{ attributes: { 'mycompany.sessionid': session.id } },
(span: Span) => {
/* ... */
},
);
}Semantic Attributes
There are semantic conventions for spans representing operations in well-known protocols like HTTP or database calls. OpenInference also publishes it's own set of semantic conventions related to LLM applications. Semantic conventions for these spans are defined in the specification under OpenInference. In the simple example of this guide the source code attributes can be used.
First add both semantic conventions as a dependency to your application:
npm install --save @opentelemetry/semantic-conventions @arizeai/openinfernece-semantic-conventionsAdd the following to the top of your application file:
import { SemanticAttributes } from 'arizeai/openinfernece-semantic-conventions';Finally, you can update your file to include semantic attributes:
const doWork = () => {
  tracer.startActiveSpan('app.doWork', (span) => {
    span.setAttribute(SemanticAttributes.INPUT_VALUE, 'work input');
    // Do some work...

    span.end();
  });
};A Span Event is a human-readable message on an Span that represents a discrete event with no duration that can be tracked by a single timestamp. You can think of it like a primitive log.
span.addEvent('Doing something');

const result = doWork();
You can also create Span Events with additional Attributes
While Phoenix captures these, they are currently not displayed in the UI. Contact us if you would like to support!
span.addEvent('some log', {
  'log.severity': 'error',
  'log.message': 'Data not found',
  'request.id': requestId,
});A Status can be set on a Span, typically used to specify that a Span has not completed successfully - Error. By default, all spans are Unset, which means a span completed without error. The Ok status is reserved for when you need to explicitly mark a span as successful rather than stick with the default of Unset (i.e., “without error”).
The status can be set at any time before the span is finished.
import opentelemetry, { SpanStatusCode } from '@opentelemetry/api';

// ...

tracer.startActiveSpan('app.doWork', (span) => {
  for (let i = 0; i <= Math.floor(Math.random() * 40000000); i += 1) {
    if (i > 10000) {
      span.setStatus({
        code: SpanStatusCode.ERROR,
        message: 'Error',
      });
    }
  }

  span.end();
});It can be a good idea to record exceptions when they happen. It’s recommended to do this in conjunction with setting span status.
import opentelemetry, { SpanStatusCode } from '@opentelemetry/api';

// ...

try {
  doWork();
} catch (ex) {
  span.recordException(ex);
  span.setStatus({ code: SpanStatusCode.ERROR });
}sdk-trace-base and manually propagating span contextIn some cases, you may not be able to use either the Node.js SDK nor the Web SDK. The biggest difference, aside from initialization code, is that you’ll have to manually set spans as active in the current context to be able to create nested spans.
Initializing tracing with sdk-trace-base
Initializing tracing is similar to how you’d do it with Node.js or the Web SDK.
import opentelemetry from '@opentelemetry/api';
import {
  BasicTracerProvider,
  BatchSpanProcessor,
  ConsoleSpanExporter,
} from '@opentelemetry/sdk-trace-base';

const provider = new BasicTracerProvider();

// Configure span processor to send spans to the exporter
provider.addSpanProcessor(new BatchSpanProcessor(new ConsoleSpanExporter()));
provider.register();

// This is what we'll access in all instrumentation code
const tracer = opentelemetry.trace.getTracer('example-basic-tracer-node');
Like the other examples in this document, this exports a tracer you can use throughout the app.
Creating nested spans with sdk-trace-base
To create nested spans, you need to set whatever the currently-created span is as the active span in the current context. Don’t bother using startActiveSpan because it won’t do this for you.
const mainWork = () => {
  const parentSpan = tracer.startSpan('main');

  for (let i = 0; i < 3; i += 1) {
    doWork(parentSpan, i);
  }

  // Be sure to end the parent span!
  parentSpan.end();
};

const doWork = (parent, i) => {
  // To create a child span, we need to mark the current (parent) span as the active span
  // in the context, then use the resulting context to create a child span.
  const ctx = opentelemetry.trace.setSpan(
    opentelemetry.context.active(),
    parent,
  );
  const span = tracer.startSpan(`doWork:${i}`, undefined, ctx);

  // simulate some random work.
  for (let i = 0; i <= Math.floor(Math.random() * 40000000); i += 1) {
    // empty
  }

  // Make sure to end this child span! If you don't,
  // it will continue to track work beyond 'doWork'!
  span.end();
};
All other APIs behave the same when you use sdk-trace-base compared with the Node.js SDKs.
While the spans created via Phoenix and OpenInference create a solid foundation for tracing your application, sometimes you need to create and customize your LLM spans
Phoenix and OpenInference use the OpenTelemetry Trace API to create spans. Because Phoenix supports OpenTelemetry, this means that you can perform manual instrumentation, no LLM framework required! This guide will help you understand how to create and customize spans using the OpenTelemetry Trace API.
First, ensure you have the API and SDK packages:
pip install opentelemetry-api
pip install opentelemetry-sdk
pip install opentelemetry-exporter-otlp
Let's next install the OpenInference Semantic Conventions package so that we can construct spans with LLM semantic conventions:
pip install openinference-semantic-conventionsFor full documentation on the OpenInference semantic conventions, please consult the specification
Configuring an OTel tracer involves some boilerplate code that the instrumentors in phoenix.trace take care of for you. If you're manually instrumenting your application, you'll need to implement this boilerplate yourself:
from openinference.semconv.resource import ResourceAttributes
from opentelemetry import trace
from opentelemetry.exporter.otlp.proto.http.trace_exporter import OTLPSpanExporter
from opentelemetry.sdk.resources import Resource
from opentelemetry.sdk.trace import TracerProvider
from opentelemetry.sdk.trace.export import SimpleSpanProcessor
from phoenix.config import get_env_host, get_env_port

resource = Resource(attributes={
    ResourceAttributes.PROJECT_NAME: '<your-project-name>'
})
tracer_provider = TracerProvider(resource=resource)
trace.set_tracer_provider(tracer_provider)
tracer = trace.get_tracer(__name__)
collector_endpoint = f"http://{get_env_host()}:{get_env_port()}/v1/traces"
span_exporter = OTLPSpanExporter(endpoint=collector_endpoint)
simple_span_processor = SimpleSpanProcessor(span_exporter=span_exporter)
trace.get_tracer_provider().add_span_processor(simple_span_processor)
This snippet contains a few OTel concepts:
A resource represents an origin (e.g., a particular service, or in this case, a project) from which your spans are emitted.
Span processors filter, batch, and perform operations on your spans prior to export.
Your tracer provides a handle for you to create spans and add attributes in your application code.
The collector (e.g., Phoenix) receives the spans exported by your application.
If you're using Phoenix Cloud or a local Phoenix with auth enabled:
Modify your span exporter to include your API key:
headers = {"Authorization": f"Bearer {os.environ['PHOENIX_API_KEY']}"}
exporter = OTLPSpanExporter(endpoint=collector_endpoint, headers=headers)To create a span, you'll typically want it to be started as the current span.
def do_work():
    with tracer.start_as_current_span("span-name") as span:
        # do some work that 'span' will track
        print("doing some work...")
        # When the 'with' block goes out of scope, 'span' is closed for you
You can also use start_span to create a span without making it the current span. This is usually done to track concurrent or asynchronous operations.
If you have a distinct sub-operation you'd like to track as a part of another one, you can create span to represent the relationship:
def do_work():
    with tracer.start_as_current_span("parent") as parent:
        # do some work that 'parent' tracks
        print("doing some work...")
        # Create a nested span to track nested work
        with tracer.start_as_current_span("child") as child:
            # do some work that 'child' tracks
            print("doing some nested work...")
            # the nested span is closed when it's out of scope

        # This span is also closed when it goes out of scope
When you view spans in a trace visualization tool, child will be tracked as a nested span under parent.
It's common to have a single span track the execution of an entire function. In that scenario, there is a decorator you can use to reduce code:
@tracer.start_as_current_span("do_work")
def do_work():
    print("doing some work...")
Use of the decorator is equivalent to creating the span inside do_work() and ending it when do_work() is finished.
To use the decorator, you must have a tracer instance in scope for your function declaration.
If you need to add attributes or events then it's less convenient to use a decorator.
Sometimes it's helpful to access whatever the current span is at a point in time so that you can enrich it with more information.
from opentelemetry import trace

current_span = trace.get_current_span()
# enrich 'current_span' with some informationAttributes let you attach key/value pairs to a spans so it carries more information about the current operation that it's tracking.
from opentelemetry import trace

current_span = trace.get_current_span()

current_span.set_attribute("operation.value", 1)
current_span.set_attribute("operation.name", "Saying hello!")
current_span.set_attribute("operation.other-stuff", [1, 2, 3])
Notice above that the attributes have a specific prefix operation. When adding custom attributes, it's best practice to vendor your attributes (e.x. mycompany.) so that your attributes do not clash with semantic conventions.
Semantic attributes are pre-defined attributes that are well-known naming conventions for common kinds of data. Using semantic attributes lets you normalize this kind of information across your systems. In the case of Phoenix, the OpenInference Semantic Conventions package provides a set of well-known attributes that are used to represent LLM application specific semantic conventions.
To use OpenInference Semantic Attributes in Python, ensure you have the semantic conventions package:
pip install openinference-semantic-conventionsThen you can use it in code:
from opentelemetry import trace
from openinference.semconv.trace import SpanAttributes

# ...

current_span = trace.get_current_span()
current_span.set_attribute(SpanAttributes.INPUT_VALUE, "Hello world!")
current_span.set_attribute(SpanAttributes.LLM_MODEL_NAME, "gpt-3.5-turbo")Events are human-readable messages that represent "something happening" at a particular moment during the lifetime of a span. You can think of it as a primitive log.
from opentelemetry import trace

current_span = trace.get_current_span()

current_span.add_event("Gonna try it!")

# Do the thing

current_span.add_event("Did it!")The span status allows you to signal the success or failure of the code executed within the span.
from opentelemetry import trace
from opentelemetry.trace import Status, StatusCode

current_span = trace.get_current_span()

try:
    # something that might fail
except:
current_span.set_status(Status(StatusCode.ERROR))It can be a good idea to record exceptions when they happen. It’s recommended to do this in conjunction with setting span status.
from opentelemetry import trace
from opentelemetry.trace import Status, StatusCode

current_span = trace.get_current_span()

try:
    # something that might fail

# Consider catching a more specific exception in your code
except Exception as ex:
    current_span.set_status(Status(StatusCode.ERROR))
    current_span.record_exception(ex)