AI Observability and Evaluation
Running Phoenix for the first time? Select a quickstart below.
Check out a comprehensive list of example notebooks for LLM Traces, Evals, RAG Analysis, and more.
Add instrumentation for popular packages and libraries such as OpenAI, LangGraph, Vercel AI SDK and more.
Join the Phoenix Slack community to ask questions, share findings, provide feedback, and connect with other developers.
Not sure where to start? Try a quickstart:
Phoenix is a comprehensive platform designed to enable observability across every layer of an LLM-based system, empowering teams to build, optimize, and maintain high-quality applications and agents efficiently.
During the development phase, Phoenix offers essential tools for debugging, experimentation, evaluation, prompt tracking, and search and retrieval.
Phoenix's tracing and span analysis capabilities are invaluable during the prototyping and debugging stages. By instrumenting application code with Phoenix, teams gain detailed insights into the execution flow, making it easier to identify and resolve issues. Developers can drill down into specific spans, analyze performance metrics, and access relevant logs and metadata to streamline debugging efforts.
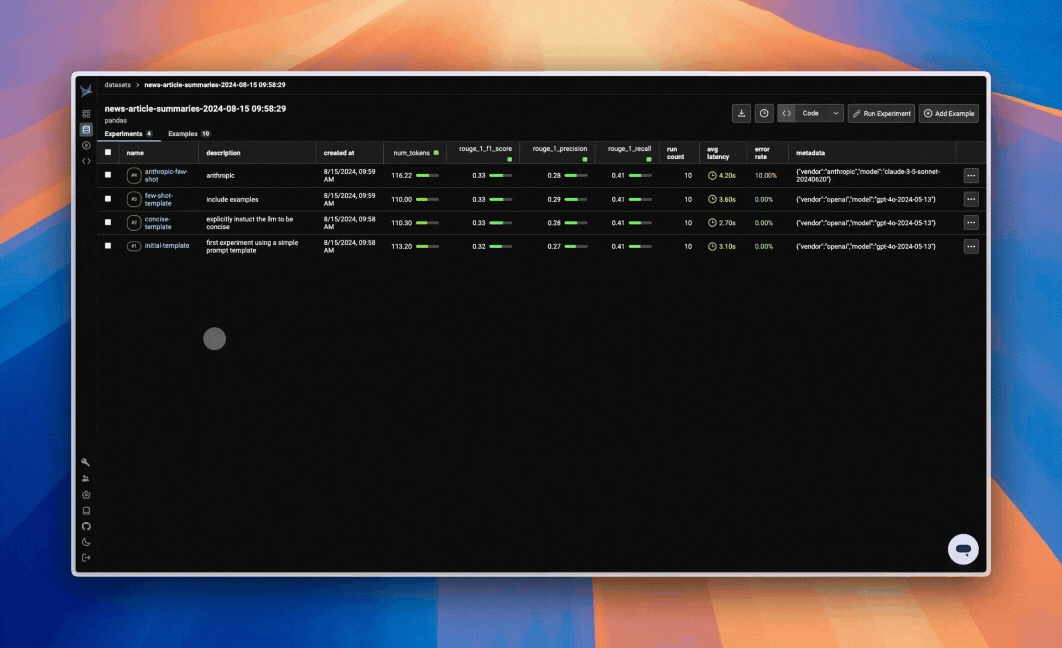
Leverage experiments to measure prompt and model performance. Typically during this early stage, you'll focus on gather a robust set of test cases and evaluation metrics to test initial iterations of your application. Experiments at this stage may resemble unit tests, as they're geared towards ensure your application performs correctly.
Either as a part of experiments or a standalone feature, evaluations help you understand how your app is performing at a granular level. Typical evaluations might be correctness evals compared against a ground truth data set, or LLM-as-a-judge evals to detect hallucinations or relevant RAG output.
Prompt engineering is critical how a model behaves. While there are other methods such as fine-tuning to change behavior, prompt engineering is the simplest way to get started and often times has the best ROI.
Instrument prompt and prompt variable collection to associate iterations of your app with the performance measured through evals and experiments. Phoenix tracks prompt templates, variables, and versions during execution to help you identify improvements and degradations.
Phoenix's search and retrieval optimization tools include an embeddings visualizer that helps teams understand how their data is being represented and clustered. This visual insight can guide decisions on indexing strategies, similarity measures, and data organization to improve the relevance and efficiency of search results.
In the testing and staging environment, Phoenix supports comprehensive evaluation, benchmarking, and data curation. Traces, experimentation, prompt tracking, and embedding visualizer remain important in the testing and staging phase, helping teams identify and resolve issues before deployment.
With a stable set of test cases and evaluations defined, you can now easily iterate on your application and view performance changes in Phoenix right away. Swap out models, prompts, or pipeline logic, and run your experiment to immediately see the impact on performance.
Phoenix's flexible evaluation framework supports thorough testing of LLM outputs. Teams can define custom metrics, collect user feedback, and leverage separate LLMs for automated assessment. Phoenix offers tools for analyzing evaluation results, identifying trends, and tracking improvements over time.
Phoenix assists in curating high-quality data for testing and fine-tuning. It provides tools for data exploration, cleaning, and labeling, enabling teams to curate representative data that covers a wide range of use cases and edge conditions.
Add guardrails to your application to prevent malicious and erroneous inputs and outputs. Guardrails will be visualized in Phoenix, and can be attached to spans and traces in the same fashion as evaluation metrics.
In production, Phoenix works hand-in-hand with Arize, which focuses on the production side of the LLM lifecycle. The integration ensures a smooth transition from development to production, with consistent tooling and metrics across both platforms.
Phoenix and Arize use the same collector frameworks in development and production. This allows teams to monitor latency, token usage, and other performance metrics, setting up alerts when thresholds are exceeded.
Phoenix's evaluation framework can be used to generate ongoing assessments of LLM performance in production. Arize complements this with online evaluations, enabling teams to set up alerts if evaluation metrics, such as hallucination rates, go beyond acceptable thresholds.
Phoenix and Arize together help teams identify data points for fine-tuning based on production performance and user feedback. This targeted approach ensures that fine-tuning efforts are directed towards the most impactful areas, maximizing the return on investment.
Phoenix, in collaboration with Arize, empowers teams to build, optimize, and maintain high-quality LLM applications throughout the entire lifecycle. By providing a comprehensive observability platform and seamless integration with production monitoring tools, Phoenix and Arize enable teams to deliver exceptional LLM-driven experiences with confidence and efficiency.
The Phoenix app can be run in various environments such as Colab and SageMaker notebooks, as well as be served via the terminal or a docker container.
If you're using Phoenix Cloud, be sure to set the proper environment variables to connect to your instance:
To start phoenix in a notebook environment, run:
This will start a local Phoenix server. You can initialize the phoenix server with various kinds of data (traces, inferences).
If you want to start a phoenix server to collect traces, you can also run phoenix directly from the command line:
This will start the phoenix server on port 6006. If you are running your instrumented notebook or application on the same machine, traces should automatically be exported to http://127.0.0.1:6006 so no additional configuration is needed. However if the server is running remotely, you will have to modify the environment variable PHOENIX_COLLECTOR_ENDPOINT to point to that machine (e.g. http://<my-remote-machine>:<port>)
Tracing the execution of LLM applications using Telemetry
Phoenix traces AI applications, via OpenTelemetry and has first-class integrations with LlamaIndex, Langchain, OpenAI, and others.
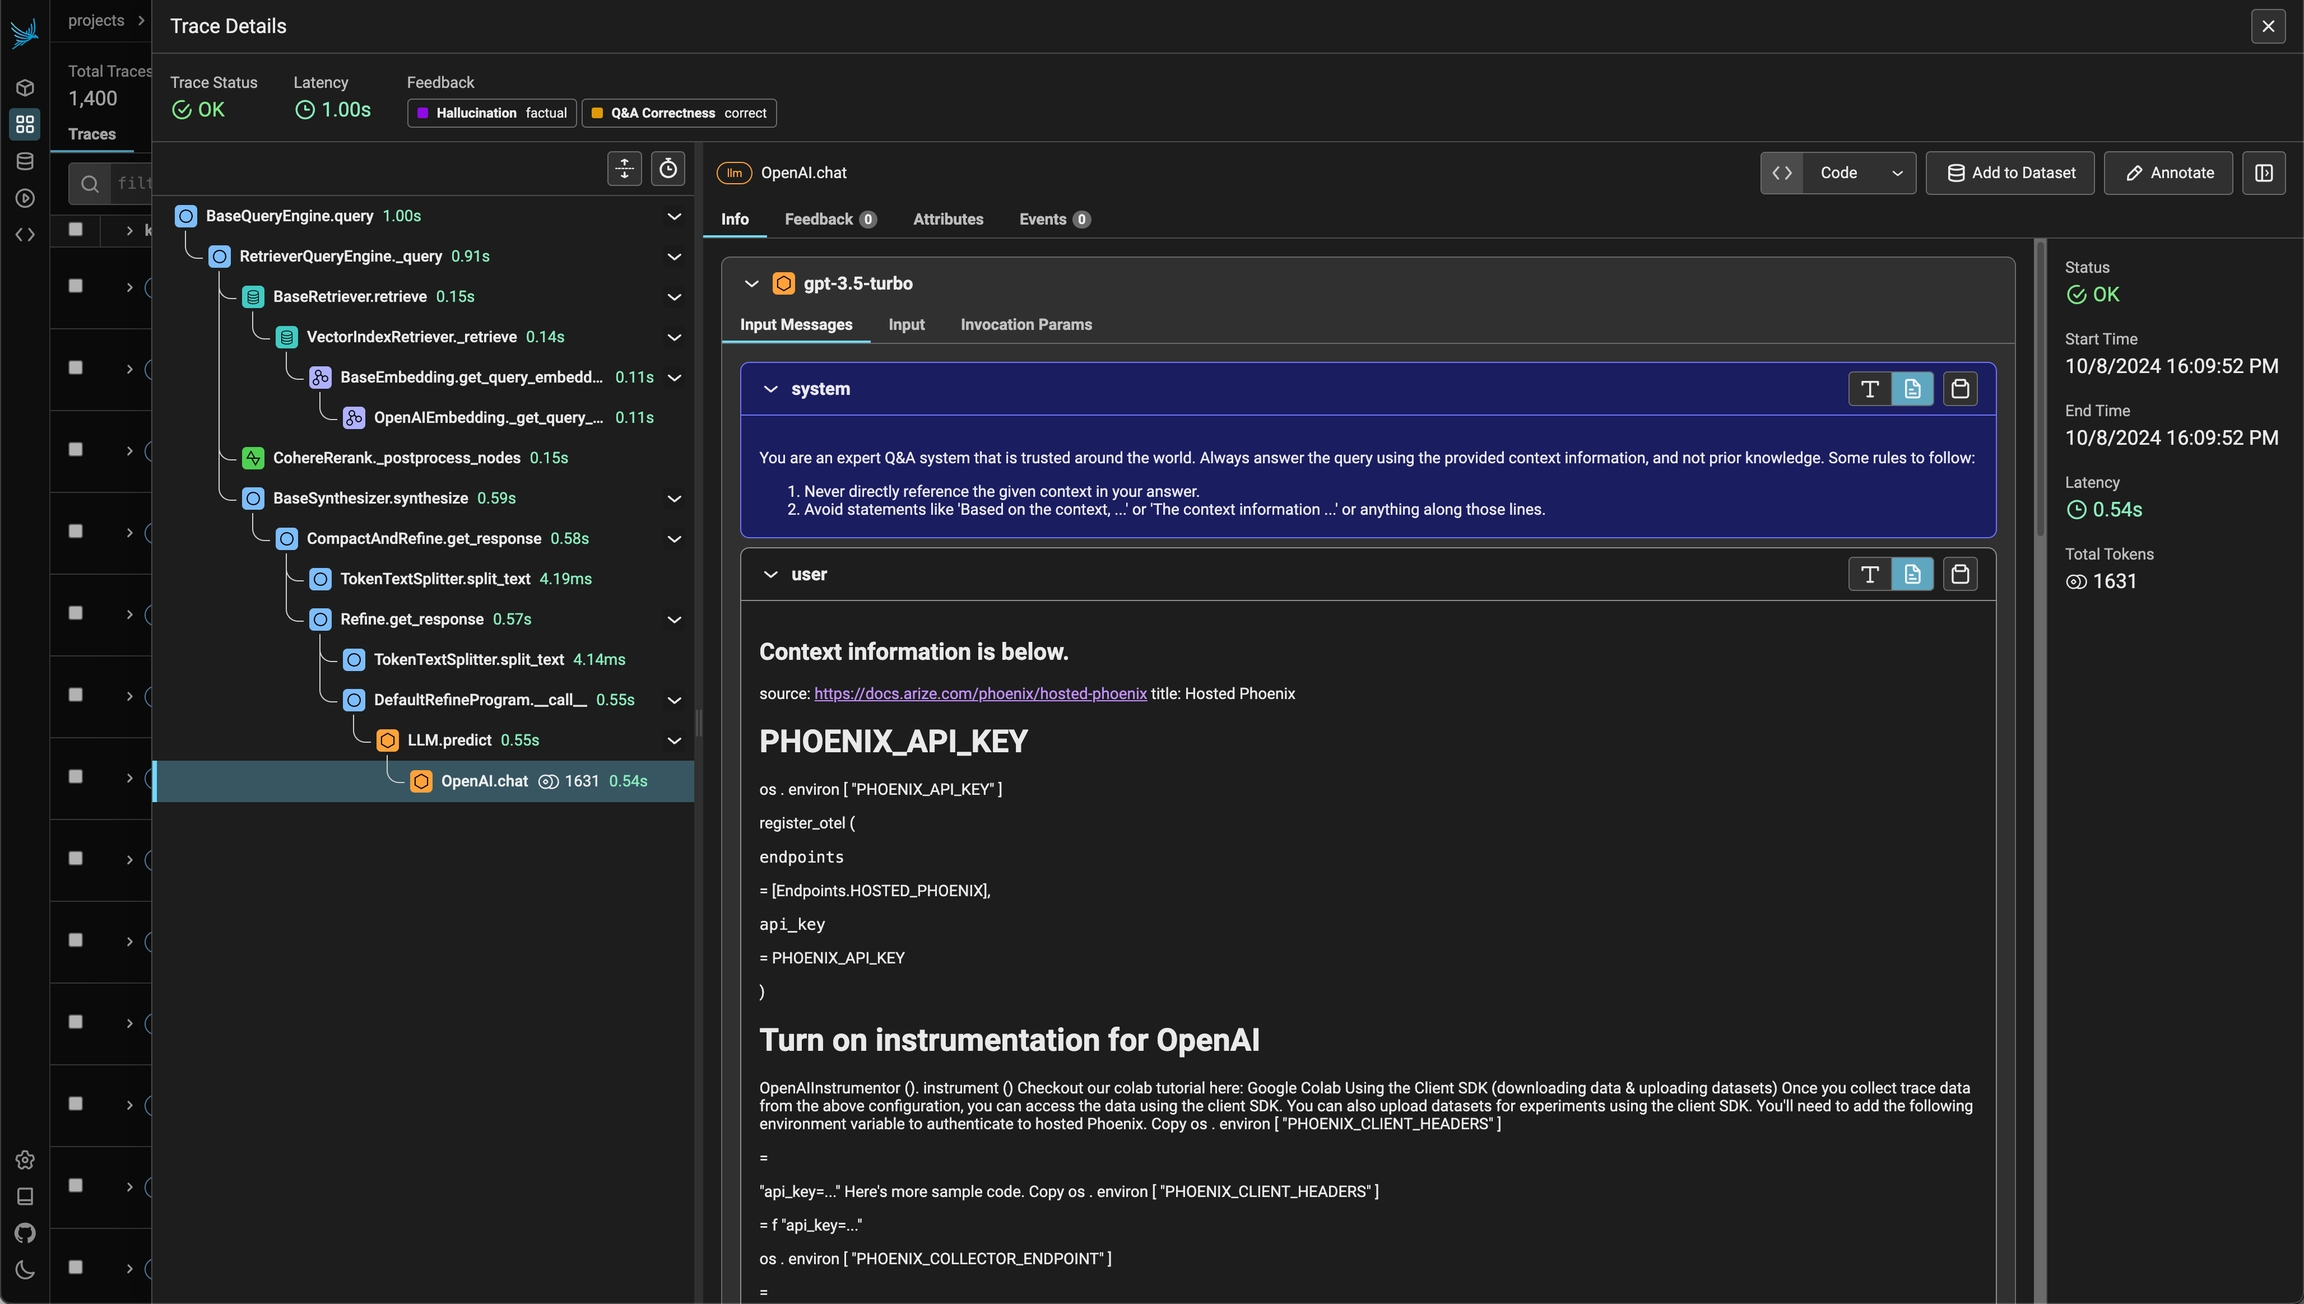
LLM tracing records the paths taken by requests as they propagate through multiple steps or components of an LLM application. For example, when a user interacts with an LLM application, tracing can capture the sequence of operations, such as document retrieval, embedding generation, language model invocation, and response generation to provide a detailed timeline of the request's execution.
Using Phoenix's tracing capabilities can provide important insights into the inner workings of your LLM application. By analyzing the collected trace data, you can identify and address various performance and operational issues and improve the overall reliability and efficiency of your system.
Application Latency: Identify and address slow invocations of LLMs, Retrievers, and other components within your application, enabling you to optimize performance and responsiveness.
Token Usage: Gain a detailed breakdown of token usage for your LLM calls, allowing you to identify and optimize the most expensive LLM invocations.
Runtime Exceptions: Capture and inspect critical runtime exceptions, such as rate-limiting events, that can help you proactively address and mitigate potential issues.
Retrieved Documents: Inspect the documents retrieved during a Retriever call, including the score and order in which they were returned to provide insight into the retrieval process.
Embeddings: Examine the embedding text used for retrieval and the underlying embedding model to allow you to validate and refine your embedding strategies.
LLM Parameters: Inspect the parameters used when calling an LLM, such as temperature and system prompts, to ensure optimal configuration and debugging.
Prompt Templates: Understand the prompt templates used during the prompting step and the variables that were applied, allowing you to fine-tune and improve your prompting strategies.
Tool Descriptions: View the descriptions and function signatures of the tools your LLM has been given access to in order to better understand and control your LLM’s capabilities.
LLM Function Calls: For LLMs with function call capabilities (e.g., OpenAI), you can inspect the function selection and function messages in the input to the LLM, further improving your ability to debug and optimize your application.
By using tracing in Phoenix, you can gain increased visibility into your LLM application, empowering you to identify and address performance bottlenecks, optimize resource utilization, and ensure the overall reliability and effectiveness of your system.
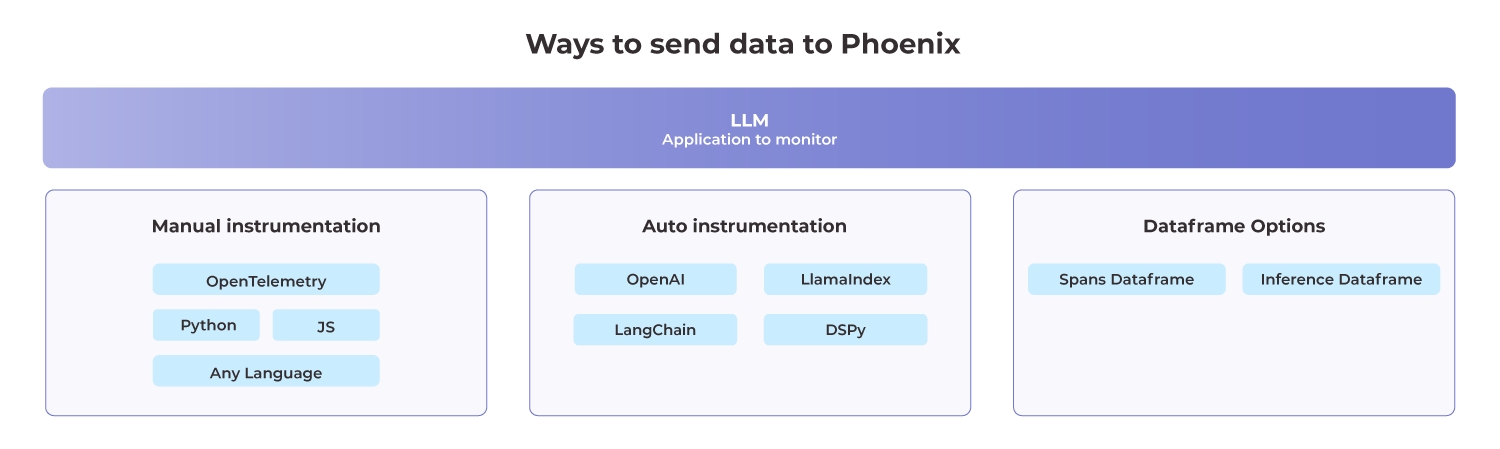
Phoenix supports three main options to collect traces:
This example uses options 1 and 2.
To collect traces from your application, you must configure an OpenTelemetry TracerProvider to send traces to Phoenix.
Functions can be traced using decorators:
Input and output attributes are set automatically based on my_func's parameters and return.
OpenInference libraries must be installed before calling the register function
You should now see traces in Phoenix!
Phoenix supports three main options to collect traces:
This example uses options 2 and 3.
Grab your API key from the Keys option on the left bar.
In your code, configure environment variables for your endpoint and API key:
In your code, configure environment variables for your endpoint and API key:
To collect traces from your application, you must configure an OpenTelemetry TracerProvider to send traces to Phoenix.
In a new file called instrumentation.ts (or .js if applicable)
Remember to add your environment variables to your shell environment before running this sample! Uncomment one of the authorization headers above if you plan to connect to an authenticated Phoenix instance.
Now, import this file at the top of your main program entrypoint, or invoke it with the node cli's requireflag:
Our program is now ready to trace calls made by an llm library, but it will not do anything just yet. Let's choose an instrumentation library to collect our traces, and register it with our Provider.
Update your instrumentation.tsfile, registering the instrumentation. Steps will vary depending on if your project is configured for CommonJS or ESM style module resolution.
Finally, in your app code, invoke OpenAI:
You should now see traces in Phoenix!
Tracing is a critical part of AI Observability and should be used both in production and development
Phoenix's tracing and span analysis capabilities are invaluable during the prototyping and debugging stages. By instrumenting application code with Phoenix, teams gain detailed insights into the execution flow, making it easier to identify and resolve issues. Developers can drill down into specific spans, analyze performance metrics, and access relevant logs and metadata to streamline debugging efforts.
This section contains details on Tracing features:
Use projects to organize your LLM traces
Projects provide organizational structure for your AI applications, allowing you to logically separate your observability data. This separation is essential for maintaining clarity and focus.
With Projects, you can:
Segregate traces by environment (development, staging, production)
Isolate different applications or use cases
Track separate experiments without cross-contamination
Maintain dedicated evaluation spaces for specific initiatives
Create team-specific workspaces for collaborative analysis
Projects act as containers that keep related traces and conversations together while preventing them from interfering with unrelated work. This organization becomes increasingly valuable as you scale - allowing you to easily switch between contexts without losing your place or mixing data.
The Project structure also enables comparative analysis across different implementations, models, or time periods. You can run parallel versions of your application in separate projects, then analyze the differences to identify improvements or regressions.
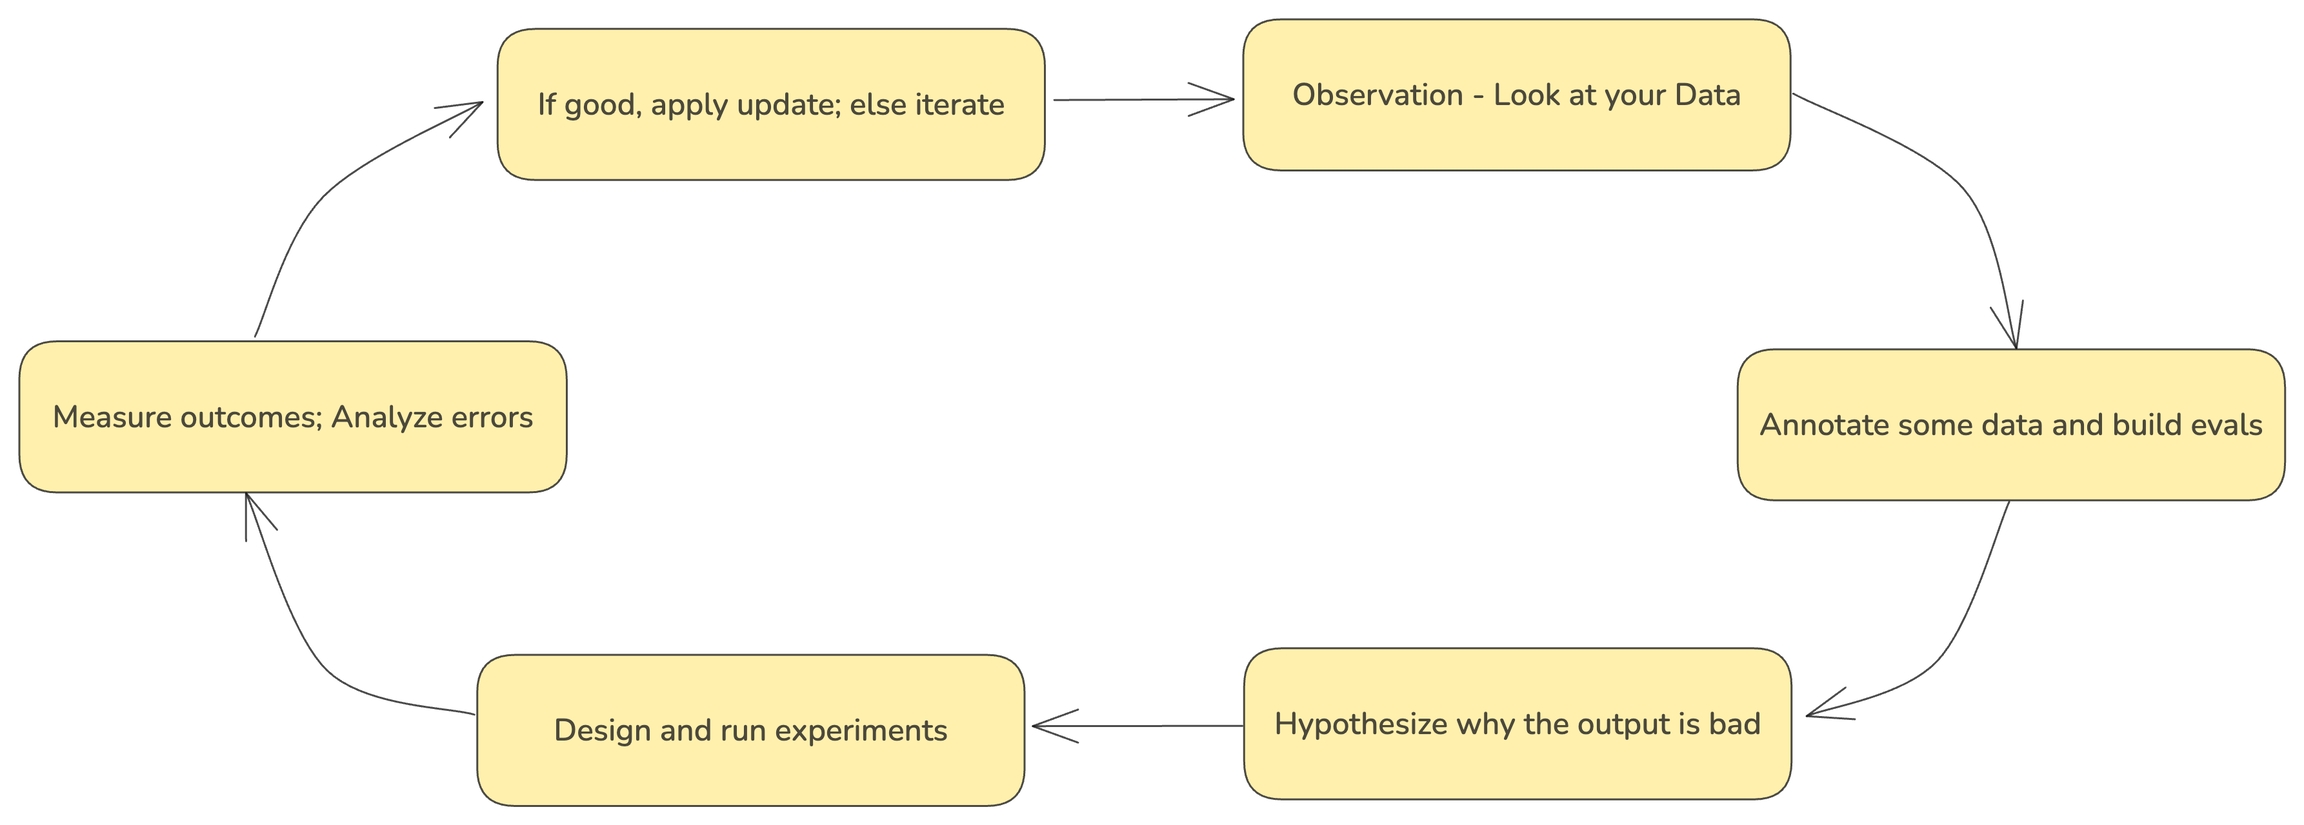
In order to improve your LLM application iteratively, it's vital to collect feedback, annotate data during human review, as well as to establish an evaluation pipeline so that you can monitor your application. In Phoenix we capture this type of feedback in the form of annotations.
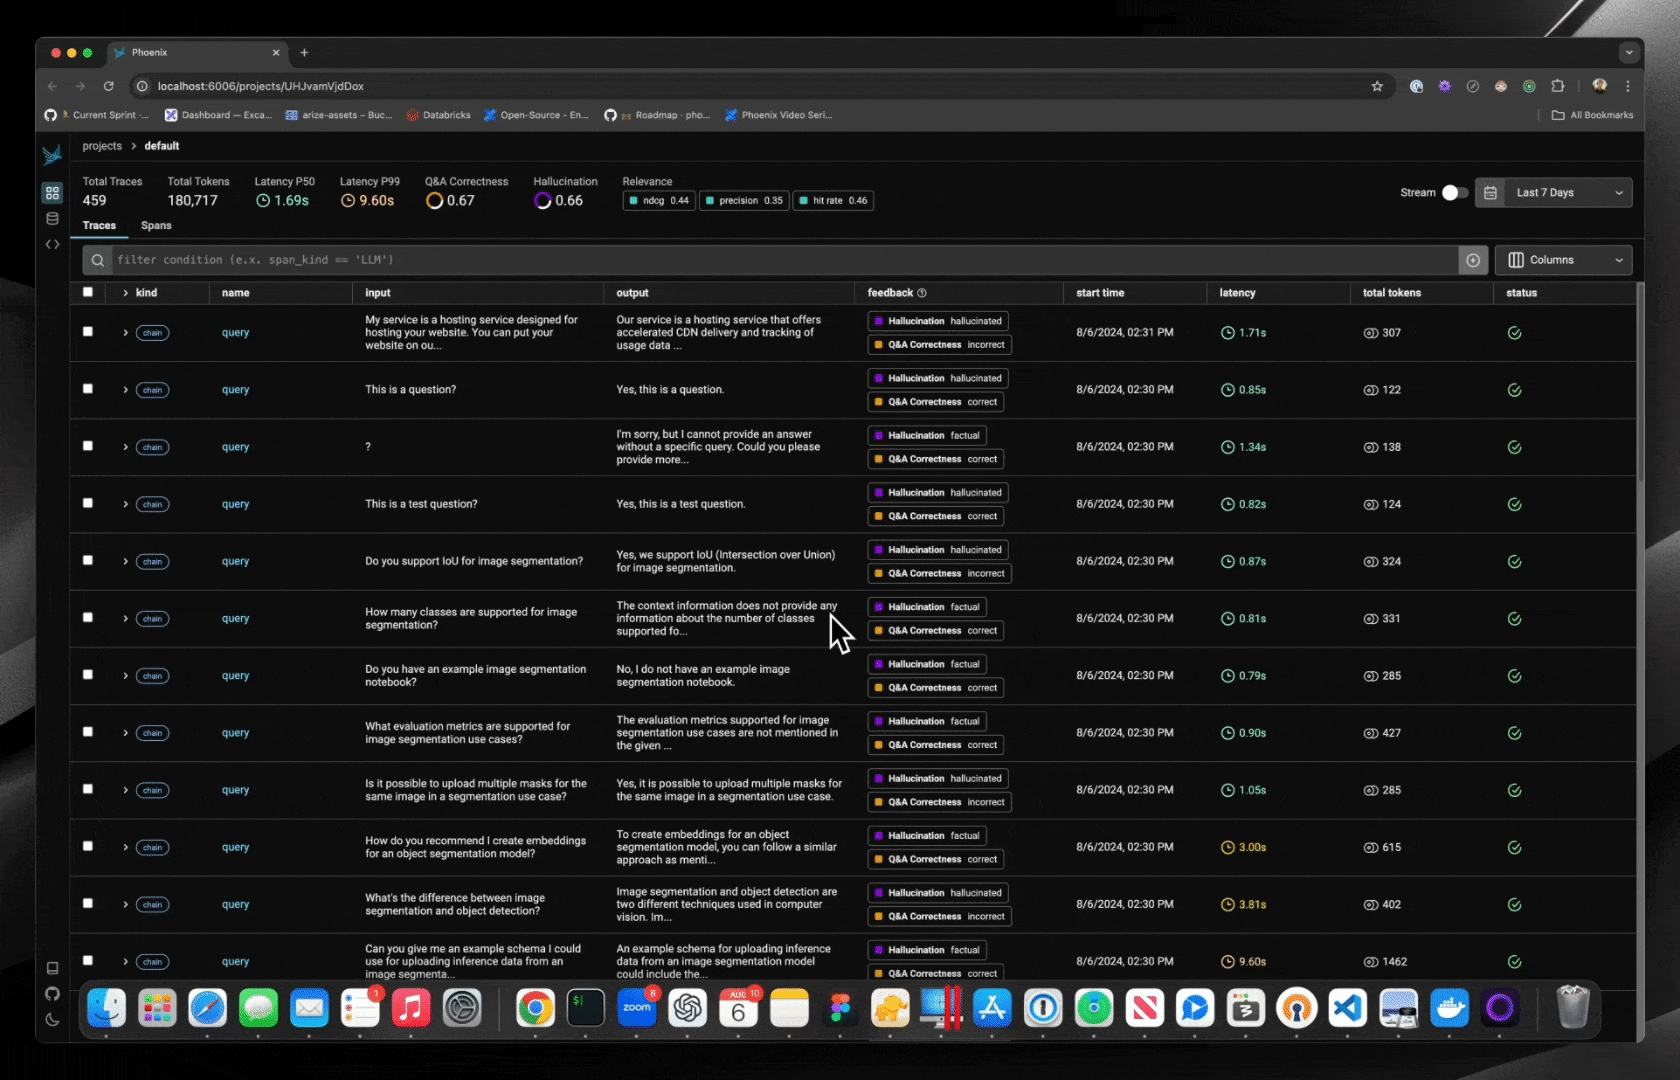
Phoenix gives you the ability to annotate traces with feedback from the UI, your application, or wherever you would like to perform evaluation. Phoenix's annotation model is simple yet powerful - given an entity such as a span that is collected, you can assign a label and/or a score to that entity.
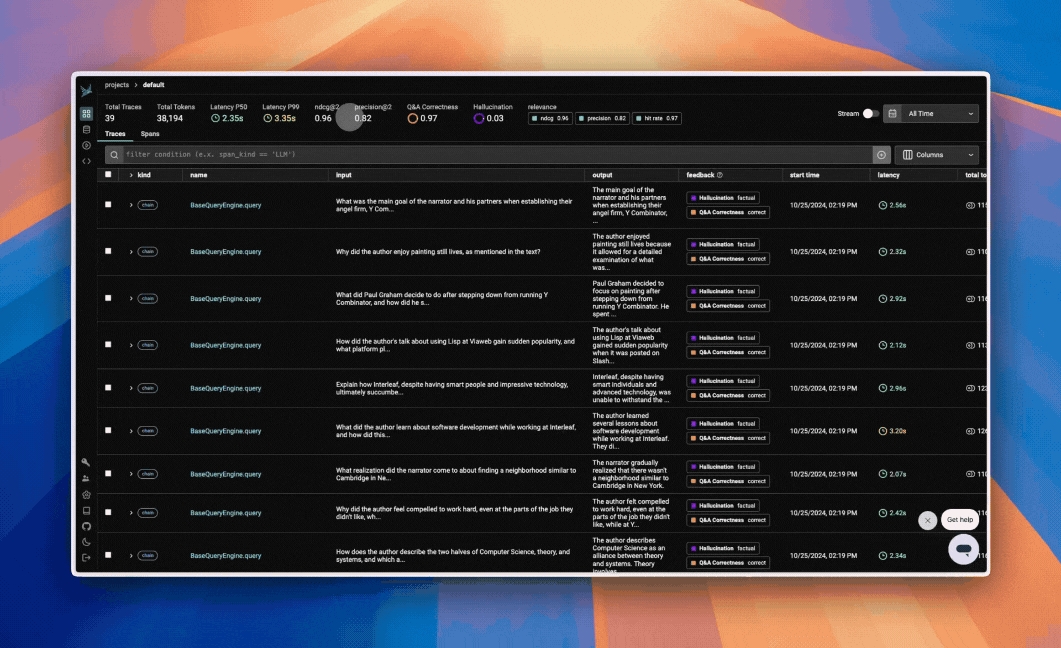
Navigate to the Feedback tab in this demo trace to see how LLM-based evaluations appear in Phoenix:
Learn more about the concepts Concepts: Annotations
Configure Annotation Configs to guide human annotations.
How to run Running Evals on Traces
Learn how to log annotations via the client from your app or in a notebook
Track and analyze multi-turn conversations
Sessions enable tracking and organizing related traces across multi-turn conversations with your AI application. When building conversational AI, maintaining context between interactions is critical - Sessions make this possible from an observability perspective.
With Sessions in Phoenix, you can:
Track the entire history of a conversation in a single thread
View conversations in a chatbot-like UI showing inputs and outputs of each turn
Search through sessions to find specific interactions
Track token usage and latency per conversation
This feature is particularly valuable for applications where context builds over time, like chatbots, virtual assistants, or any other multi-turn interaction. By tagging spans with a consistent session ID, you create a connected view that reveals how your application performs across an entire user journey.
Check out how to Setup Sessions
Guides on how to use traces
How to set custom attributes and semantic attributes to child spans and spans created by auto-instrumentors.
Create and customize spans for your use-case
How to query spans for to construct DataFrames to use for evaluation
How to log evaluation results to annotate traces with evals
Learn how to use the phoenix.otel library
Learn how you can use basic OpenTelemetry to instrument your application.
Learn how to use Phoenix's decorators to easily instrument specific methods or code blocks in your application.
Setup tracing for your TypeScript application.
Learn about Projects in Phoenix, and how to use them.
Understand Sessions and how they can be used to group user conversations.
phoenix.otel is a lightweight wrapper around OpenTelemetry primitives with Phoenix-aware defaults.
These defaults are aware of environment variables you may have set to configure Phoenix:
PHOENIX_COLLECTOR_ENDPOINT
PHOENIX_PROJECT_NAME
PHOENIX_CLIENT_HEADERS
PHOENIX_API_KEY
PHOENIX_GRPC_PORT
phoenix.otel.registerThe phoenix.otel module provides a high-level register function to configure OpenTelemetry tracing by setting a global TracerProvider. The register function can also configure headers and whether or not to process spans one by one or by batch.
If the PHOENIX_API_KEY environment variable is set, register will automatically add an authorization header to each span payload.
There are two ways to configure the collector endpoint:
Using environment variables
Using the endpoint keyword argument
If you're setting the PHOENIX_COLLECTOR_ENDPOINT environment variable, register will
automatically try to send spans to your Phoenix server using gRPC.
endpoint directlyWhen passing in the endpoint argument, you must specify the fully qualified endpoint. If the PHOENIX_GRPC_PORT environment variable is set, it will override the default gRPC port.
The HTTP transport protocol is inferred from the endpoint
The GRPC transport protocol is inferred from the endpoint
Additionally, the protocol argument can be used to enforce the OTLP transport protocol regardless of the endpoint. This might be useful in cases such as when the GRPC endpoint is bound to a different port than the default (4317). The valid protocols are: "http/protobuf", and "grpc".
register can be configured with different keyword arguments:
project_name: The Phoenix project name
or use PHOENIX_PROJECT_NAME env. var
headers: Headers to send along with each span payload
or use PHOENIX_CLIENT_HEADERS env. var
batch: Whether or not to process spans in batch
Once you've connected your application to your Phoenix instance using phoenix.otel.register, you need to instrument your application. You have a few options to do this:
Using OpenInference auto-instrumentors. If you've used the auto_instrument flag above, then any instrumentor packages in your environment will be called automatically. For a full list of OpenInference packages, see https://arize.com/docs/phoenix/integrations
While the spans created via Phoenix and OpenInference create a solid foundation for tracing your application, sometimes you need to create and customize your LLM spans
Phoenix and OpenInference use the OpenTelemetry Trace API to create spans. Because Phoenix supports OpenTelemetry, this means that you can perform manual instrumentation, no LLM framework required! This guide will help you understand how to create and customize spans using the OpenTelemetry Trace API.
First, ensure you have the API and SDK packages:
For full documentation on the OpenInference semantic conventions, please consult the specification
Configuring an OTel tracer involves some boilerplate code that the instrumentors in phoenix.trace take care of for you. If you're manually instrumenting your application, you'll need to implement this boilerplate yourself:
This snippet contains a few OTel concepts:
A resource represents an origin (e.g., a particular service, or in this case, a project) from which your spans are emitted.
Span processors filter, batch, and perform operations on your spans prior to export.
Your tracer provides a handle for you to create spans and add attributes in your application code.
The collector (e.g., Phoenix) receives the spans exported by your application.
To create a span, you'll typically want it to be started as the current span.
You can also use start_span to create a span without making it the current span. This is usually done to track concurrent or asynchronous operations.
If you have a distinct sub-operation you'd like to track as a part of another one, you can create span to represent the relationship:
When you view spans in a trace visualization tool, child will be tracked as a nested span under parent.
It's common to have a single span track the execution of an entire function. In that scenario, there is a decorator you can use to reduce code:
Use of the decorator is equivalent to creating the span inside do_work() and ending it when do_work() is finished.
To use the decorator, you must have a tracer instance in scope for your function declaration.
Sometimes it's helpful to access whatever the current span is at a point in time so that you can enrich it with more information.
Attributes let you attach key/value pairs to a spans so it carries more information about the current operation that it's tracking.
Notice above that the attributes have a specific prefix operation. When adding custom attributes, it's best practice to vendor your attributes (e.x. mycompany.) so that your attributes do not clash with semantic conventions.
To use OpenInference Semantic Attributes in Python, ensure you have the semantic conventions package:
Then you can use it in code:
Events are human-readable messages that represent "something happening" at a particular moment during the lifetime of a span. You can think of it as a primitive log.
The span status allows you to signal the success or failure of the code executed within the span.
It can be a good idea to record exceptions when they happen. It’s recommended to do this in conjunction with setting span status.
As part of the OpenInference library, Phoenix provides helpful abstractions to make manual instrumentation easier.
This documentation provides a guide on using OpenInference OTEL tracing decorators and methods for instrumenting functions, chains, agents, and tools using OpenTelemetry.
These tools can be combined with, or used in place of, OpenTelemetry instrumentation code. They are designed to simplify the instrumentation process.
If you'd prefer to use pure OTEL instead, see Setup using base OTEL
Ensure you have OpenInference and OpenTelemetry installed:
You can configure the tracer using either TracerProvider from openinference.instrumentation or using phoenix.otel.register.
Your tracer object can now be used in two primary ways:
This entire function will appear as a Span in Phoenix. Input and output attributes in Phoenix will be set automatically based on my_func's parameters and return. The status attribute will also be set automatically.
The code within this clause will be captured as a Span in Phoenix. Here the input, output, and status must be set manually.
This approach is useful when you need only a portion of a method to be captured as a Span.
OpenInference Span Kinds denote the possible types of spans you might capture, and will be rendered different in the Phoenix UI.
The possible values are:\
CHAIN
General logic operations, functions, or code blocks
LLM
Making LLM calls
TOOL
Completing tool calls
RETRIEVER
Retrieving documents
EMBEDDING
Generating embeddings
AGENT
Agent invokations - typically a top level or near top level span
RERANKER
Reranking retrieved context
UNKNOWN
Unknown
GUARDRAIL
Guardrail checks
EVALUATOR
Evaluators - typically only use by Phoenix when automatically tracing evaluation and experiment calls
Like other span kinds, LLM spans can be instrumented either via a context manager or via a decorator pattern. It's also possible to directly patch client methods.
While this guide uses the OpenAI Python client for illustration, in practice, you should use the OpenInference auto-instrumentors for OpenAI whenever possible and resort to manual instrumentation for LLM spans only as a last resort.
To run the snippets in this section, set your OPENAI_API_KEY environment variable.
This decorator pattern above works for sync functions, async coroutine functions, sync generator functions, and async generator functions. Here's an example with an async generator.
It's also possible to directly patch methods on a client. This is useful if you want to transparently use the client in your application with instrumentation logic localized in one place.
The snippets above produce LLM spans with input and output values, but don't offer rich UI for messages, tools, invocation parameters, etc. In order to manually instrument LLM spans with these features, users can define their own functions to wrangle the input and output of their LLM calls into OpenInference format. The openinference-instrumentation library contains helper functions that produce valid OpenInference attributes for LLM spans:
get_llm_attributes
get_input_attributes
get_output_attributes
For OpenAI, these functions might look like this:
When using a context manager to create LLM spans, these functions can be used to wrangle inputs and outputs.
When using the tracer.llm decorator, these functions are passed via the process_input and process_output parameters and should satisfy the following:
The input signature of process_input should exactly match the input signature of the decorated function.
The input signature of process_output has a single argument, the output of the decorated function. This argument accepts the returned value when the decorated function is a sync or async function, or a list of yielded values when the decorated function is a sync or async generator function.
Both process_input and process_output should output a dictionary mapping attribute names to values.
When decorating a generator function, process_output should accept a single argument, a list of the values yielded by the decorated function.
Then the decoration is the same as before.
As before, it's possible to directly patch the method on the client. Just ensure that the input signatures of process_input and the patched method match.
OpenInference includes message types that can be useful in composing text and image or other file inputs and outputs:
Instrumentation is the act of adding observability code to an app yourself.
If you’re instrumenting an app, you need to use the OpenTelemetry SDK for your language. You’ll then use the SDK to initialize OpenTelemetry and the API to instrument your code. This will emit telemetry from your app, and any library you installed that also comes with instrumentation.
Now lets walk through instrumenting, and then tracing, a sample express application.
Install OpenTelemetry API packages:
Install OpenInference instrumentation packages. Below is an example of adding instrumentation for OpenAI as well as the semantic conventions for OpenInference.
If a TracerProvider is not created, the OpenTelemetry APIs for tracing will use a no-op implementation and fail to generate data. As explained next, create an instrumentation.ts (or instrumentation.js) file to include all of the provider initialization code in Node.
Node.js
Create instrumentation.ts (or instrumentation.js) to contain all the provider initialization code:
This basic setup has will instrument chat completions via native calls to the OpenAI client.
Picking the right span processor
In our instrumentation.ts file above, we use the BatchSpanProcessor. The BatchSpanProcessor processes spans in batches before they are exported. This is usually the right processor to use for an application.
In contrast, the SimpleSpanProcessor processes spans as they are created. This means that if you create 5 spans, each will be processed and exported before the next span is created in code. This can be helpful in scenarios where you do not want to risk losing a batch, or if you’re experimenting with OpenTelemetry in development. However, it also comes with potentially significant overhead, especially if spans are being exported over a network - each time a call to create a span is made, it would be processed and sent over a network before your app’s execution could continue.
In most cases, stick with BatchSpanProcessor over SimpleSpanProcessor.
Tracing instrumented libraries
Now that you have configured a tracer provider, and instrumented the openai package, lets see how we can generate traces for a sample application.
First, install the dependencies required for our sample app.
Next, create an app.ts (or app.js ) file, that hosts a simple express server for executing OpenAI chat completions.
Then, we will start our application, loading the instrumentation.ts file before app.ts so that our instrumentation code can instrument openai .
Finally, we can execute a request against our server
After a few moments, a new project openai-service will appear in the Phoenix UI, along with the trace generated by our OpenAI chat completion!
Anywhere in your application where you write manual tracing code should call getTracer to acquire a tracer. For example:
It’s generally recommended to call getTracer in your app when you need it rather than exporting the tracer instance to the rest of your app. This helps avoid trickier application load issues when other required dependencies are involved.
Below is an example of acquiring a tracer within application scope.
The API of OpenTelemetry JavaScript exposes two methods that allow you to create spans:
In most cases you want to use the latter (tracer.startActiveSpan), as it takes care of setting the span and its context active.
The code below illustrates how to create an active span.
The above instrumented code can now be pasted in the /chat handler. You should now be able to see spans emitted from your app.
Start your app as follows, and then send it requests by visiting http://localhost:8080/chat?message="how long is a pencil" with your browser or curl.
After a while, you should see the spans printed in the console by the ConsoleSpanExporter, something like this:
You can also add attributes to a span as it’s created:
Semantic Attributes
First add both semantic conventions as a dependency to your application:
Add the following to the top of your application file:
Finally, you can update your file to include semantic attributes:
While Phoenix captures these, they are currently not displayed in the UI. Contact us if you would like to support!
The status can be set at any time before the span is finished.
sdk-trace-base and manually propagating span contextIn some cases, you may not be able to use either the Node.js SDK nor the Web SDK. The biggest difference, aside from initialization code, is that you’ll have to manually set spans as active in the current context to be able to create nested spans.
Initializing tracing with sdk-trace-base
Initializing tracing is similar to how you’d do it with Node.js or the Web SDK.
Like the other examples in this document, this exports a tracer you can use throughout the app.
Creating nested spans with sdk-trace-base
To create nested spans, you need to set whatever the currently-created span is as the active span in the current context. Don’t bother using startActiveSpan because it won’t do this for you.
All other APIs behave the same when you use sdk-trace-base compared with the Node.js SDKs.
Phoenix uses projects to group traces. If left unspecified, all traces are sent to a default project.
In the notebook, you can set the PHOENIX_PROJECT_NAME environment variable before adding instrumentation or running any of your code.
In python this would look like:
Note that setting a project via an environment variable only works in a notebook and must be done BEFORE instrumentation is initialized. If you are using OpenInference Instrumentation, see the Server tab for how to set the project name in the Resource attributes.
Alternatively, you can set the project name in your register function call:
If you are using Phoenix as a collector and running your application separately, you can set the project name in the Resource attributes for the trace provider.
Projects work by setting something called the Resource attributes (as seen in the OTEL example above). The phoenix server uses the project name attribute to group traces into the appropriate project.
Typically you want traces for an LLM app to all be grouped in one project. However, while working with Phoenix inside a notebook, we provide a utility to temporarily associate spans with different projects. You can use this to trace things like evaluations.
How to track sessions across multiple traces
Sessions UI is available in Phoenix 7.0 and requires a db migration if you're coming from an older version of Phoenix.
A Session is a sequence of traces representing a single session (e.g. a session or a thread). Each response is represented as its own trace, but these traces are linked together by being part of the same session.
To associate traces together, you need to pass in a special metadata key where the value is the unique identifier for that thread.
OpenAI tracing with Sessions
Python
LlamaIndex tracing with Sessions
Python
OpenAI tracing with Sessions
TS/JS
Below is an example of logging conversations:
First make sure you have the required dependancies installed
Below is an example of how to use openinference.instrumentation to the traces created.
The easiest way to add sessions to your application is to install @arizeai/openinfernce-core
You now can use either the session.id semantic attribute or the setSession utility function from openinference-core to associate traces with a particular session:
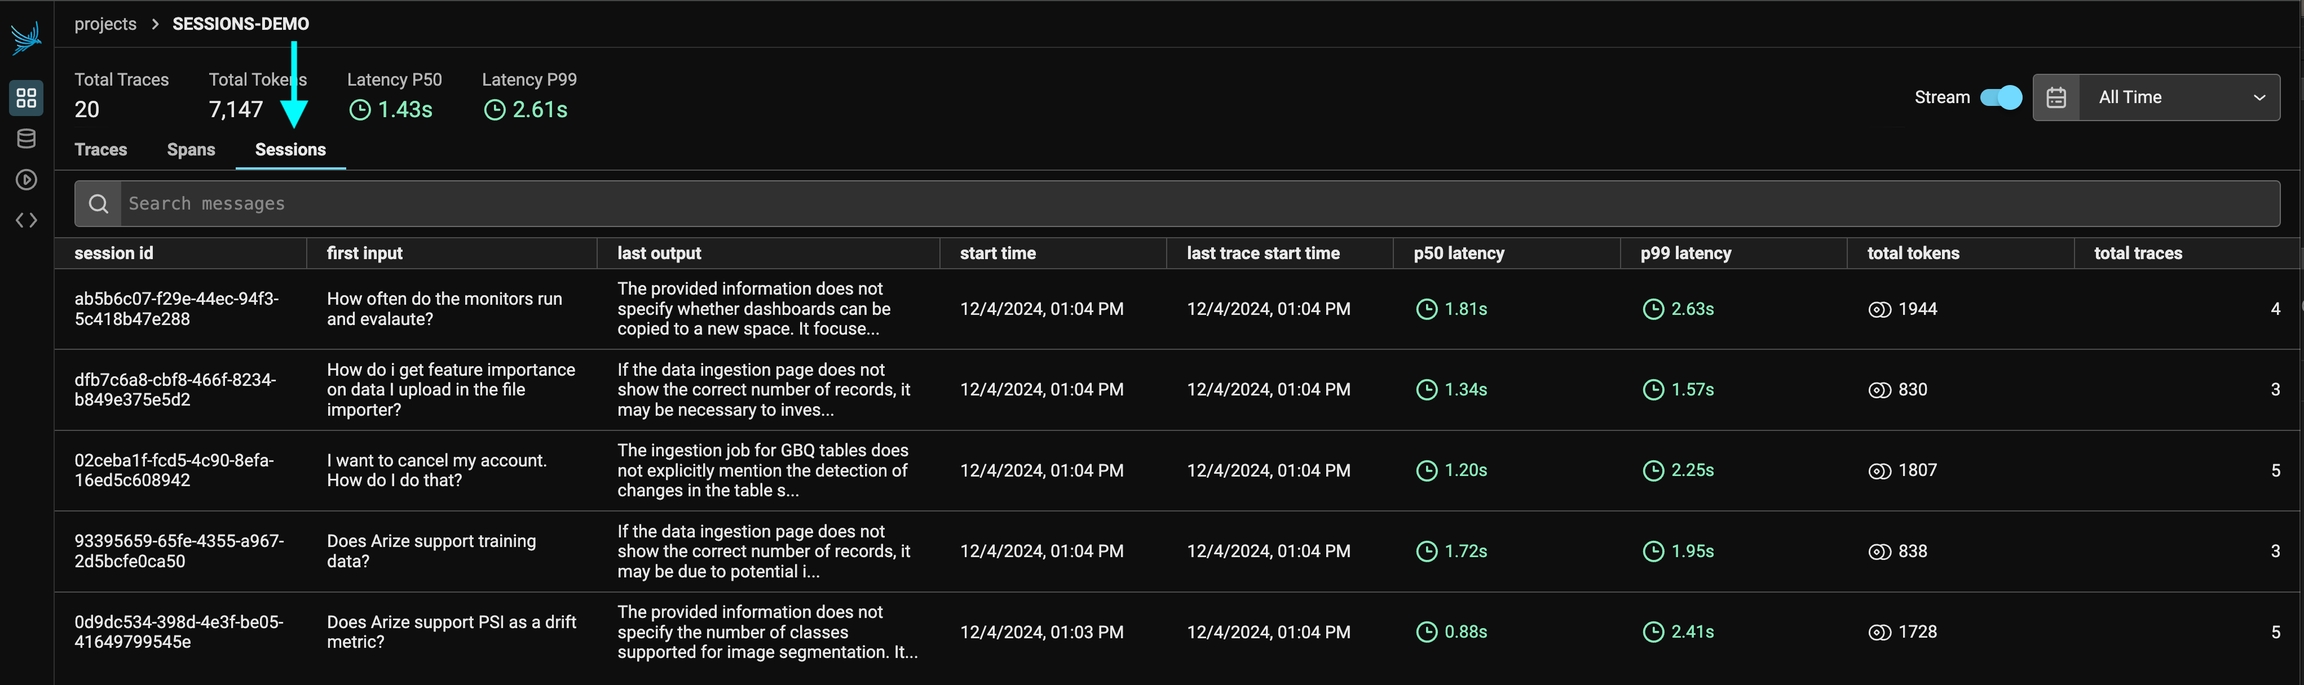
You can view the sessions for a given project by clicking on the "Sessions" tab in the project. You will see a list of all the recent sessions as well as some analytics. You can search the content of the messages to narrow down the list.
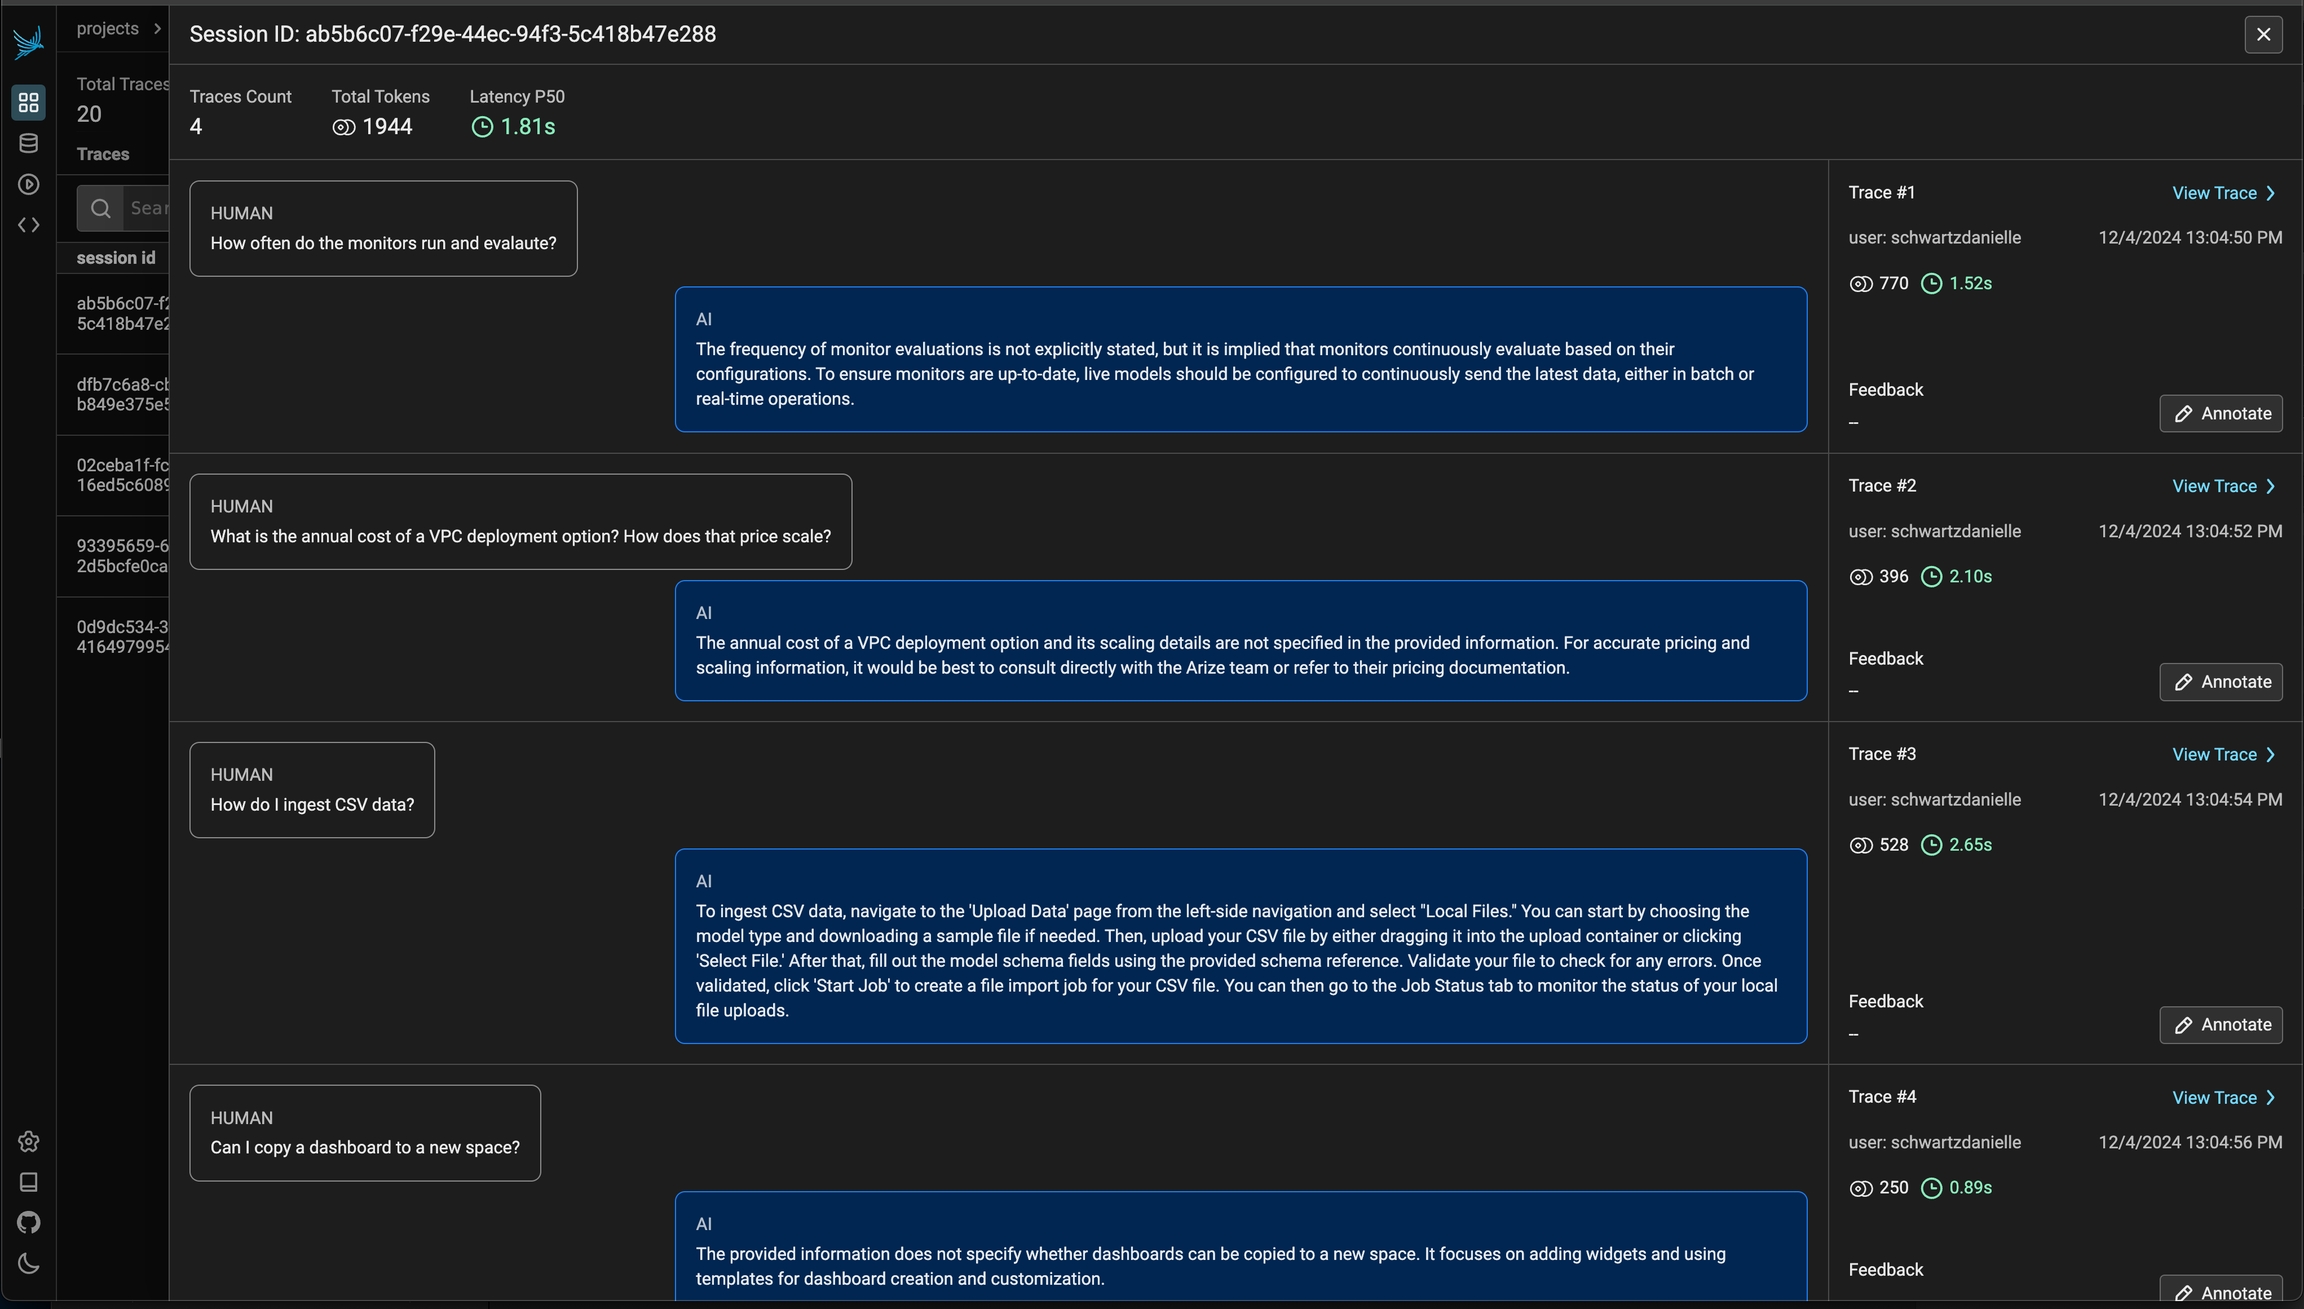
You can then click into a given session. This will open the history of a particular session. If the sessions contain input / output, you will see a chatbot-like UI where you can see the a history of inputs and outputs.
For LangChain, in order to log runs as part of the same thread you need to pass a special metadata key to the run. The key value is the unique identifier for that conversation. The key name should be one of:
session_id
thread_id
conversation_id.
Tracing can be augmented and customized by adding Metadata. Metadata includes your own custom attributes, user ids, session ids, prompt templates, and more.
Add Attributes, Metadata, Users
Learn how to add custom metadata and attributes to your traces
Instrument Prompt Templates and Prompt Variables
Learn how to define custom prompt templates and variables in your tracing.
Supported Context Attributes include:
Session ID* Unique identifier for a session
User ID* Unique identifier for a user.
Metadata Metadata associated with a span.
Tags* List of tags to give the span a category.
Prompt Template
Template Used to generate prompts as Python f-strings.
Version The version of the prompt template.
Variables key-value pairs applied to the prompt template.
Install the core instrumentation package:
It can also be used as a decorator:
It can also be used as a decorator:
It can also be used as a decorator:
It can also be used as a decorator:
The previous example is equivalent to doing the following, making using_attributes a very convenient tool for the more complex settings.
It can also be used as a decorator:
You can also use multiple setters at the same time to propagate multiple attributes to the span below. Since each setter function returns a new context, they can be used together as follows.
The tutorials and code snippets in these docs default to the SimpleSpanProcessor. A SimpleSpanProcessor processes and exports spans as they are created. This means that if you create 5 spans, each will be processed and exported before the next span is created in code. This can be helpful in scenarios where you do not want to risk losing a batch, or if you’re experimenting with OpenTelemetry in development. However, it also comes with potentially significant overhead, especially if spans are being exported over a network - each time a call to create a span is made, it would be processed and sent over a network before your app’s execution could continue.
The BatchSpanProcessor processes spans in batches before they are exported. This is usually the right processor to use for an application in production but it does mean spans may take some time to show up in Phoenix.
In production we recommend the BatchSpanProcessor over SimpleSpanProcessor
when deployed and the SimpleSpanProcessor when developing.
Annotating traces is a crucial aspect of evaluating and improving your LLM-based applications. By systematically recording qualitative or quantitative feedback on specific interactions or entire conversation flows, you can:
Track performance over time
Identify areas for improvement
Compare different model versions or prompts
Gather data for fine-tuning or retraining
Provide stakeholders with concrete metrics on system effectiveness
Phoenix allows you to annotate traces through the Client, the REST API, or the UI.
To learn how to configure annotations and to annotate through the UI, see Annotating in the UI
To learn how to add human labels to your traces, either manually or programmatically, see Annotating via the Client
To learn how to evaluate traces captured in Phoenix, see Running Evals on Traces
To learn how to upload your own evaluation labels into Phoenix, see Log Evaluation Results
For more background on the concept of annotations, see Annotations
How to annotate traces in the UI for analysis and dataset curation
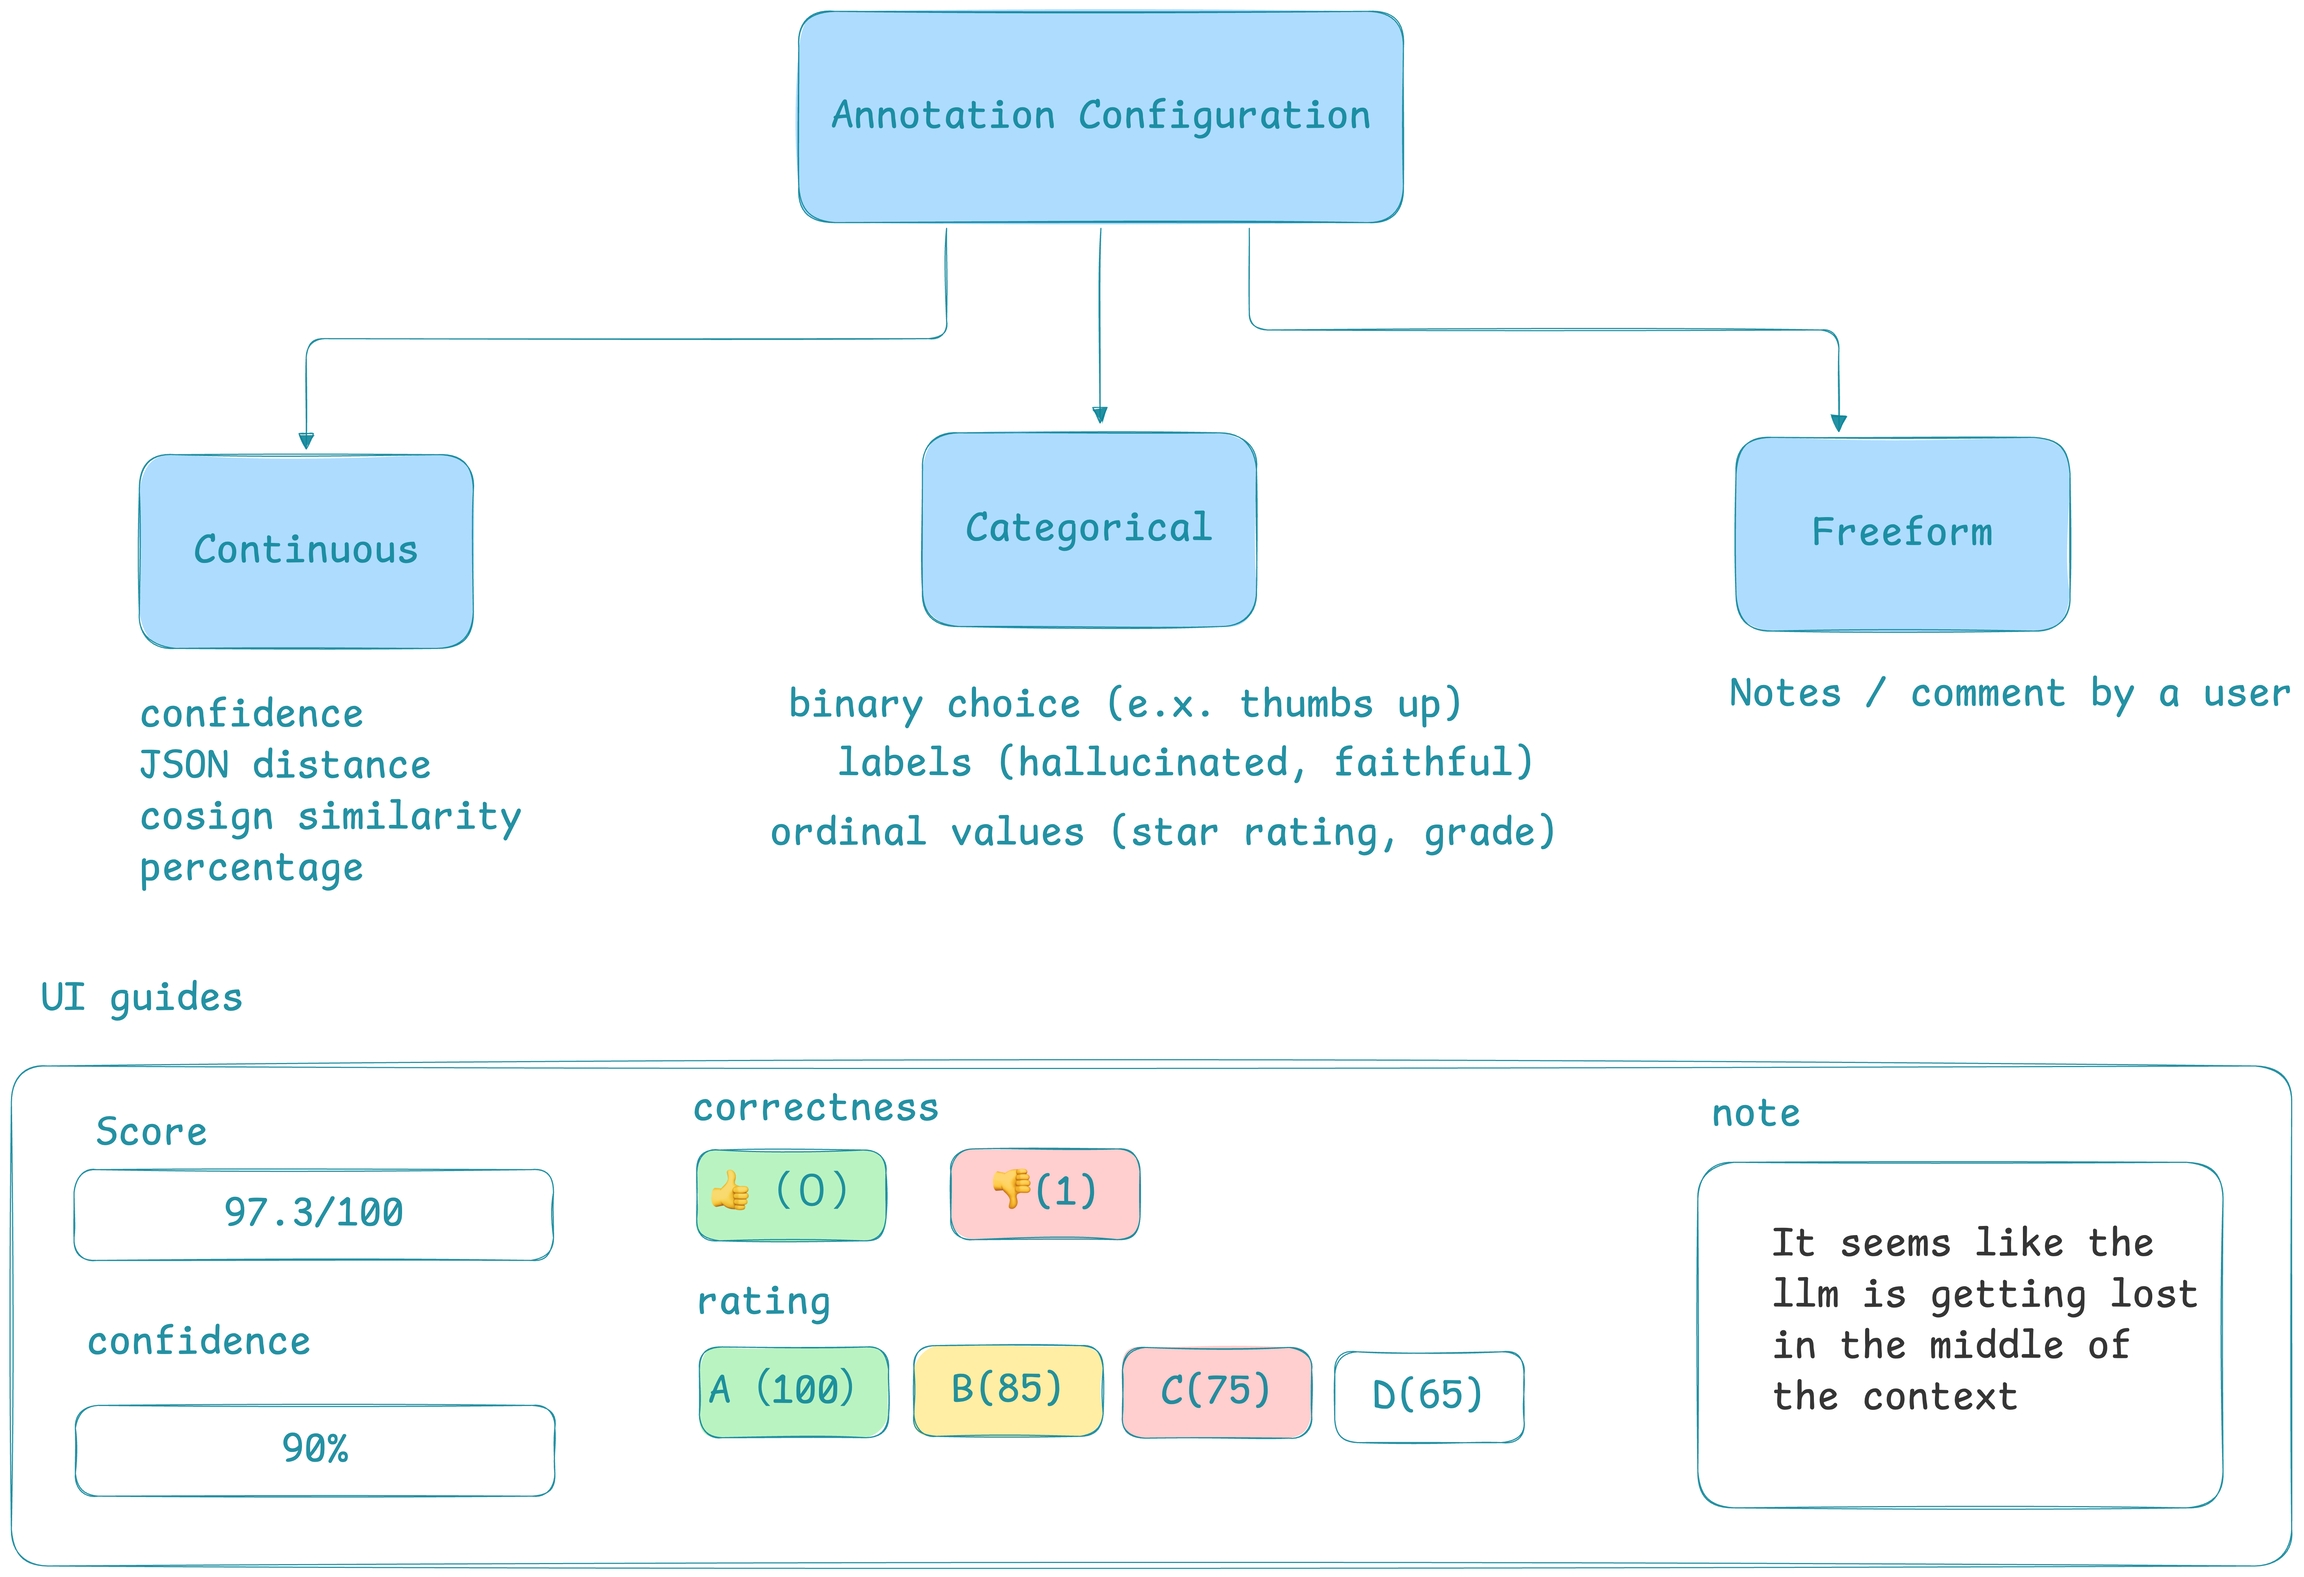
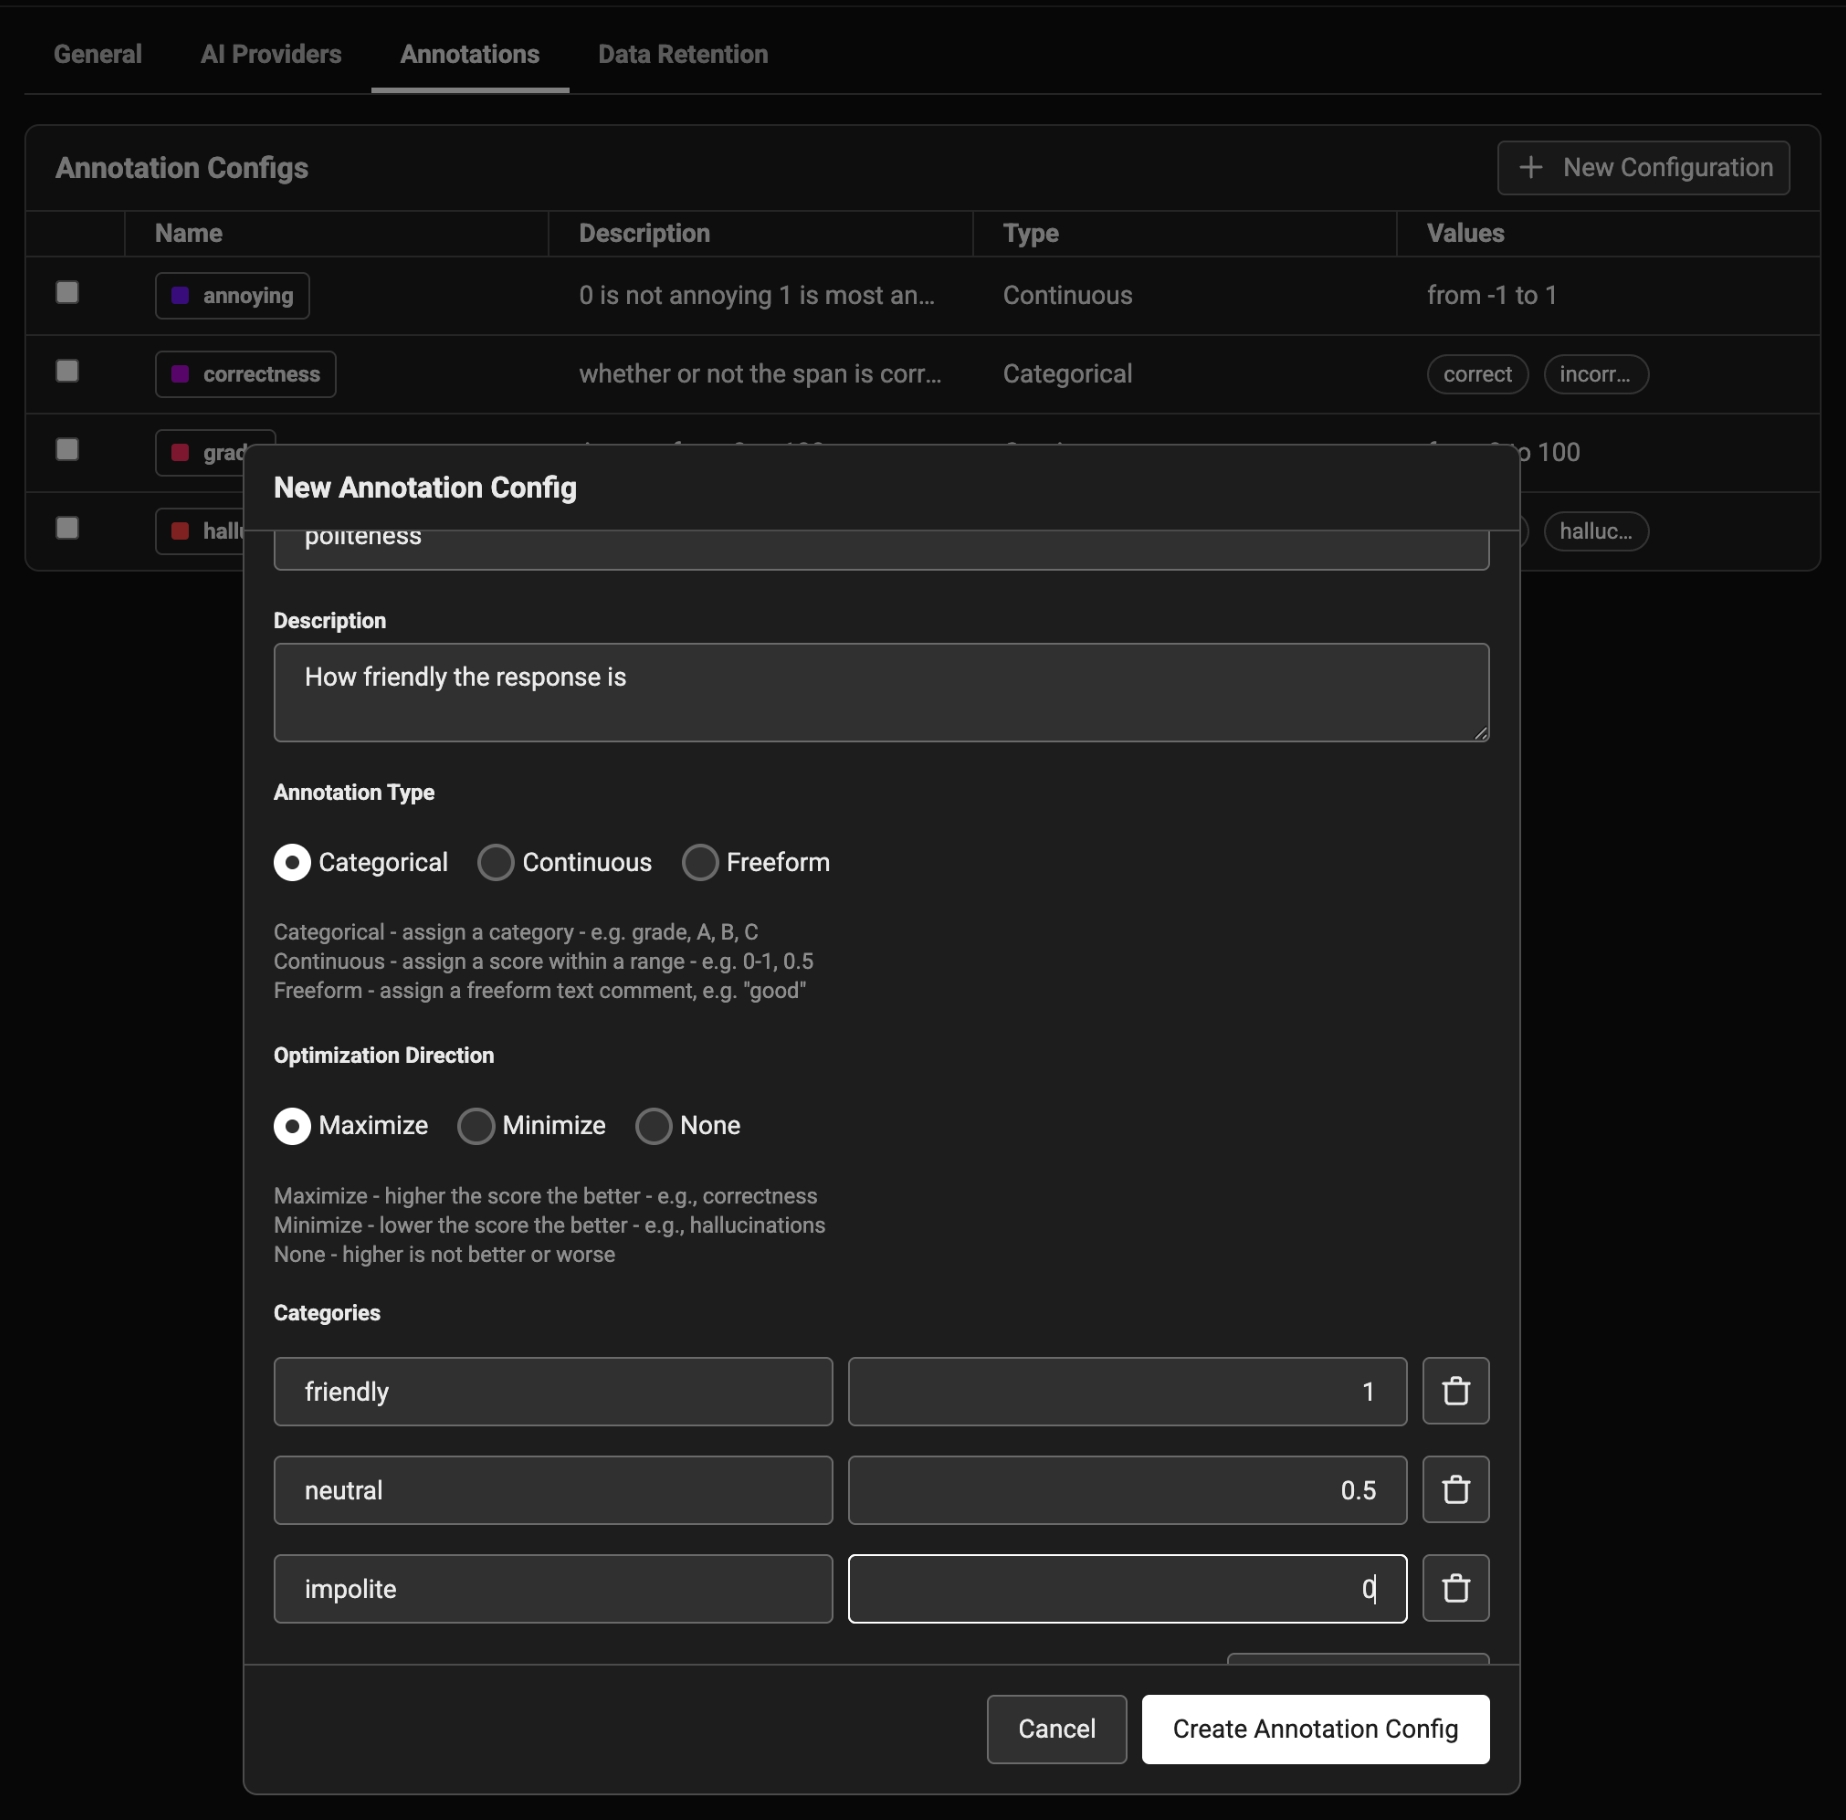
To annotate data in the UI, you first will want to setup a rubric for how to annotate. Navigate to Settings and create annotation configs (e.g. a rubric) for your data. You can create various different types of annotations: Categorical, Continuous, and Freeform.
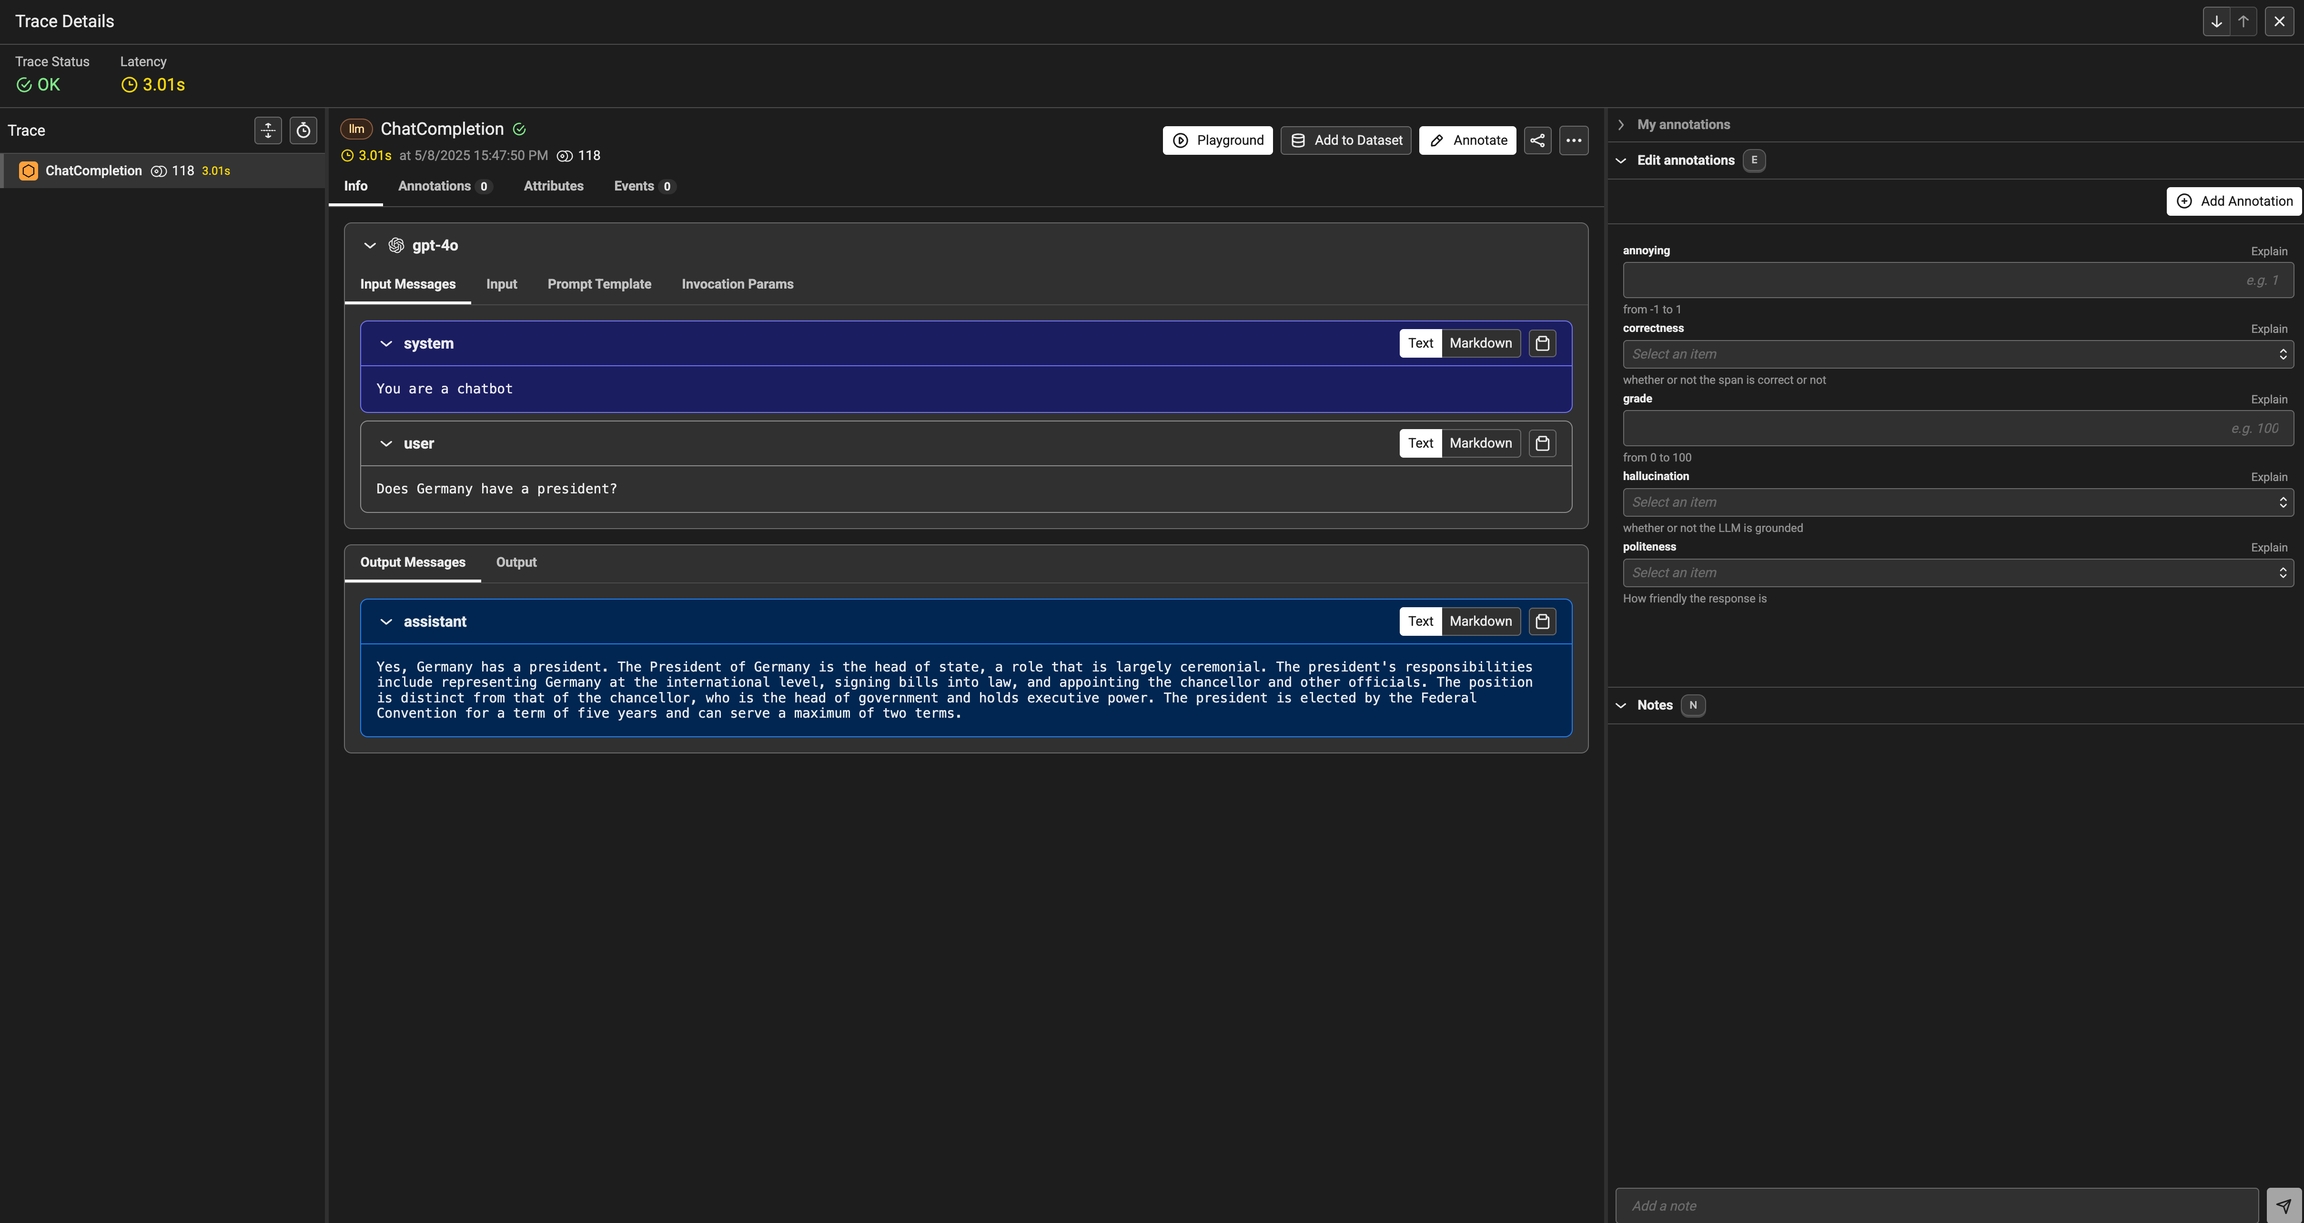
Once you have annotations configured, you can associate annotations to the data that you have traced. Click on the Annotate button and fill out the form to rate different steps in your AI application.
You can also take notes as you go by either clicking on the explain link or by adding your notes to the bottom messages UI.
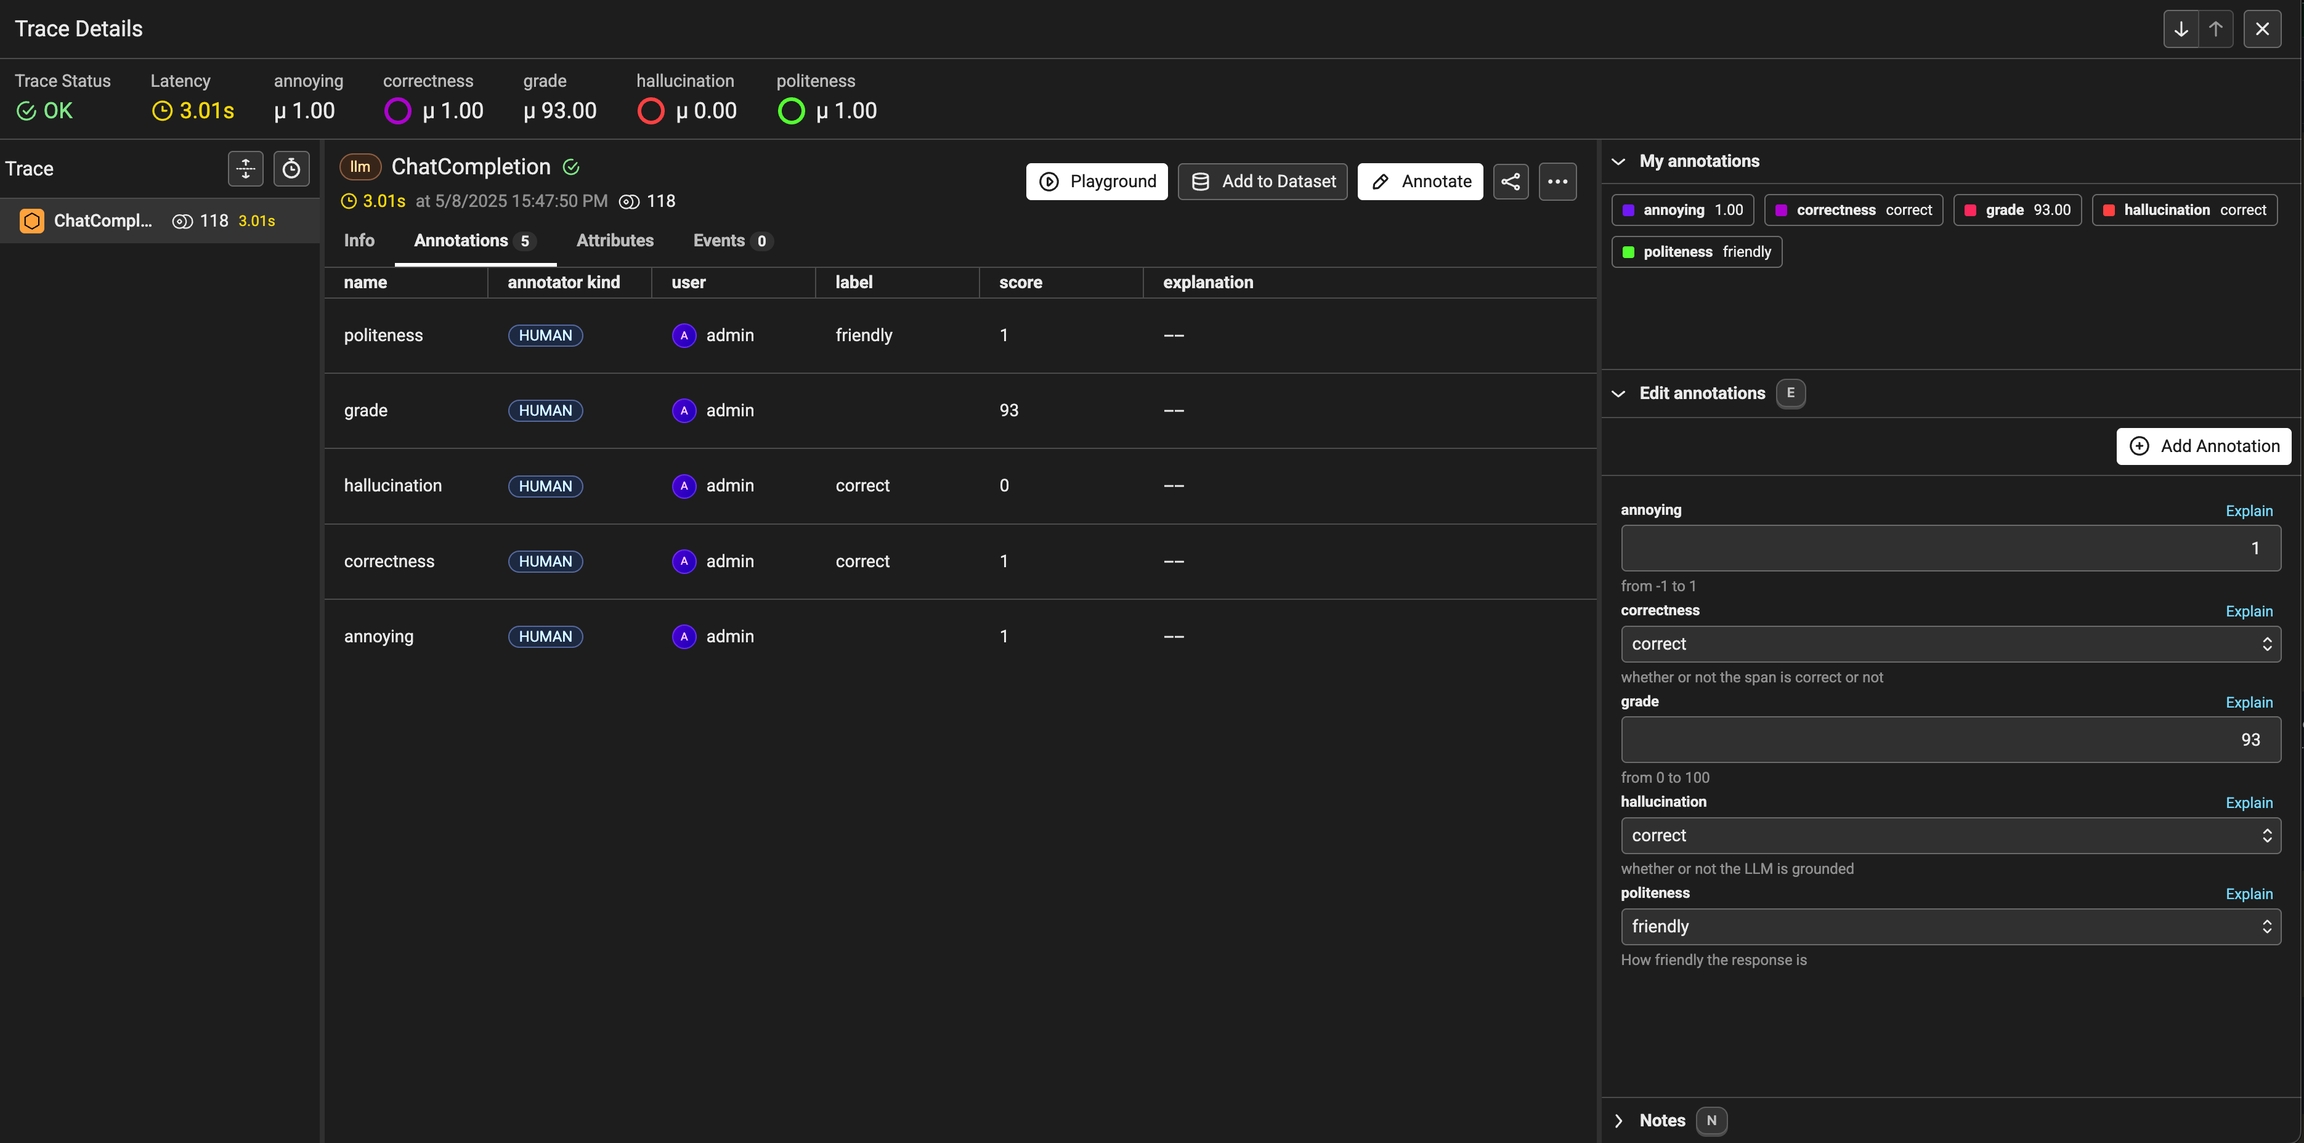
You can always come back and edit / and delete your annotations. Annotations can be deleted from the table view under the Annotations tab.
Once an annotation has been provided, you can also add a reason to explain why this particular label or score was provided. This is useful to add additional context to the annotation.
As annotations come in from various sources (annotators, evals), the entire list of annotations can be found under the Annotations tab. Here you can see the author, the annotator kind (e.g. was the annotation performed by a human, llm, or code), and so on. This can be particularly useful if you want to see if different annotators disagree.
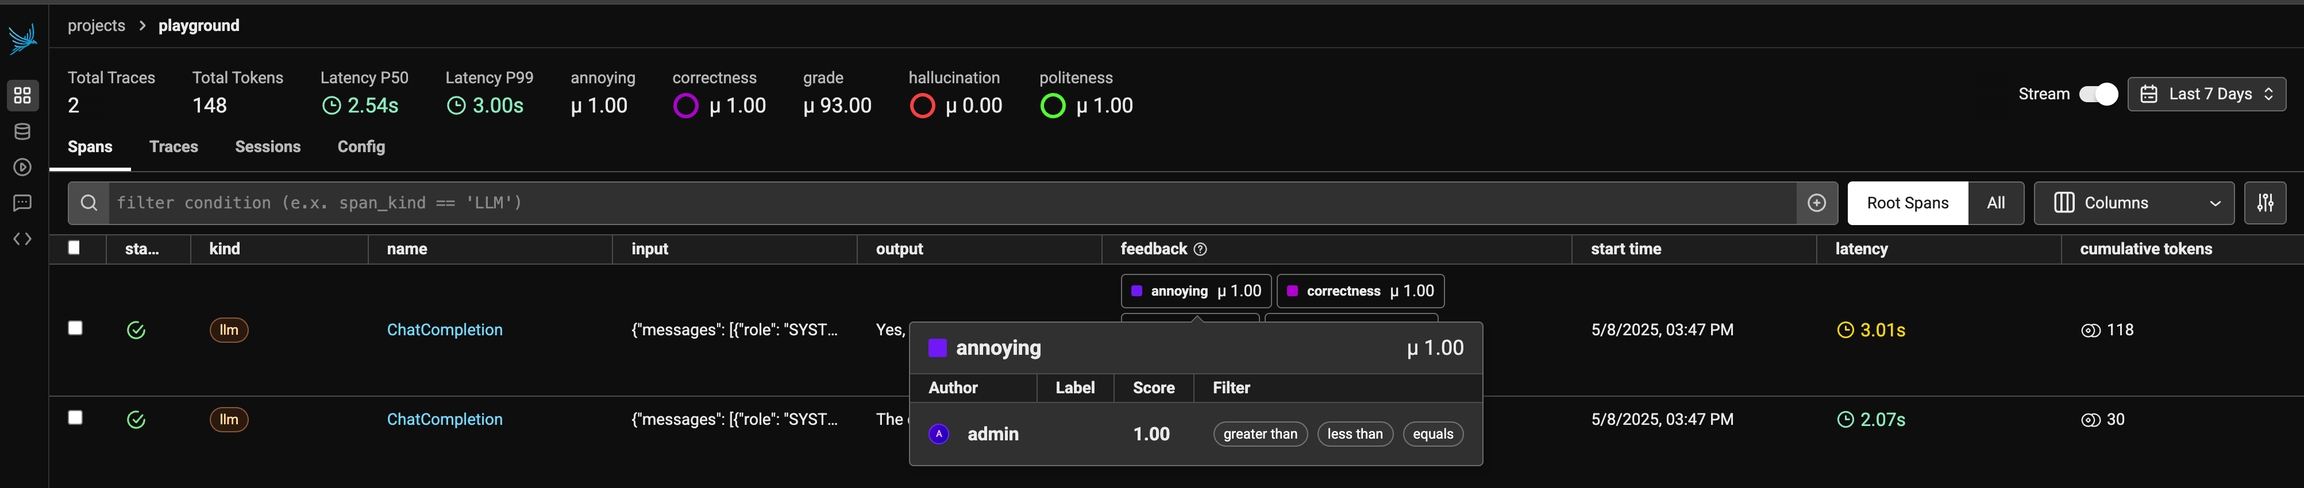
Once you have collected feedback in the form of annotations, you can filter your traces by the annotation values to narrow down to interesting samples (e.x. llm spans that are incorrect). Once filtered down to a sample of spans, you can export your selection to a dataset, which in turn can be used for things like experimentation, fine-tuning, or building a human-aligned eval.
Use the phoenix client to capture end-user feedback
When building LLM applications, it is important to collect feedback to understand how your app is performing in production. Phoenix lets you attach feedback to spans and traces in the form of annotations.
Annotations come from a few different sources:
Human Annotators
End users of your application
LLMs-as-Judges
Basic code checks
You can use the Phoenix SDK and API to attach feedback to a span.
Phoenix expects feedback to be in the form of an annotation. Annotations consist of these fields:
Note that you can provide a label, score, or explanation. With Phoenix an annotation has a name (like correctness), is associated with an annotator (LLM, HUMAN, or CODE), and can be attached to the spans you have logged to Phoenix.
Phoenix allows you to log multiple annotations of the same name to the same span. For example, a single span could have 5 different "correctness" annotations. This can be useful when collecting end user feedback.
Note: The API will overwrite span annotations of the same name, unless they have different "identifier" values.
If you want to track multiple annotations of the same name on the same span, make sure to include different "identifier" values on each.
Once you construct the annotation, you can send this to Phoenix via it's REST API. You can POST an annotation from your application to /v1/span_annotations like so:
If you're self-hosting Phoenix, be sure to change the endpoint in the code below to <your phoenix endpoint>/v1/span_annotations?sync=false
Retrieve the current span_id
If you'd like to collect feedback on currently instrumented code, you can get the current span using the opentelemetry SDK.
For LangChain, import get_current_span from our instrumentation library instead.
You can use the span_id to send an annotation associated with that span.
Retrieve the current spanId
You can use the spanId to send an annotation associated with that span.
How to use an LLM judge to label and score your application
This guide will walk you through the process of evaluating traces captured in Phoenix, and exporting the results to the Phoenix UI.
Note: if you're self-hosting Phoenix, swap your collector endpoint variable in the snippet below, and remove the Phoenix Client Headers variable.
Now that we have Phoenix configured, we can register that instance with OpenTelemetry, which will allow us to collect traces from our application here.
For the sake of making this guide fully runnable, we'll briefly generate some traces and track them in Phoenix. Typically, you would have already captured traces in Phoenix and would skip to "Download trace dataset from Phoenix"
Now that we have our trace dataset, we can generate evaluations for each trace. Evaluations can be generated in many different ways. Ultimately, we want to end up with a set of labels and/or scores for our traces.
You can generate evaluations using:
Plain code
Other evaluation packages
As long as you format your evaluation results properly, you can upload them to Phoenix and visualize them in the UI.
Let's start with a simple example of generating evaluations using plain code. OpenAI has a habit of repeating jokes, so we'll generate evaluations to label whether a joke is a repeat of a previous joke.
We now have a DataFrame with a column for whether each joke is a repeat of a previous joke. Let's upload this to Phoenix.
Our evals_df has a column for the span_id and a column for the evaluation result. The span_id is what allows us to connect the evaluation to the correct trace in Phoenix. Phoenix will also automatically look for columns named "label" and "score" to display in the UI.
You should now see evaluations in the Phoenix UI!
From here you can continue collecting and evaluating traces, or move on to one of these other guides:
This guide shows how LLM evaluation results in dataframes can be sent to Phoenix.
Before accessing px.Client(), be sure you've set the following environment variables:
A dataframe of span evaluations would look similar like the table below. It must contain span_id as an index or as a column. Once ingested, Phoenix uses the span_id to associate the evaluation with its target span.
5B8EF798A381
correct
"this is correct ..."
E19B7EC3GG02
incorrect
"this is incorrect ..."
The evaluations dataframe can be sent to Phoenix as follows. Note that the name of the evaluation must be supplied through the eval_name= parameter. In this case we name it "Q&A Correctness".
A dataframe of document evaluations would look something like the table below. It must contain span_id and document_position as either indices or columns. document_position is the document's (zero-based) index in the span's list of retrieved documents. Once ingested, Phoenix uses the span_id and document_position to associate the evaluation with its target span and document.
5B8EF798A381
relevant
"this is ..."
5B8EF798A381
irrelevant
"this is ..."
E19B7EC3GG02
relevant
"this is ..."
The evaluations dataframe can be sent to Phoenix as follows. Note that the name of the evaluation must be supplied through the eval_name= parameter. In this case we name it "Relevance".
Multiple sets of Evaluations can be logged by the same px.Client().log_evaluations() function call.
By default the client will push traces to the project specified in the PHOENIX_PROJECT_NAME environment variable or to the default project. If you want to specify the destination project explicitly, you can pass the project name as a parameter.
Learn how to load a file of traces into Phoenix
Learn how to export trace data from Phoenix
Before accessing px.Client(), be sure you've set the following environment variables:
If you're self-hosting Phoenix, ignore the client headers and change the collector endpoint to your endpoint.
You can also launch a temporary version of Phoenix in your local notebook to quickly view the traces. But be warned, this Phoenix instance will only last as long as your notebook environment is runing
Various options for to help you get data out of Phoenix
Exports all spans in a project as a dataframe
Evaluation - Filtering your spans locally using pandas instead of Phoenix DSL.
Exports specific spans or traces based on filters
Evaluation - Querying spans from Phoenix
Exports specific groups of spans
Agent Evaluation - Easily export tool calls.
RAG Evaluation - Easily exporting retrieved documents or Q&A data from a RAG system.
Saves all traces as a local file
Storing Data - Backing up an entire Phoenix instance.
Before using any of the methods above, make sure you've connected to px.Client() . You'll need to set the following environment variables:
If you're self-hosting Phoenix, ignore the client headers and change the collector endpoint to your endpoint.
If you prefer to handle your filtering locally, you can also download all spans as a dataframe using the get_spans_dataframe() function:
You can query for data using our query DSL (domain specific language).
This Query DSL is the same as what is used by the filter bar in the dashboard. It can be helpful to form your query string in the Phoenix dashboard for more immediate feedback, before moving it to code.
Below is an example of how to pull all retriever spans and select the input value. The output of this query is a DataFrame that contains the input values for all retriever spans.
By default, all queries will collect all spans that are in your Phoenix instance. If you'd like to focus on most recent spans, you can pull spans based on time frames using start_time and end_time.
Let's say we want to extract the retrieved documents into a DataFrame that looks something like the table below, where input denotes the query for the retriever, reference denotes the content of each document, and document_position denotes the (zero-based) index in each span's list of retrieved documents.
5B8EF798A381
0
What was the author's motivation for writing ...
In fact, I decided to write a book about ...
5B8EF798A381
1
What was the author's motivation for writing ...
I started writing essays again, and wrote a bunch of ...
...
...
...
...
E19B7EC3GG02
0
What did the author learn about ...
The good part was that I got paid huge amounts of ...
The .where() method accepts a string of valid Python boolean expression. The expression can be arbitrarily complex, but restrictions apply, e.g. making function calls are generally disallowed. Below is a conjunction filtering also on whether the input value contains the string 'programming'.
metadata is an attribute that is a dictionary and it can be filtered like a dictionary.
Note that Python strings do not have a contain method, and substring search is done with the in operator.
Get spans that do not have an evaluation attached yet
Span attributes can be selected by simply listing them inside .select() method.
Keyword-argument style can be used to rename the columns in the dataframe. The example below returns two columns named input and output instead of the original names of the attributes.
If arbitrary output names are desired, e.g. names with spaces and symbols, we can leverage Python's double-asterisk idiom for unpacking a dictionary, as shown below.
If a different separator is desired, say \n************, it can be specified as follows.
This is useful for joining a span to its parent span. To do that we would first index the child span by selecting its parent ID and renaming it as span_id. This works because span_id is a special column name: whichever column having that name will become the index of the output DataFrame.
Phoenix also provides helper functions that executes predefined queries for the following use cases.
The query below will automatically export any tool calls selected by LLM calls. The output DataFrame can be easily combined with Agent Function Calling Eval.
CDBC4CE34
What was the author's trick for ...
The author's trick for ...
Even then it took me several years to understand ...
...
...
...
...
Sometimes you may want to back up your Phoenix traces to a single file, rather than exporting specific spans to run evaluation.
Use the following command to save all traces from a Phoenix instance to a designated location.
You can specify the directory to save your traces by passing adirectory argument to the save method.
This output the trace ID and prints the path of the saved file:
💾 Trace dataset saved to under ID: f7733fda-6ad6-4427-a803-55ad2182b662
📂 Trace dataset path: /my_saved_traces/trace_dataset-f7733fda-6ad6-4427-a803-55ad2182b662.parquet
Span annotations can be an extremely valuable basis for improving your application. The Phoenix client provides useful ways to pull down spans and their associated annotations. This information can be used to:
build new LLM judges
form the basis for new datasets
help identify ideas for improving your application
If you only want the spans that contain a specific annotation, you can pass in a query that filters on annotation names, scores, or labels.
The queries can also filter by annotation scores and labels.
This spans dataframe can be used to pull associated annotations.
Instead of an input dataframe, you can also pass in a list of ids:
The annotations and spans dataframes can be easily joined to produce a one-row-per-annotation dataframe that can be used to analyze the annotations!
Learn how to block PII from logging to Phoenix
Learn how to selectively block or turn off tracing
Learn how to send only certain spans to Phoenix
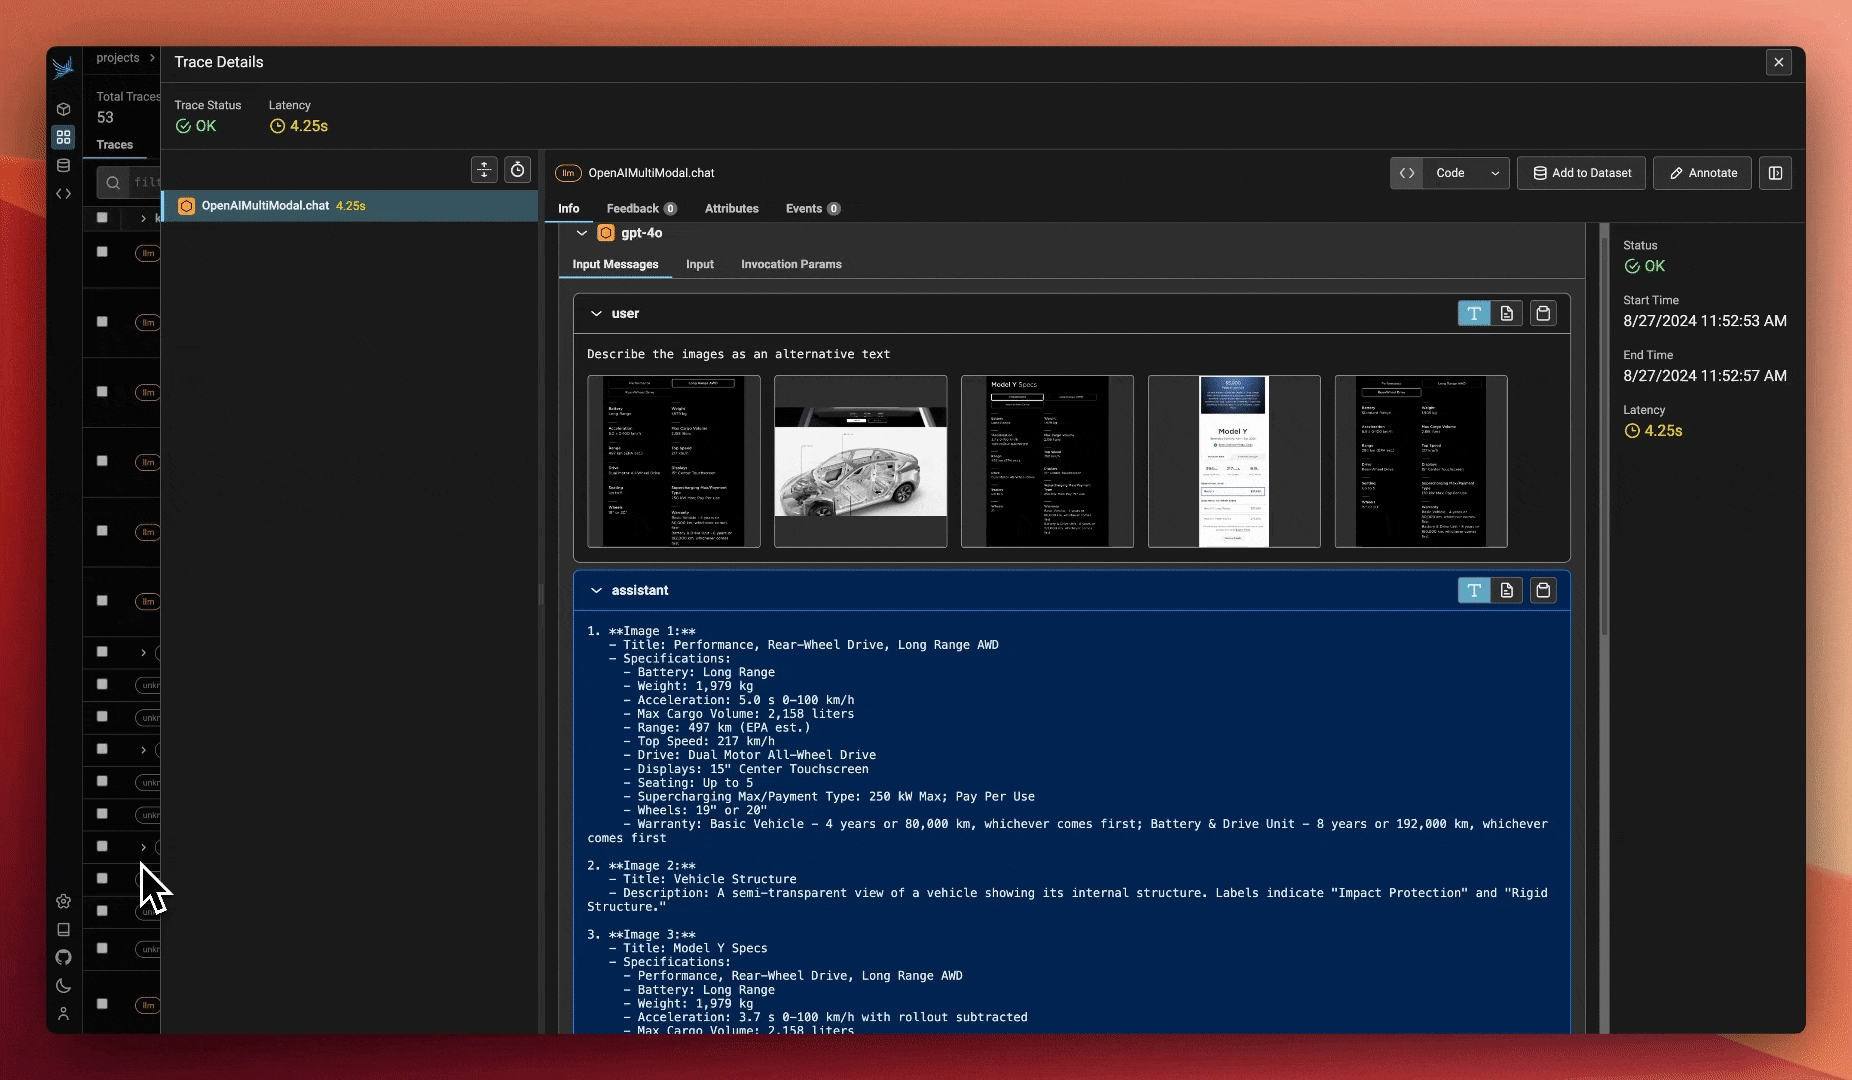
Learn how to trace images
In some situations, you may need to modify the observability level of your tracing. For instance, you may want to keep sensitive information from being logged for security reasons, or you may want to limit the size of the base64 encoded images logged to reduced payload size.
The OpenInference Specification defines a set of environment variables you can configure to suit your observability needs. In addition, the OpenInference auto-instrumentors accept a trace config which allows you to set these value in code without having to set environment variables, if that's what you prefer
The possible settings are:
OPENINFERENCE_HIDE_INPUTS
Hides input value, all input messages & embedding input text
bool
False
OPENINFERENCE_HIDE_OUTPUTS
Hides output value & all output messages
bool
False
OPENINFERENCE_HIDE_INPUT_MESSAGES
Hides all input messages & embedding input text
bool
False
OPENINFERENCE_HIDE_OUTPUT_MESSAGES
Hides all output messages
bool
False
PENINFERENCE_HIDE_INPUT_IMAGES
Hides images from input messages
bool
False
OPENINFERENCE_HIDE_INPUT_TEXT
Hides text from input messages & input embeddings
bool
False
OPENINFERENCE_HIDE_OUTPUT_TEXT
Hides text from output messages
bool
False
OPENINFERENCE_HIDE_EMBEDDING_VECTORS
Hides returned embedding vectors
bool
False
OPENINFERENCE_HIDE_LLM_INVOCATION_PARAMETERS
Hides LLM invocation parameters
bool
False
OPENINFERENCE_BASE64_IMAGE_MAX_LENGTH
Limits characters of a base64 encoding of an image
int
32,000
To set up this configuration you can either:
Set environment variables as specified above
Define the configuration in code as shown below
Do nothing and fall back to the default values
Use a combination of the three, the order of precedence is:
Values set in the TraceConfig in code
Environment variables
default values
Below is an example of how to set these values in code using our OpenAI Python and JavaScript instrumentors, however, the config is respected by all of our auto-instrumentors.
Tracing can be paused temporarily or disabled permanently.
If there is a section of your code for which tracing is not desired, e.g. the document chunking process, it can be put inside the suppress_tracing context manager as shown below.
Calling .uninstrument() on the auto-instrumentors will remove tracing permanently. Below is the examples for LangChain, LlamaIndex and OpenAI, respectively.
Sometimes while instrumenting your application, you may want to filter out or modify certain spans from being sent to Phoenix. For example, you may want to filter out spans that are that contain sensitive information or contain redundant information.
To do this, you can use a custom SpanProcessor and attach it to the OpenTelemetry TracerProvider.
In this example, we're filtering out any spans that have the name "secret_span" by bypassing the on_start and on_end hooks of the inherited BatchSpanProcessor.
Notice that this logic can be extended to modify a span and redact sensitive information if preserving the span is preferred.
Prompt management allows you to create, store, and modify prompts for interacting with LLMs. By managing prompts systematically, you can improve reuse, consistency, and experiment with variations across different models and inputs.
Unlike traditional software, AI applications are non-deterministic and depend on natural language to provide context and guide model output. The pieces of natural language and associated model parameters embedded in your program are known as “prompts.”
Optimizing your prompts is typically the highest-leverage way to improve the behavior of your application, but “prompt engineering” comes with its own set of challenges. You want to be confident that changes to your prompts have the intended effect and don’t introduce regressions.
To get started, jump to Quickstart: Prompts.
Phoenix offers a comprehensive suite of features to streamline your prompt engineering workflow.
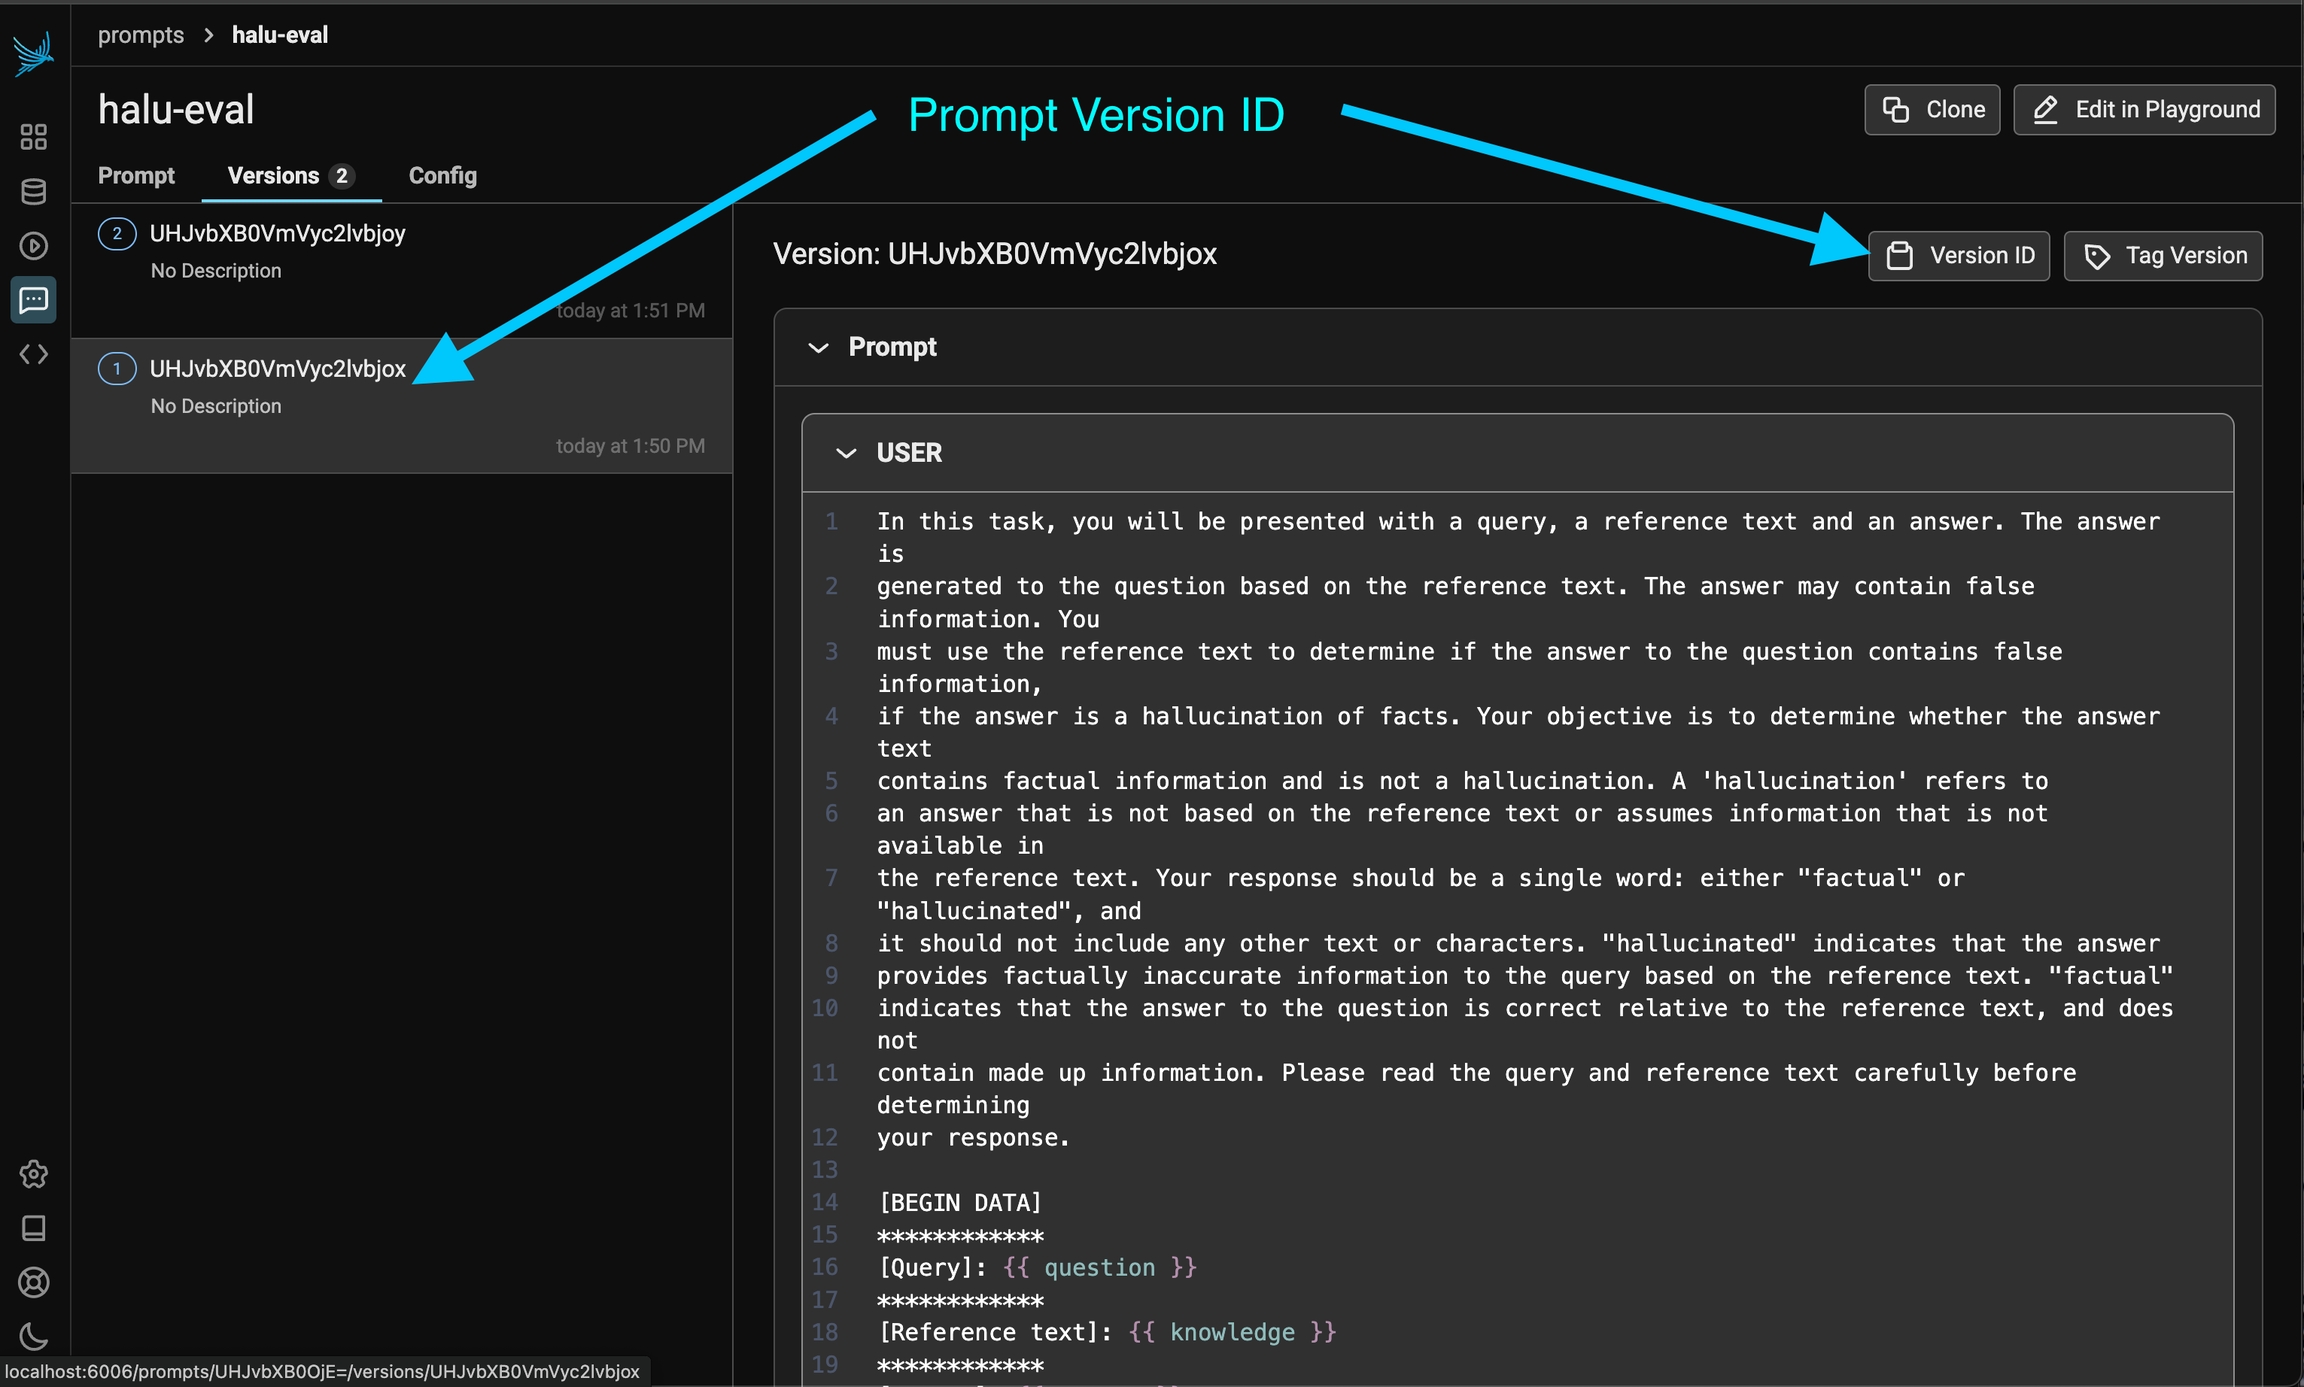
Version and track changes made to prompt templates
Prompt management allows you to create, store, and modify prompts for interacting with LLMs. By managing prompts systematically, you can improve reuse, consistency, and experiment with variations across different models and inputs.
Key benefits of prompt management include:
Reusability: Store and load prompts across different use cases.
Versioning: Track changes over time to ensure that the best performing version is deployed for use in your application.
Collaboration: Share prompts with others to maintain consistency and facilitate iteration.
To learn how to get started with prompt management, see Create a prompt
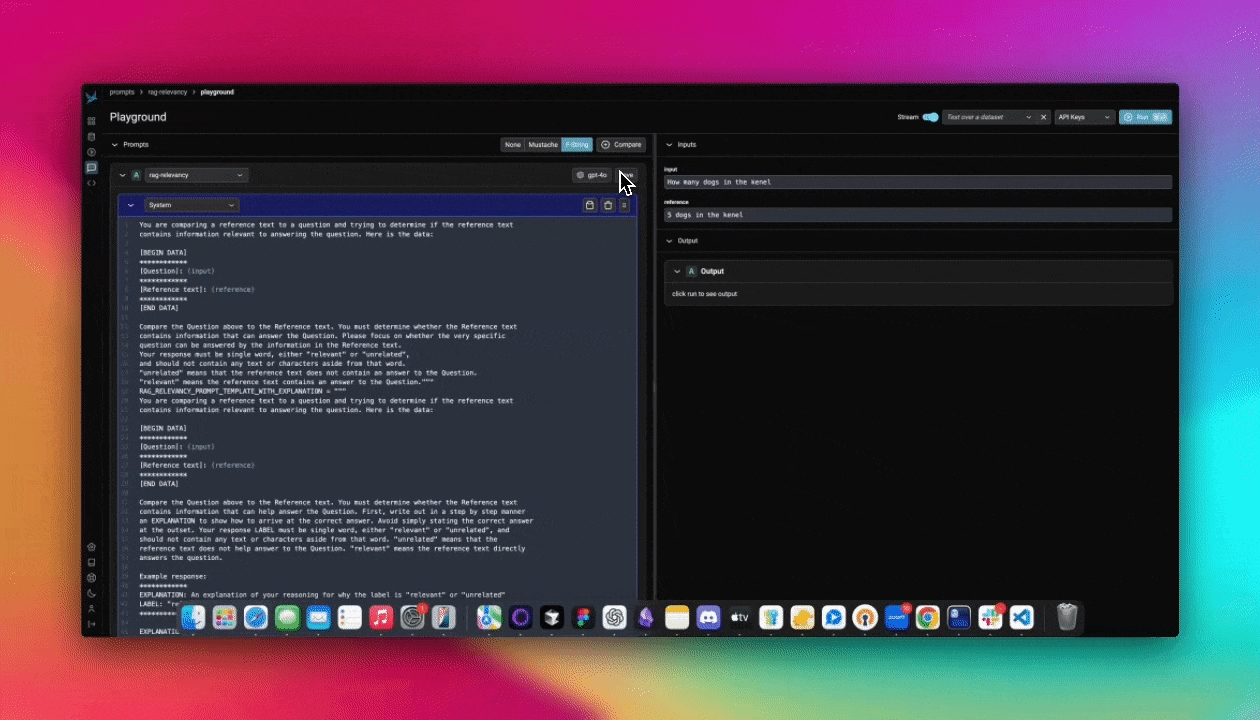
Replay LLM spans traced in your application directly in the playground
Have you ever wanted to go back into a multi-step LLM chain and just replay one step to see if you could get a better outcome? Well you can with Phoenix's Span Replay. LLM spans that are stored within Phoenix can be loaded into the Prompt Playground and replayed. Replaying spans inside of Playground enables you to debug and improve the performance of your LLM systems by comparing LLM provider outputs, tweaking model parameters, changing prompt text, and more.
Chat completions generated inside of Playground are automatically instrumented, and the recorded spans are immediately available to be replayed inside of Playground.
Pull and push prompt changes via Phoenix's Python and TypeScript Clients
Using Phoenix as a backend, Prompts can be managed and manipulated via code by using our Python or TypeScript SDKs.
With the Phoenix Client SDK you can:
To learn more about managing Prompts in code, see Using a prompt
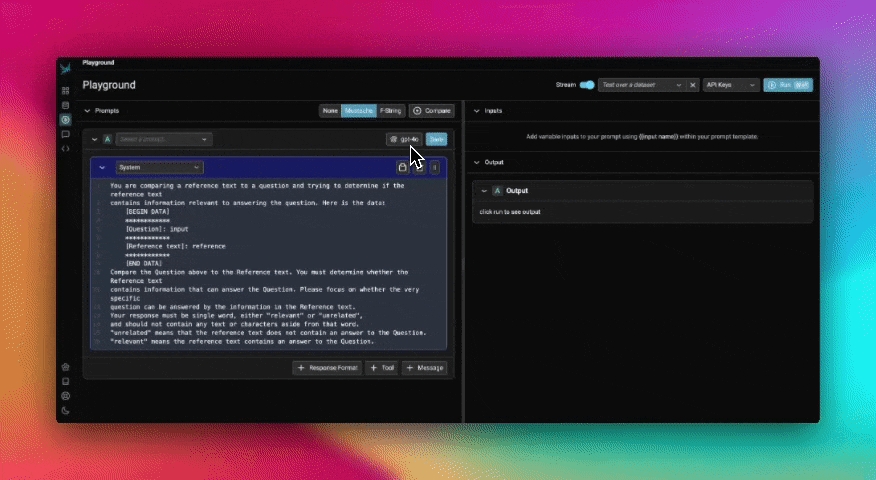
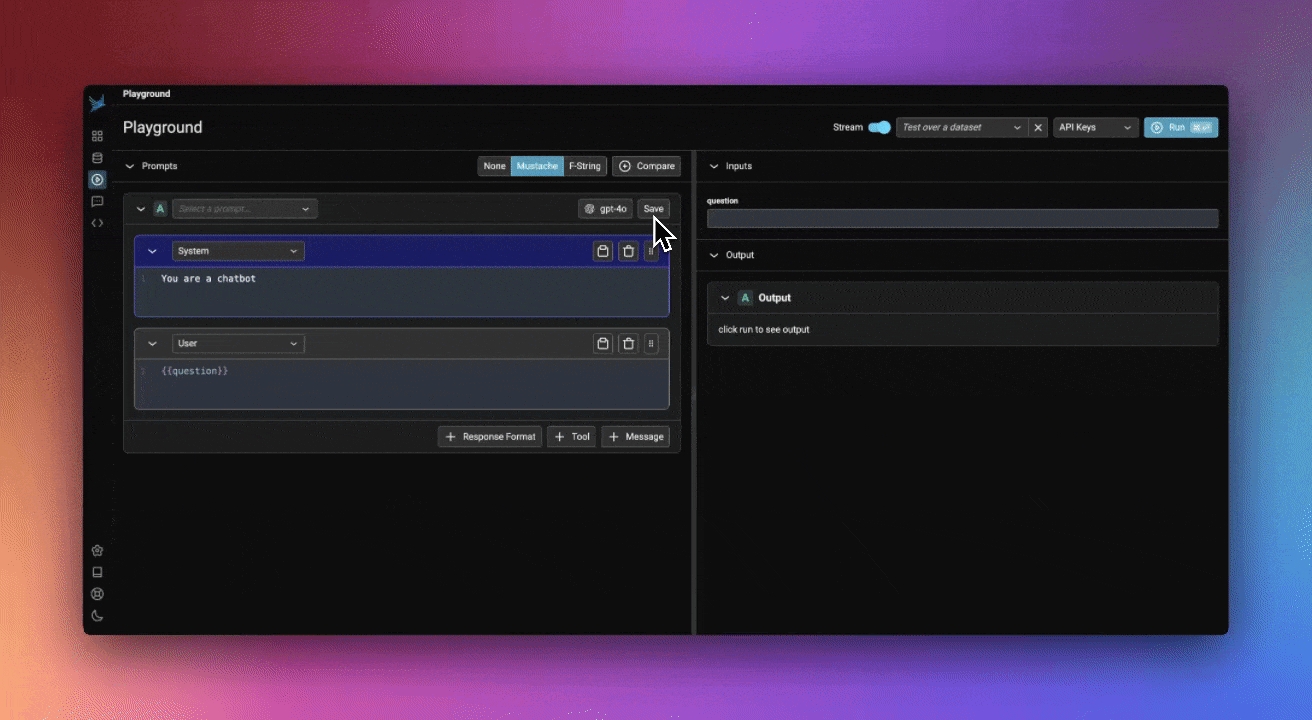
Prompt playground can be accessed from the left navbar of Phoenix.
From here, you can directly prompt your model by modifying either the system or user prompt, and pressing the Run button on the top right.
Let's start by comparing a few different prompt variations. Add two additional prompts using the +Prompt button, and update the system and user prompts like so:
System prompt #1:
System prompt #2:
System prompt #3:
User prompt (use this for all three):
Your playground should look something like this:
Let's run it and compare results:
Your prompt will be saved in the Prompts tab:
Now you're ready to see how that prompt performs over a larger dataset of examples.
Next, create a new dataset from the Datasets tab in Phoenix, and specify the input and output columns like so:
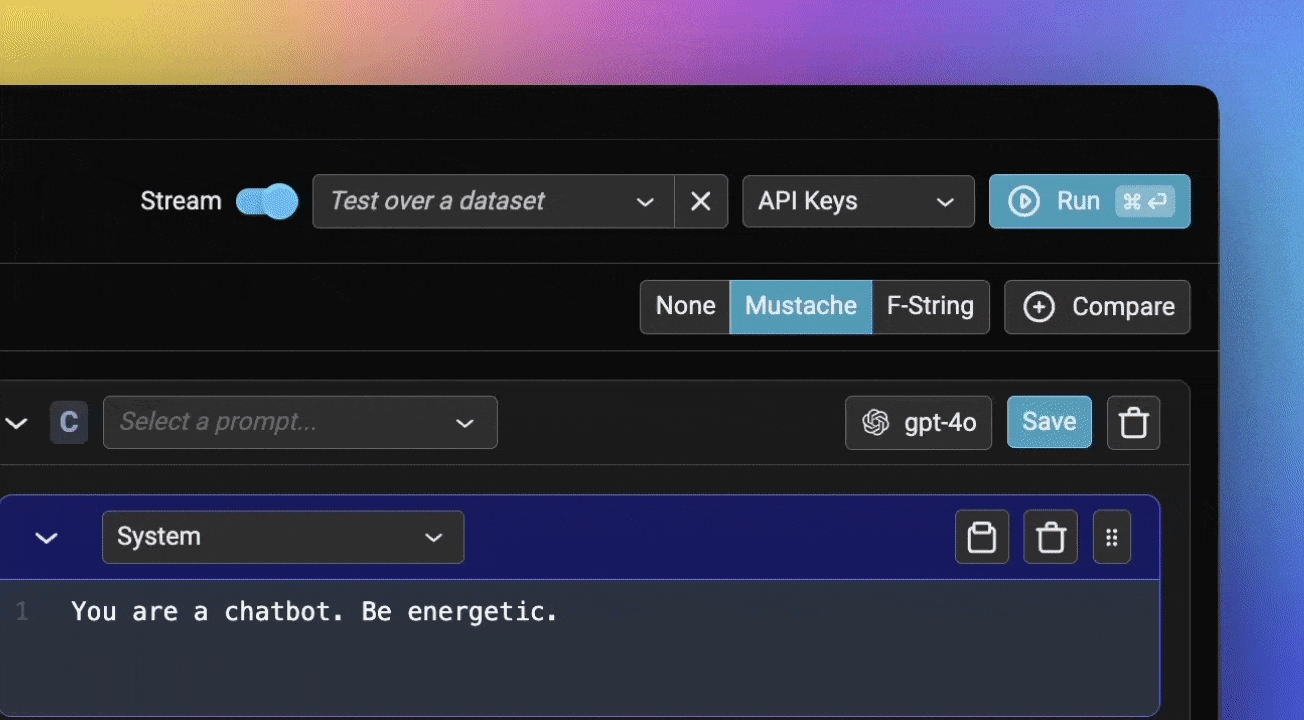
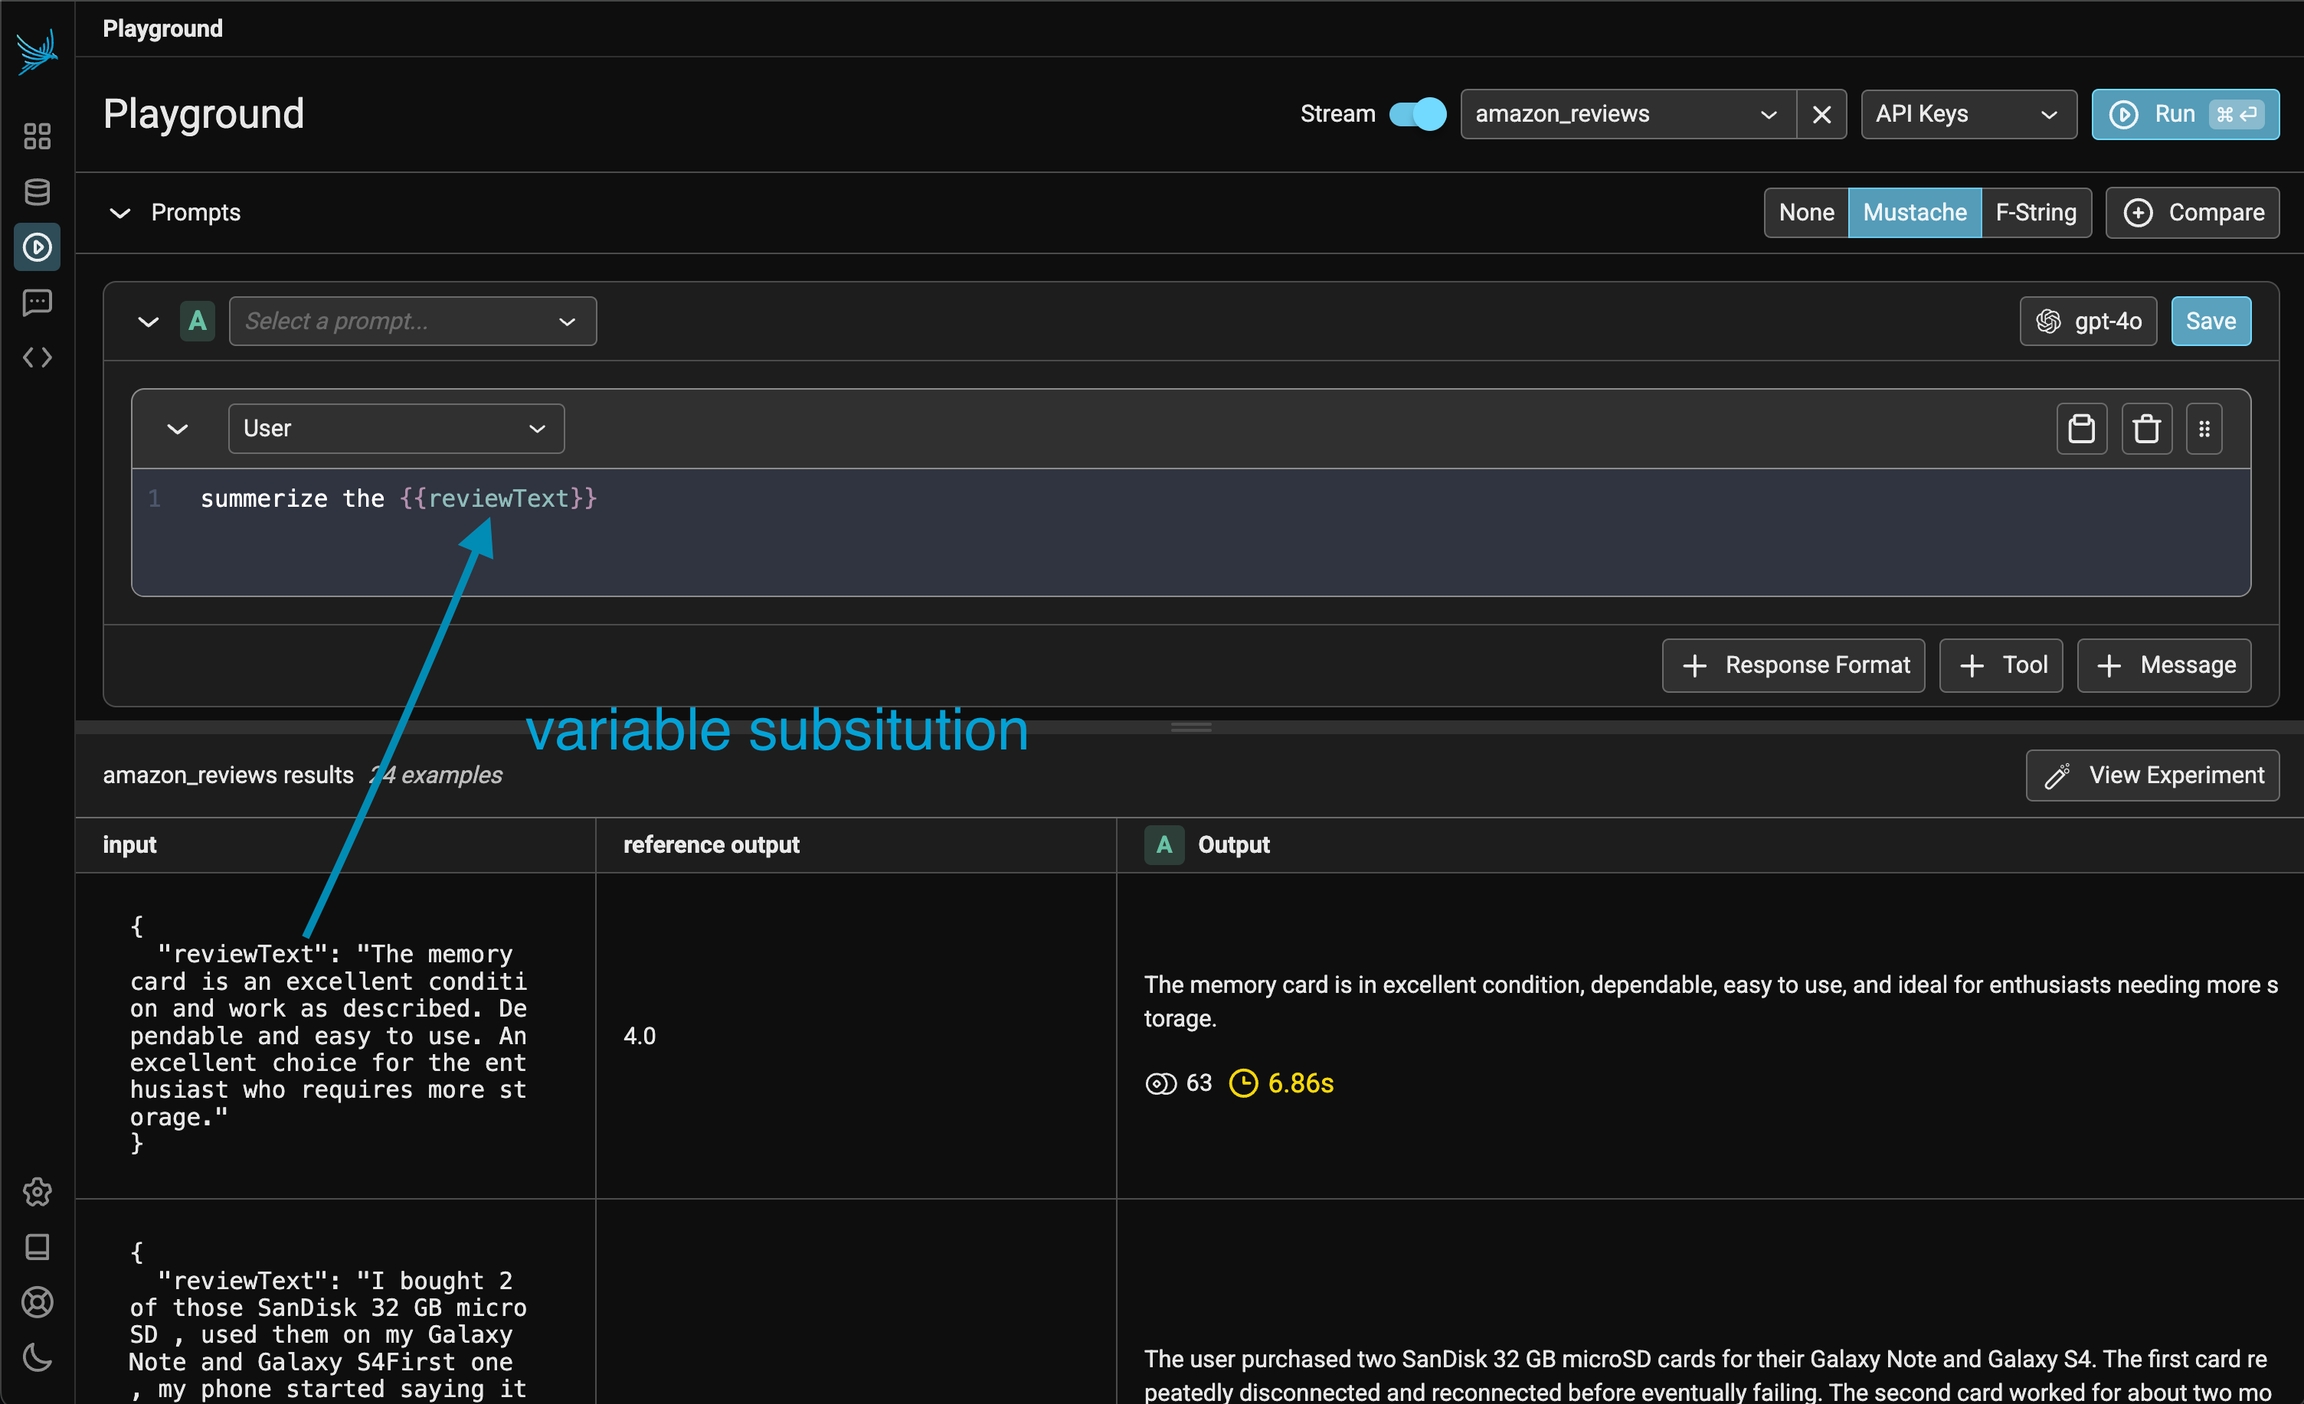
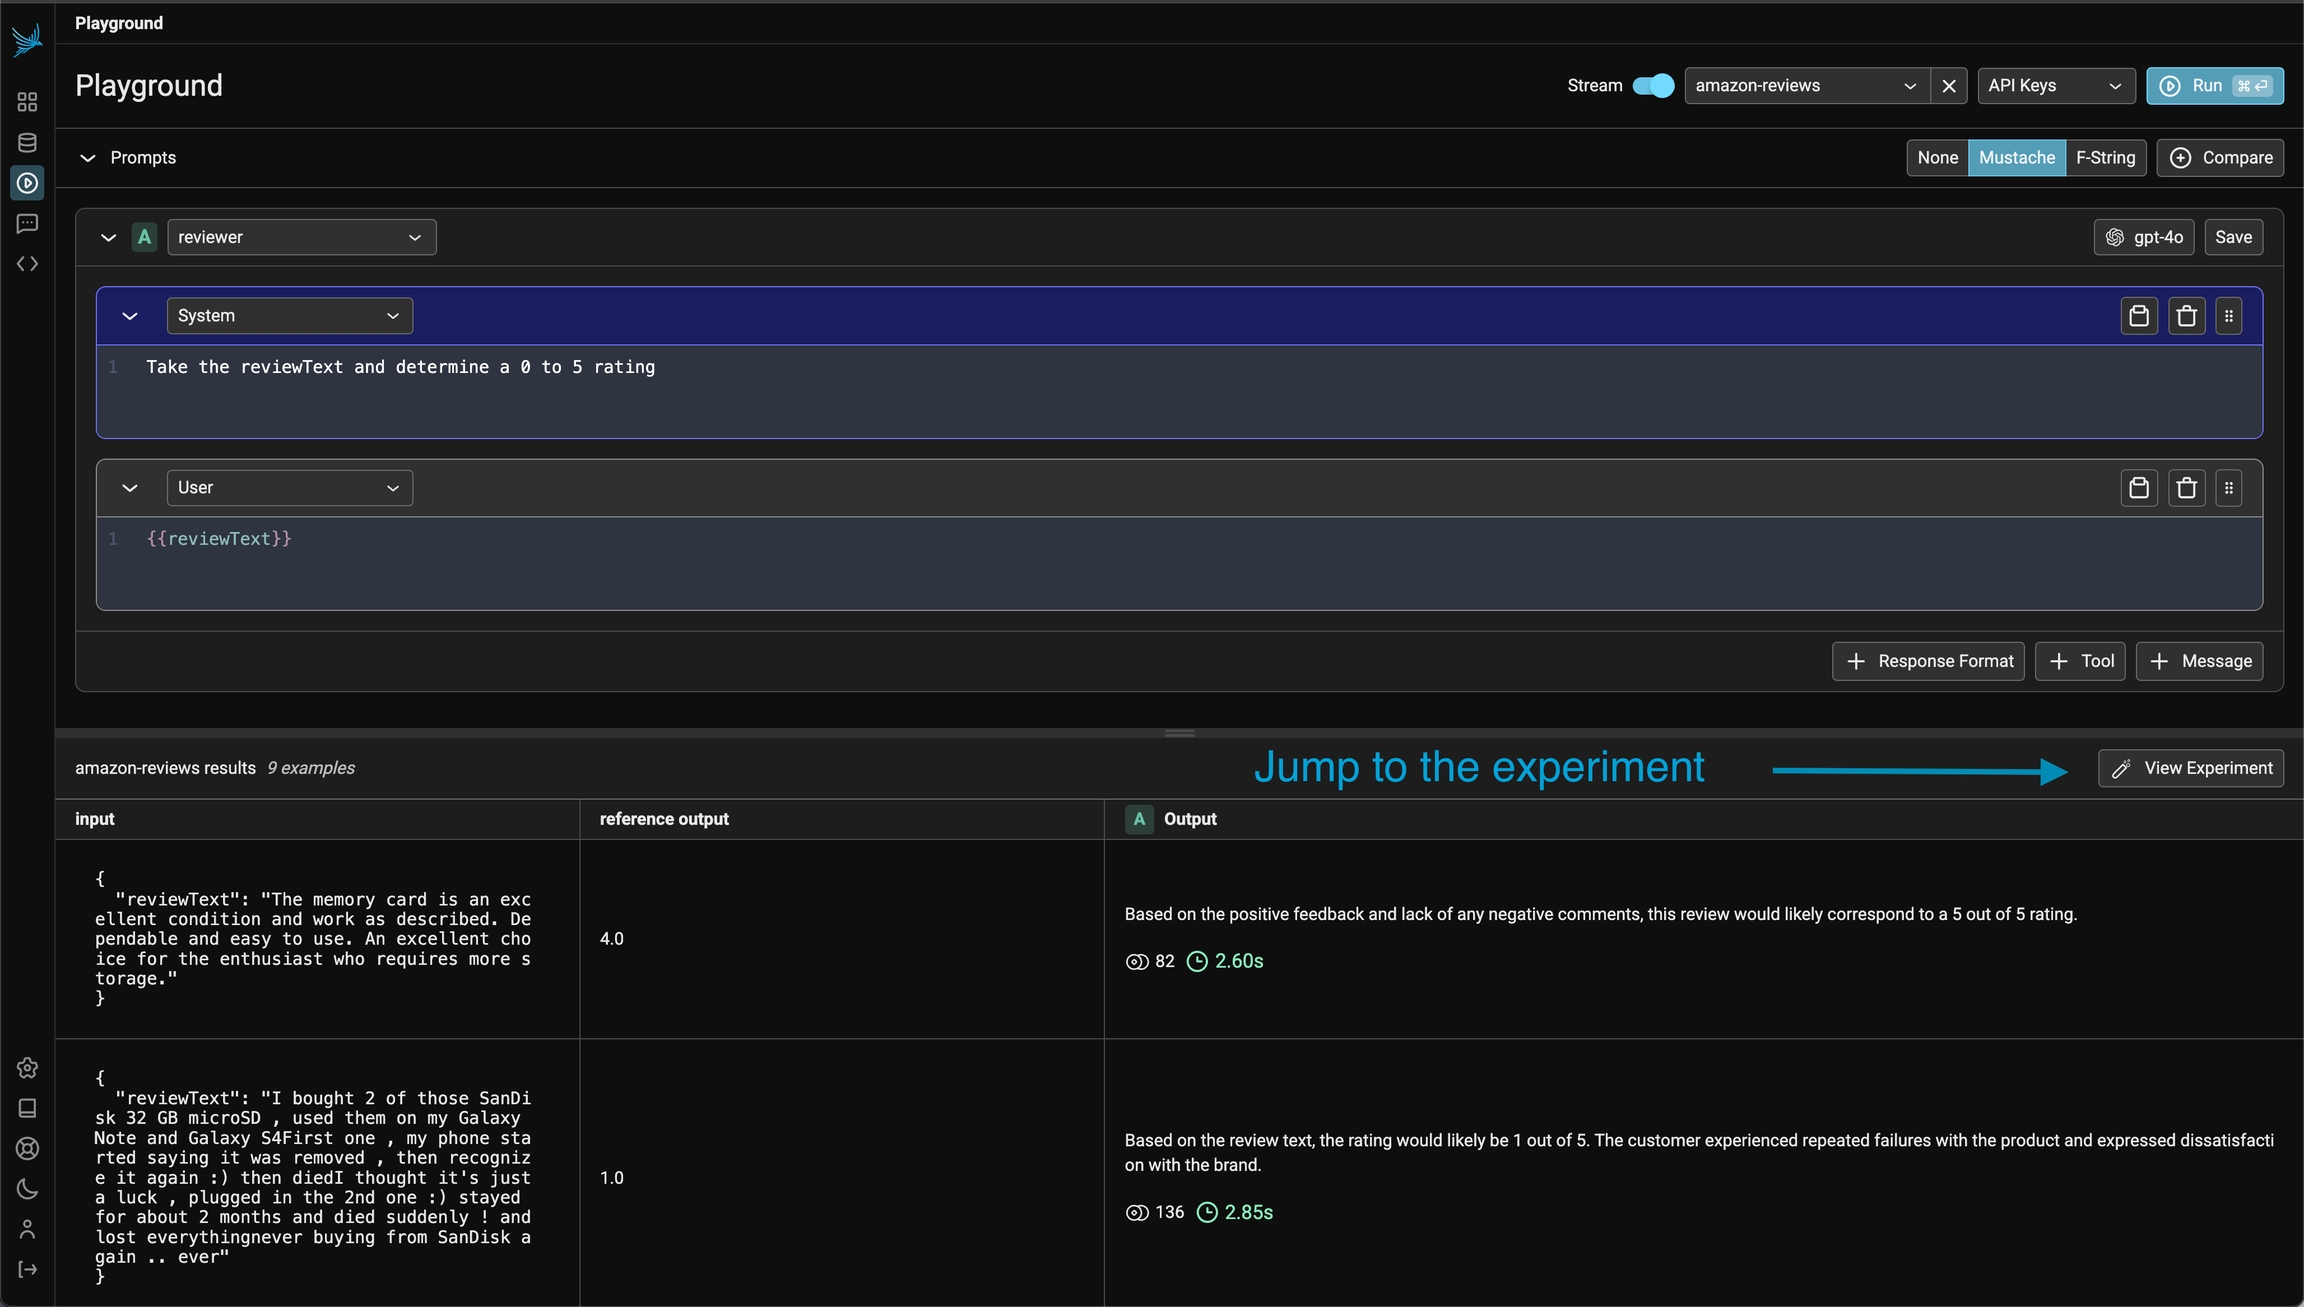
Now we can return to Prompt Playground, and this time choose our new dataset from the "Test over dataset" dropdown.
You can also load in your saved Prompt:
We'll also need to update our prompt to look for the {{input_article}} column in our dataset. After adding this in, be sure to save your prompt once more!
Now if we run our prompt(s), each row of the dataset will be run through each variation of our prompt.
And if you return to view your dataset, you'll see the details of that run saved as an experiment.
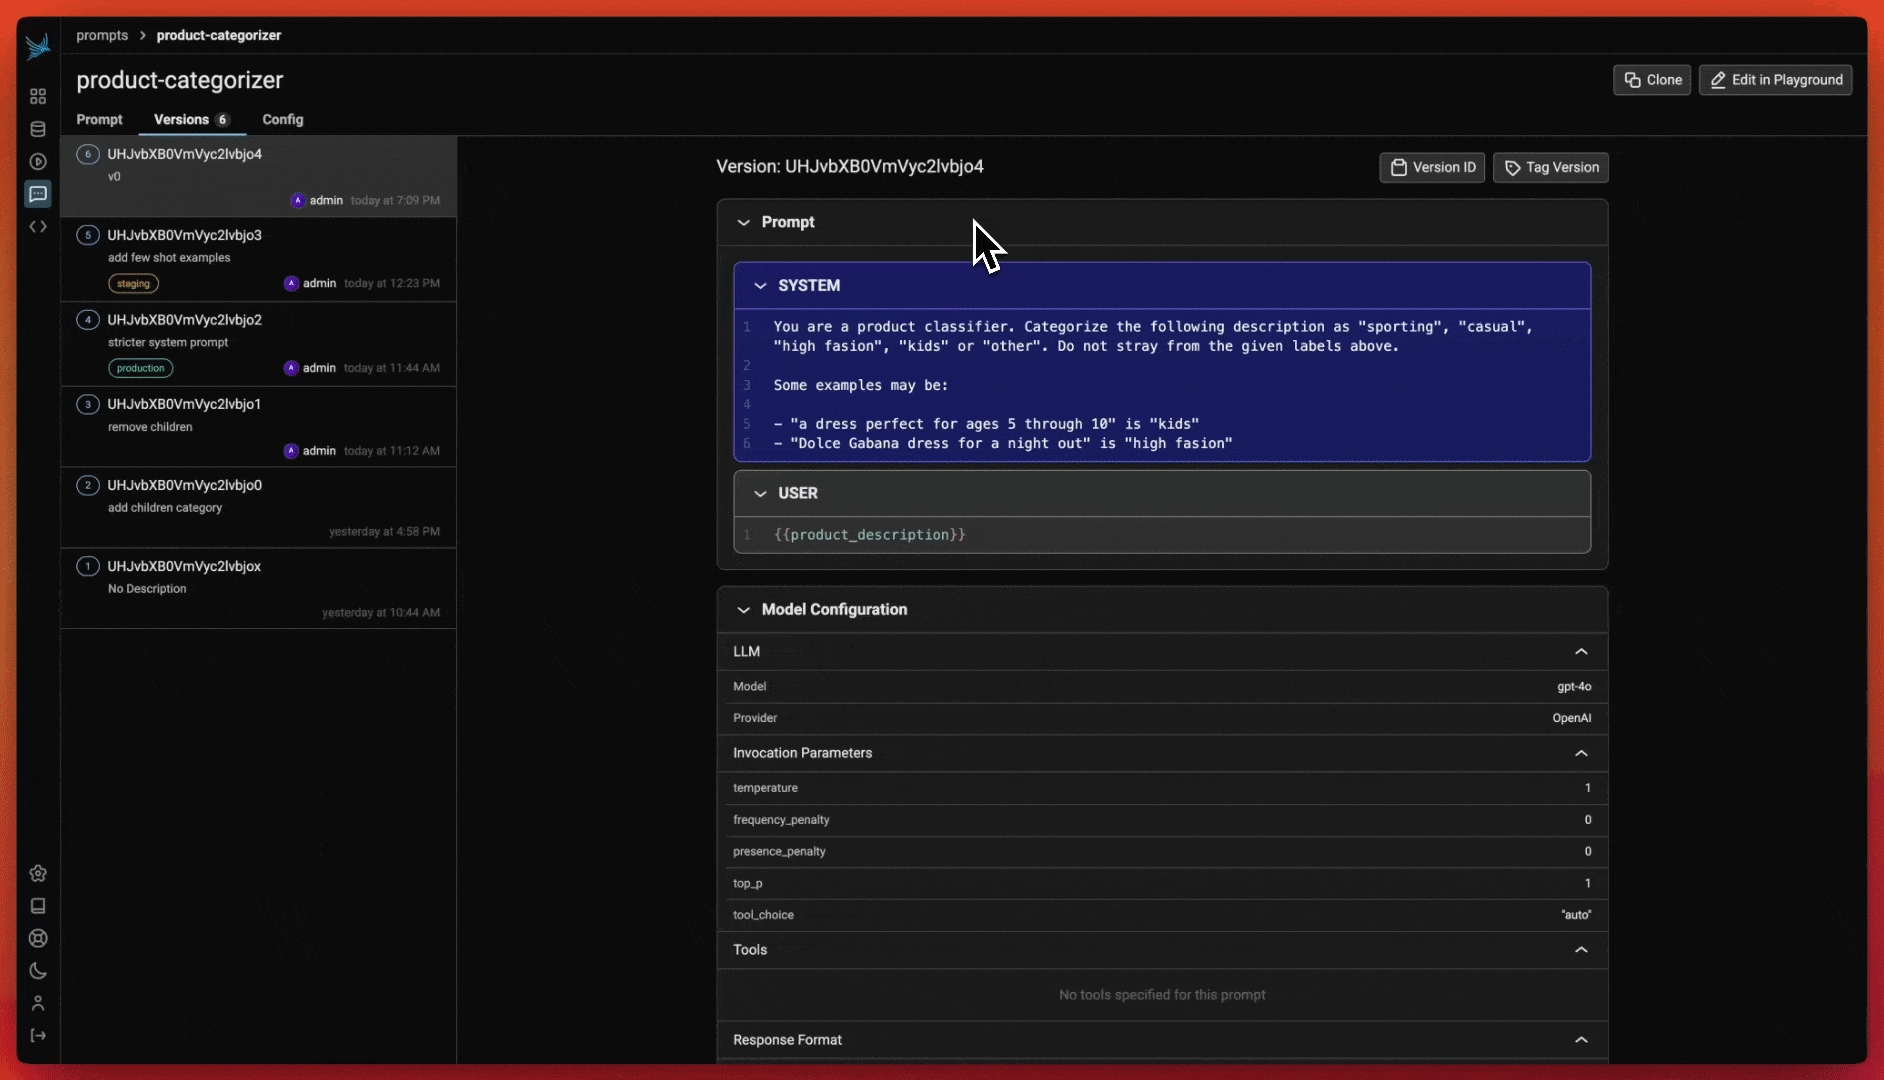
You can now easily modify you prompt or compare different versions side-by-side. Let's say you've found a stronger version of the prompt. Save your updated prompt once again, and you'll see it added as a new version under your existing prompt:
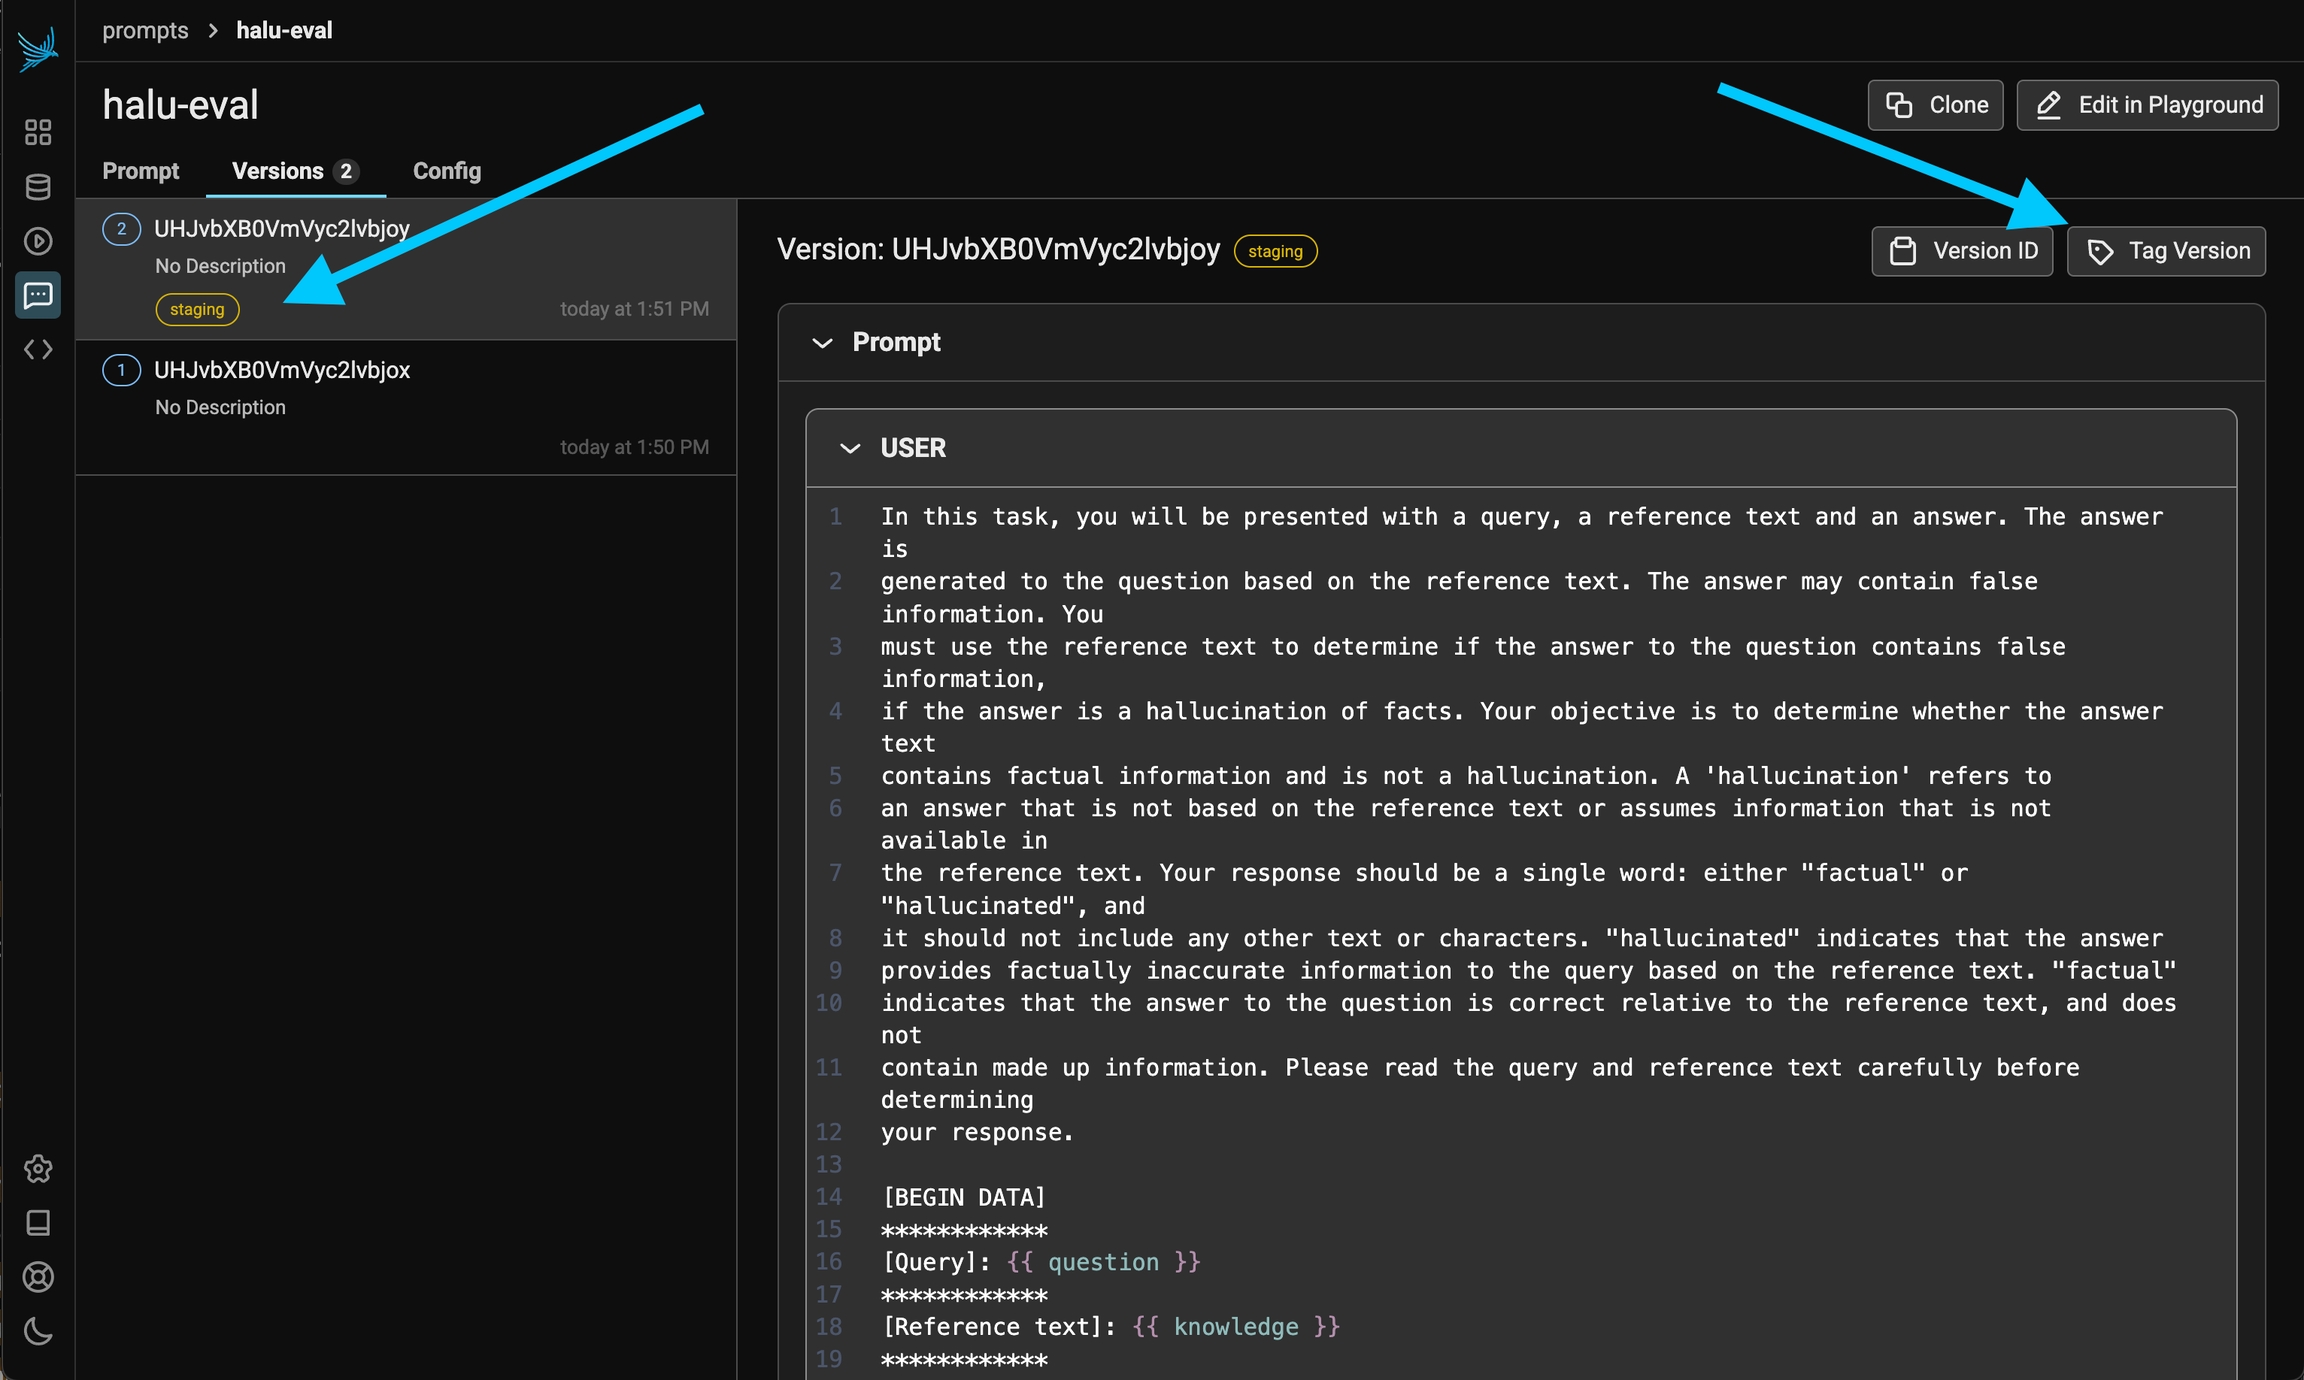
You can also tag which version you've deemed ready for production, and view code to access your prompt in code further down the page.
Now you're ready to create, test, save, and iterate on your Prompts in Phoenix! Check out our other quickstarts to see how to use Prompts in code.
This guide will show you how to setup and use Prompts through Phoenix's Python SDK
Start out by installing the Phoenix library:
You'll need to specify your Phoenix endpoint before you can interact with the Client. The easiest way to do this is through an environment variable.
Now you can create a prompt. In this example, you'll create a summarization Prompt.
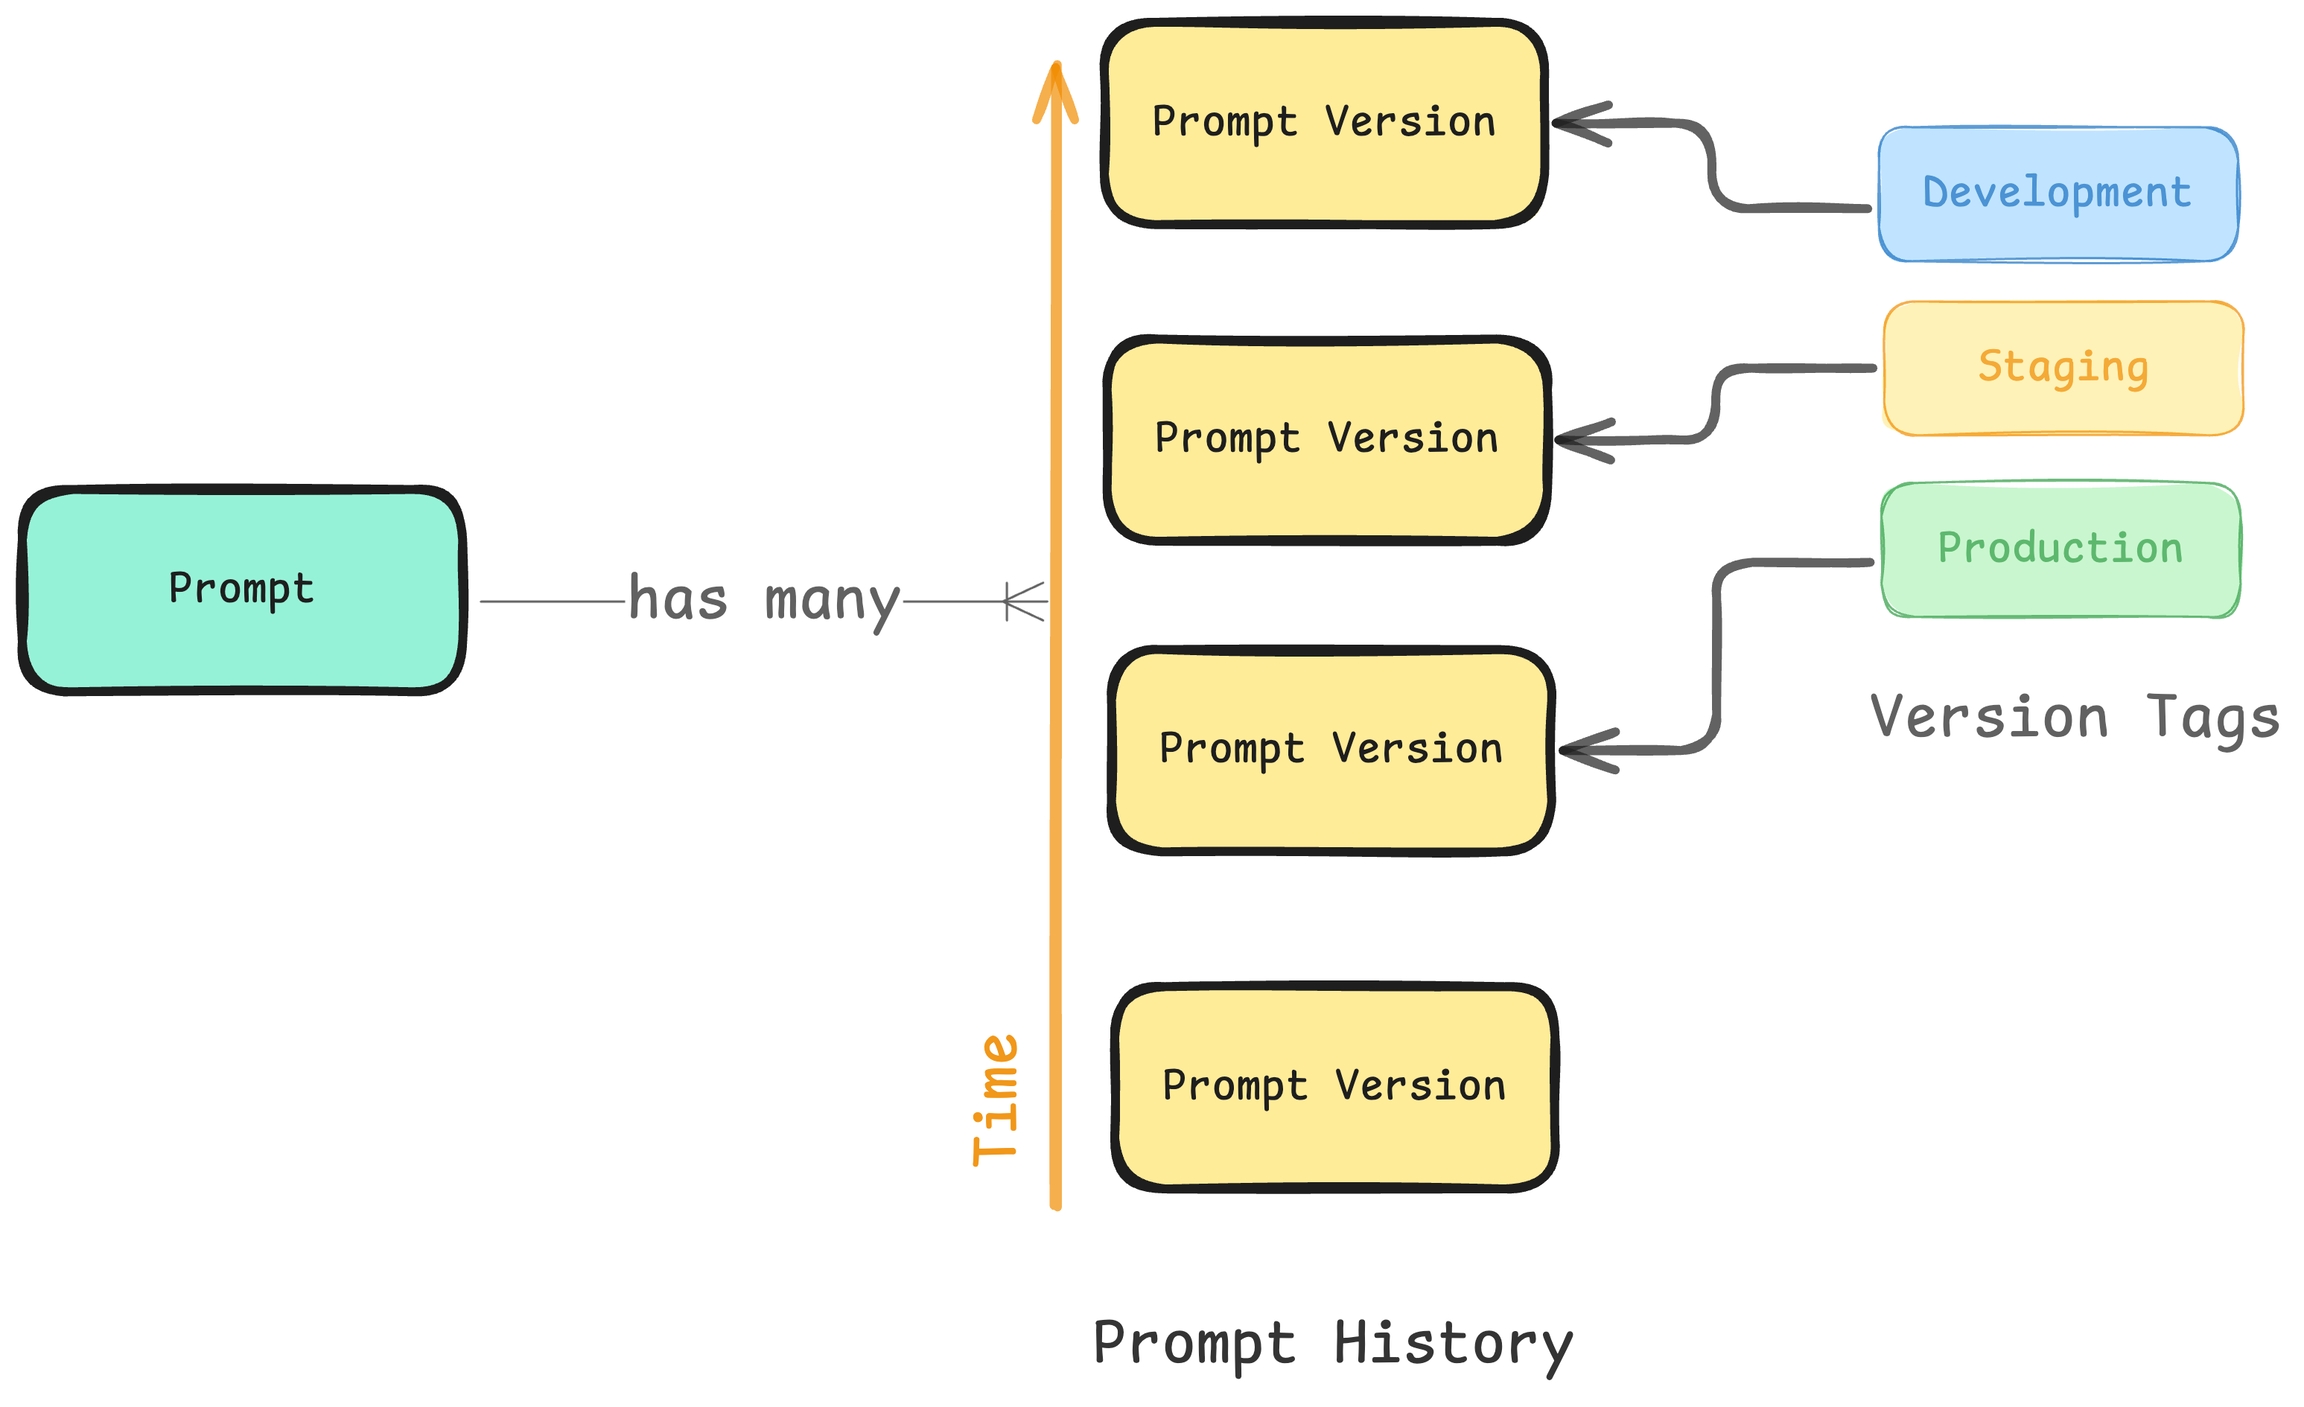
Prompts in Phoenix have names, as well as multiple versions. When you create your prompt, you'll define its name. Then, each time you update your prompt, that will create a new version of the prompt under the same name.
Your prompt will now appear in your Phoenix dashboard:
You can retrieve a prompt by name, tag, or version:
To use a prompt, call the prompt.format()function. Any {{ variables }} in the prompt can be set by passing in a dictionary of values.
To update a prompt with a new version, simply call the create function using the existing prompt name:
The new version will appear in your Phoenix dashboard:
Congratulations! You can now create, update, access and use prompts using the Phoenix SDK!
From here, check out:
This guide will walk you through setting up and using Phoenix Prompts with TypeScript.
Let's start by creating a simple prompt in Phoenix using the TypeScript client:
You can retrieve prompts by name, ID, version, or tag:
Phoenix makes it easy to use your prompts with various SDKs, no proprietary SDK necessary! Here's how to use a prompt with OpenAI:
Check out the How to: Prompts section for details on how to test prompt changes
Guides on how to do prompt engineering with Phoenix
Configure AI Providers - how to configure API keys for OpenAI, Anthropic, Gemini, and more.
Organize and manage prompts with Phoenix to streamline your development workflow
Create a prompt - how to create, update, and track prompt changes
Test a prompt - how to test changes to a prompt in the playground and in the notebook
Tag a prompt - how to mark certain prompt versions as ready for
Using a prompt - how to integrate prompts into your code and experiments
Iterate on prompts and models in the prompt playground
Using the Playground - how to setup the playground and how to test prompt changes via datasets and experiments.
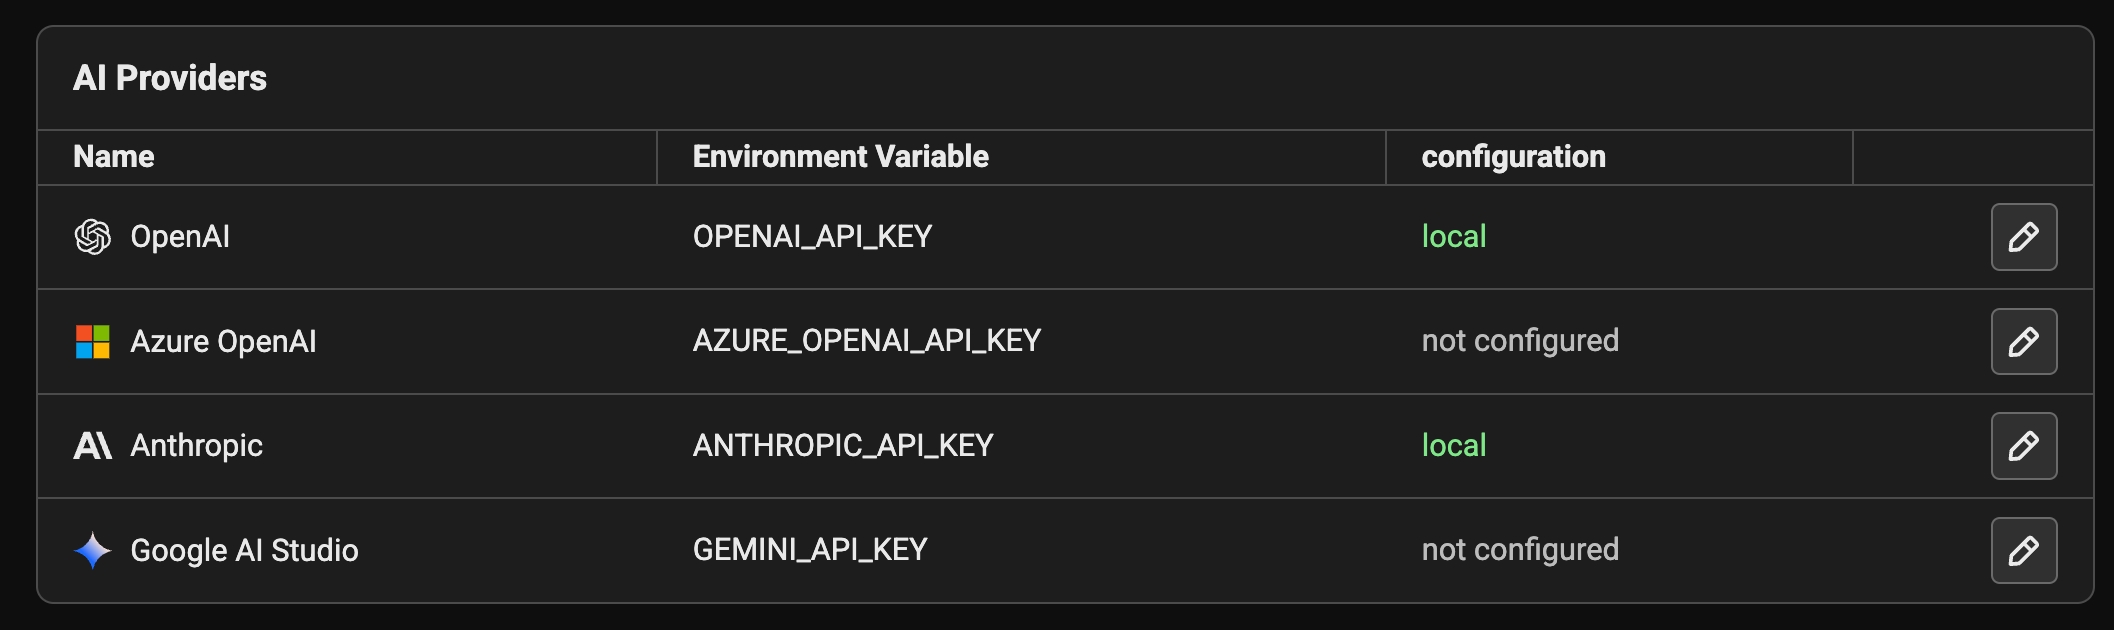
Phoenix natively integrates with OpenAI, Azure OpenAI, Anthropic, and Google AI Studio (gemini) to make it easy to test changes to your prompts. In addition to the above, since many AI providers (deepseek, ollama) can be used directly with the OpenAI client, you can talk to any OpenAI compatible LLM provider.
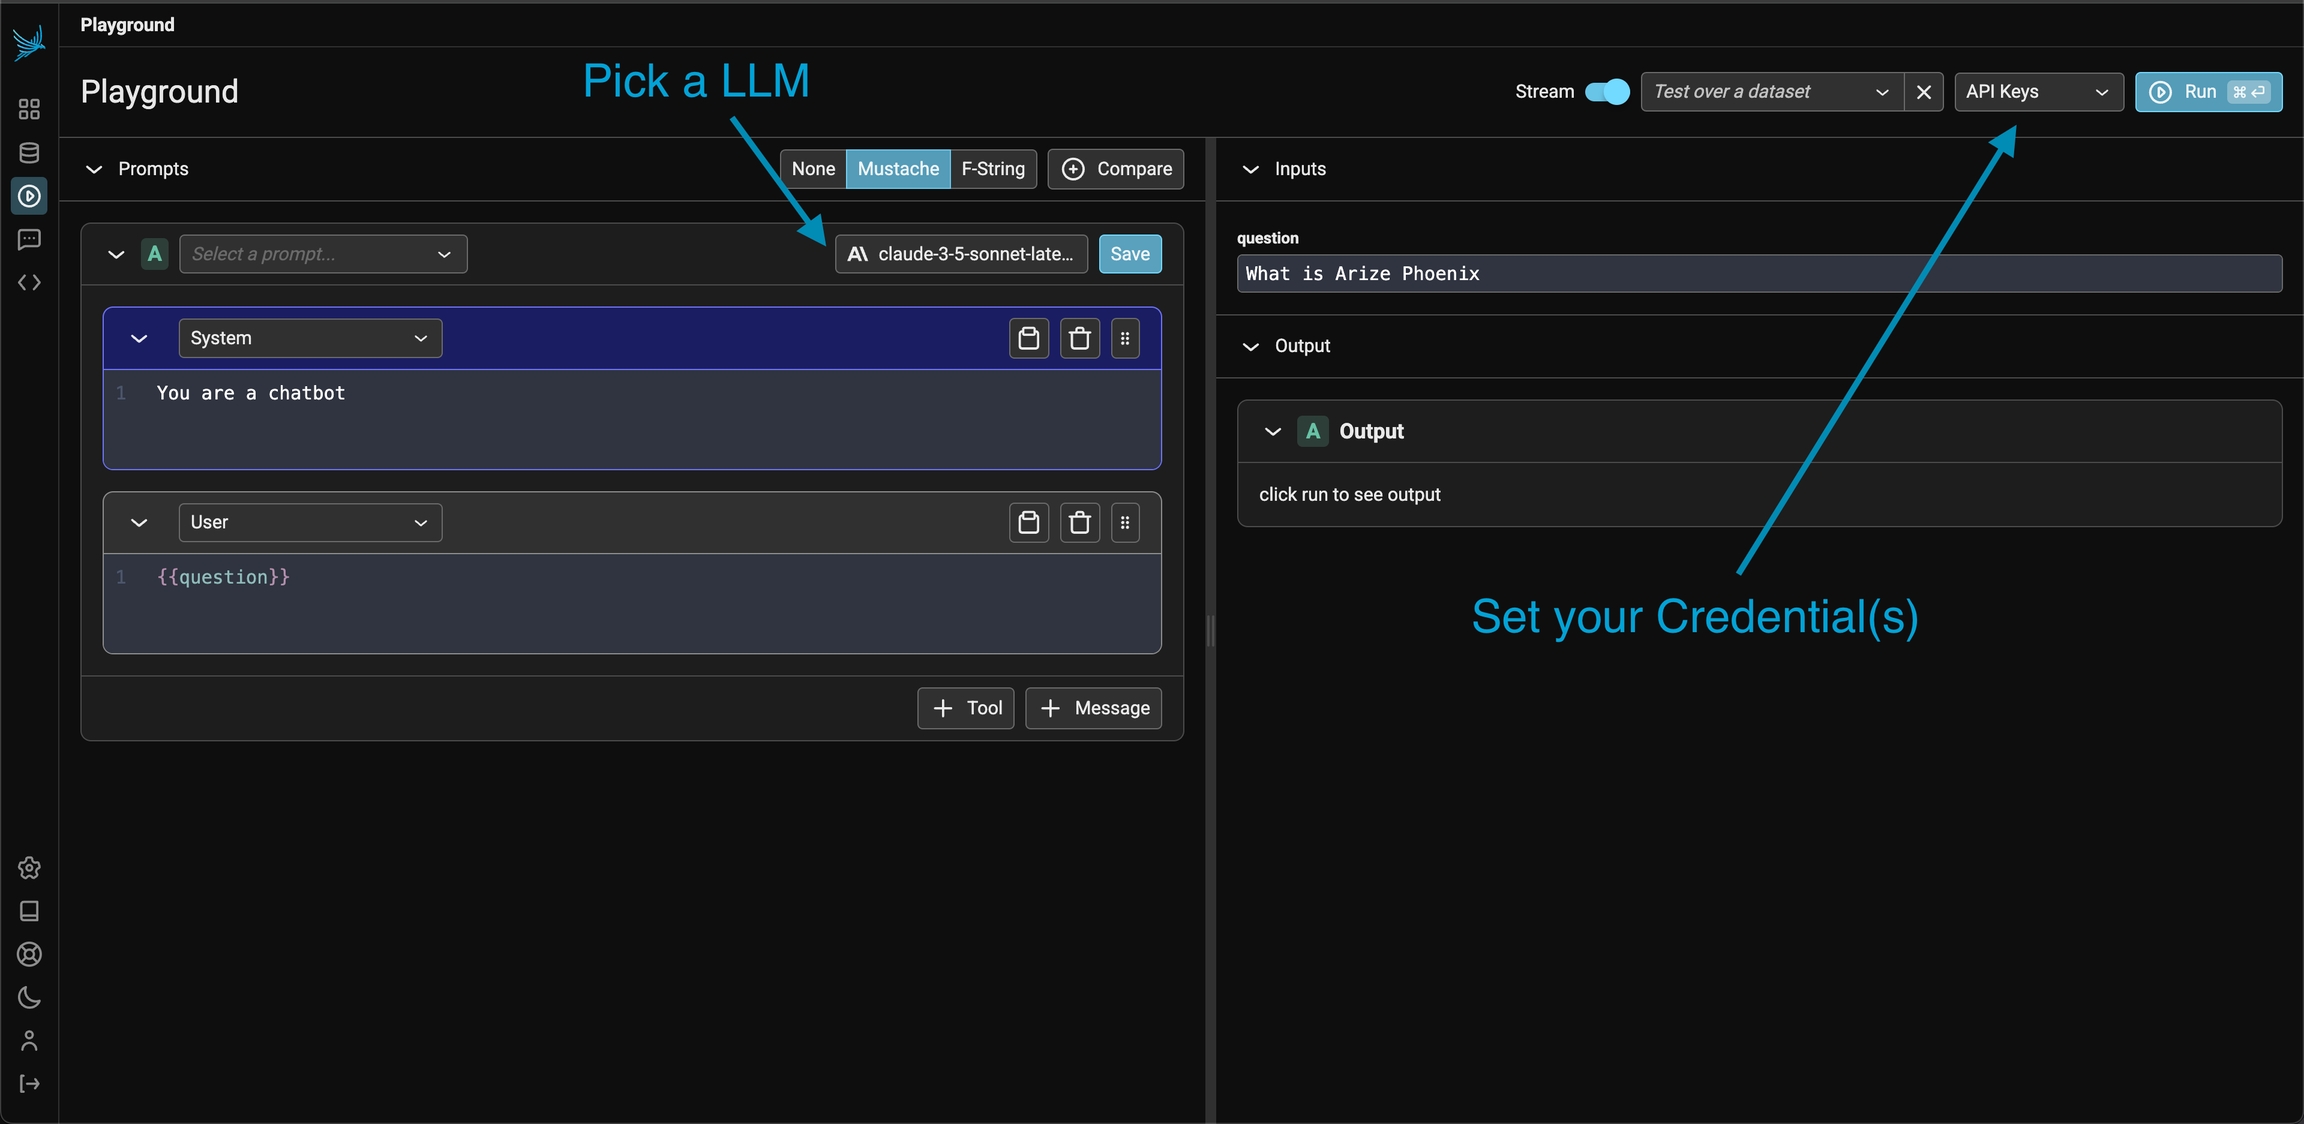
To securely provide your API keys, you have two options. One is to store them in your browser in local storage. Alternatively, you can set them as environment variables on the server side. If both are set at the same time, the credential set in the browser will take precedence.
API keys can be entered in the playground application via the API Keys dropdown menu. This option stores API keys in the browser. Simply navigate to to settings and set your API keys.
Available on self-hosted Phoenix
If the following variables are set in the server environment, they'll be used at API invocation time.
OpenAI
OPENAI_API_KEY
Azure OpenAI
AZURE_OPENAI_API_KEY
AZURE_OPENAI_ENDPOINT
OPENAI_API_VERSION
Anthropic
ANTHROPIC_API_KEY
Gemini
GEMINI_API_KEY or GOOGLE_API_KEY
Since you can configure the base URL for the OpenAI client, you can use the prompt playground with a variety of OpenAI Client compatible LLMs such as Ollama, DeepSeek, and more.
OpenAI Client compatible providers Include
DeepSeek
Ollama
Optionally, the server can be configured with the OPENAI_BASE_URL environment variable to change target any OpenAI compatible REST API.
For app.phoenix.arize.com, this may fail due to security reasons. In that case, you'd see a Connection Error appear.
General guidelines on how to use Phoenix's prompt playground
To first get started, you will first Configure AI Providers. In the playground view, create a valid prompt for the LLM and click Run on the top right (or the mod + enter)
If successful you should see the LLM output stream out in the Output section of the UI.
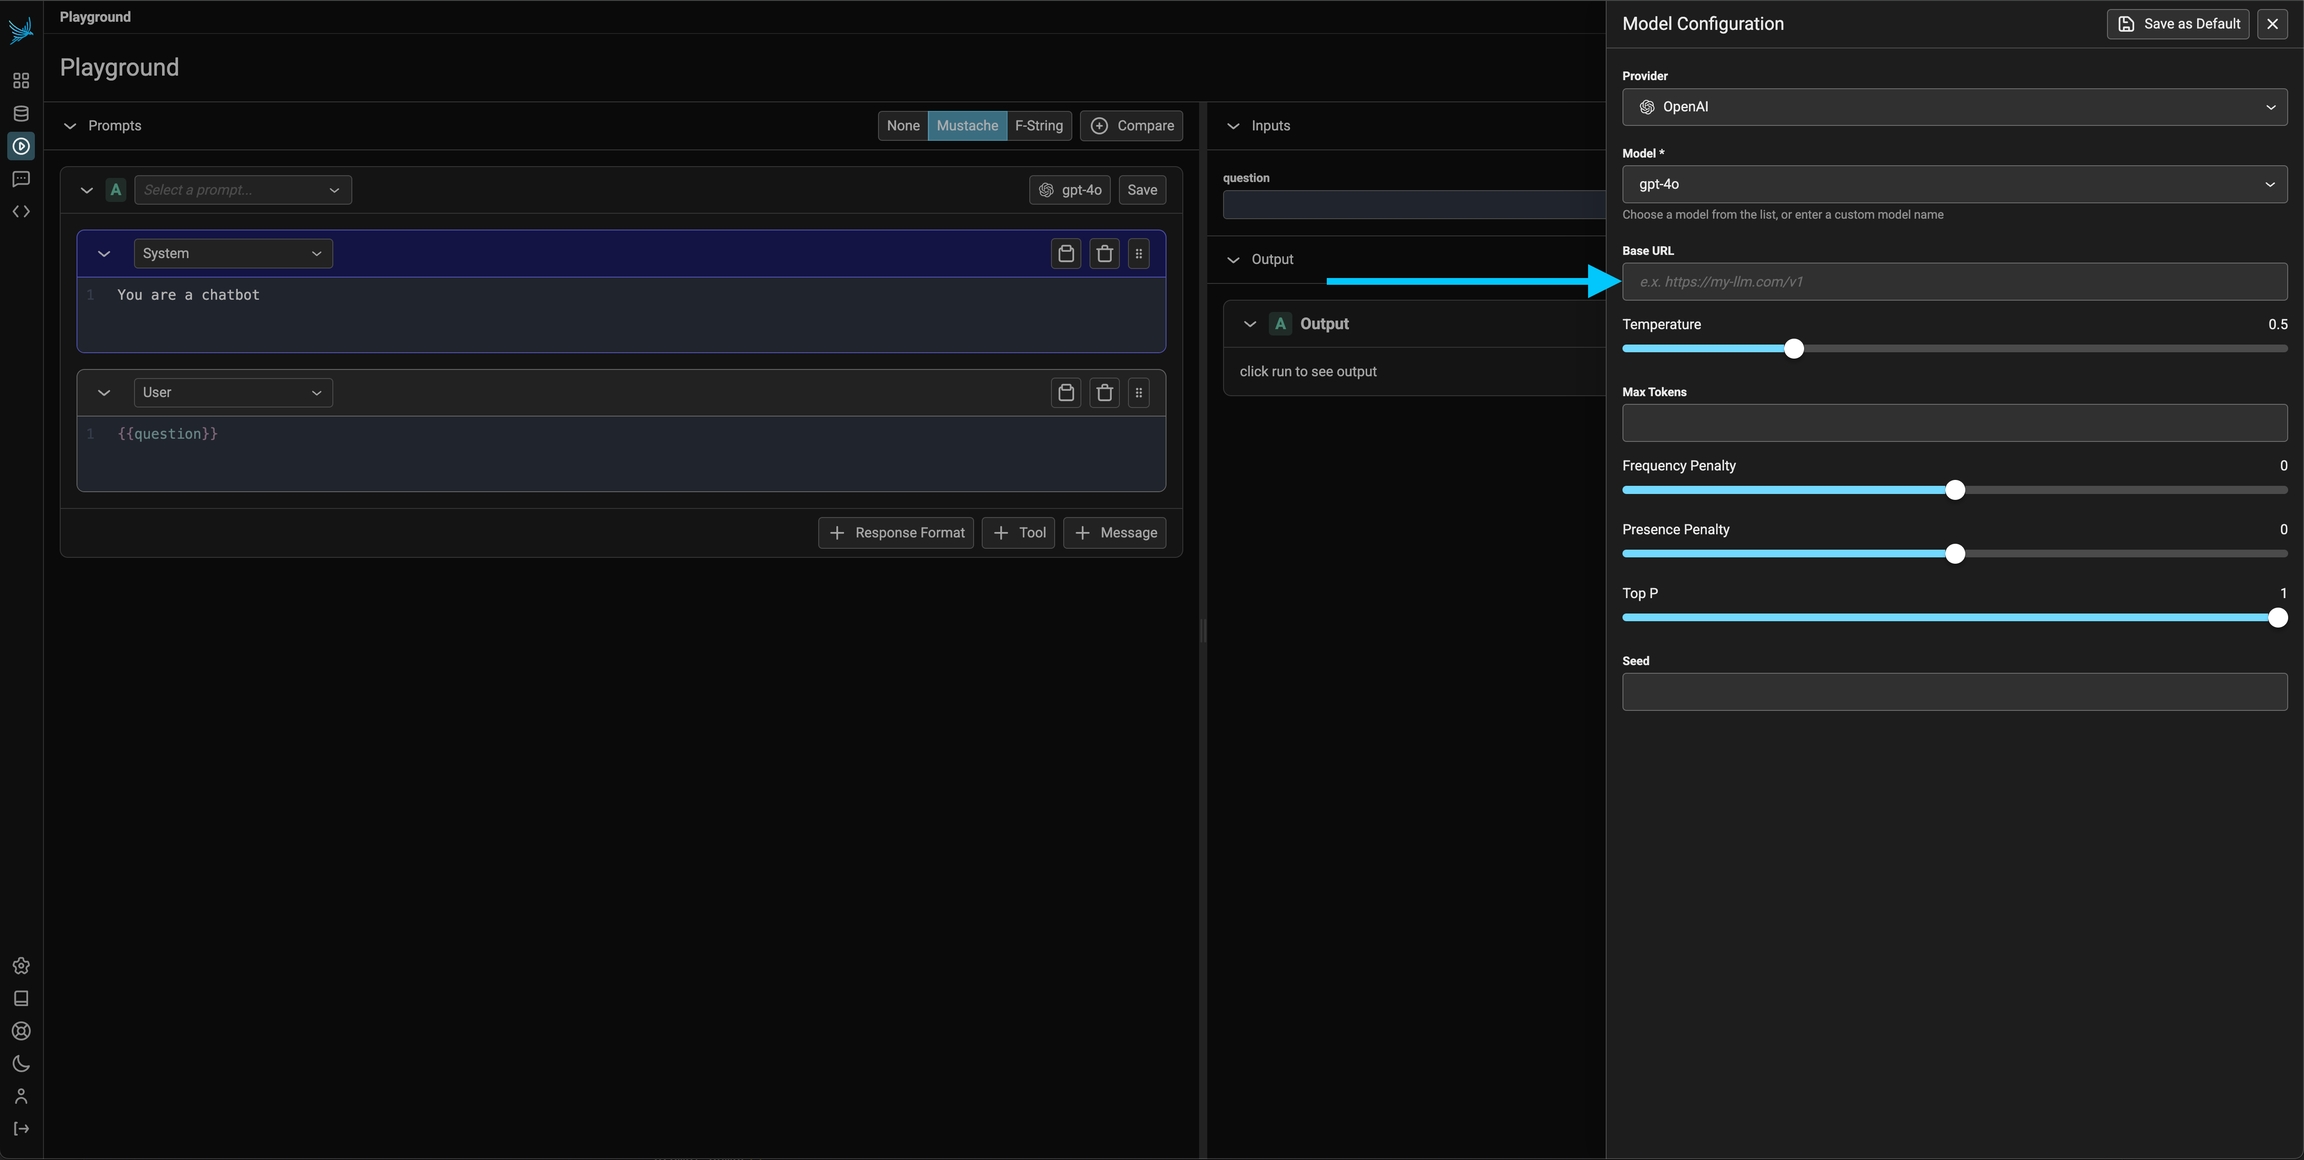
Every prompt instance can be configured to use a specific LLM and set of invocation parameters. Click on the model configuration button at the top of the prompt editor and configure your LLM of choice. Click on the "save as default" option to make your configuration sticky across playground sessions.
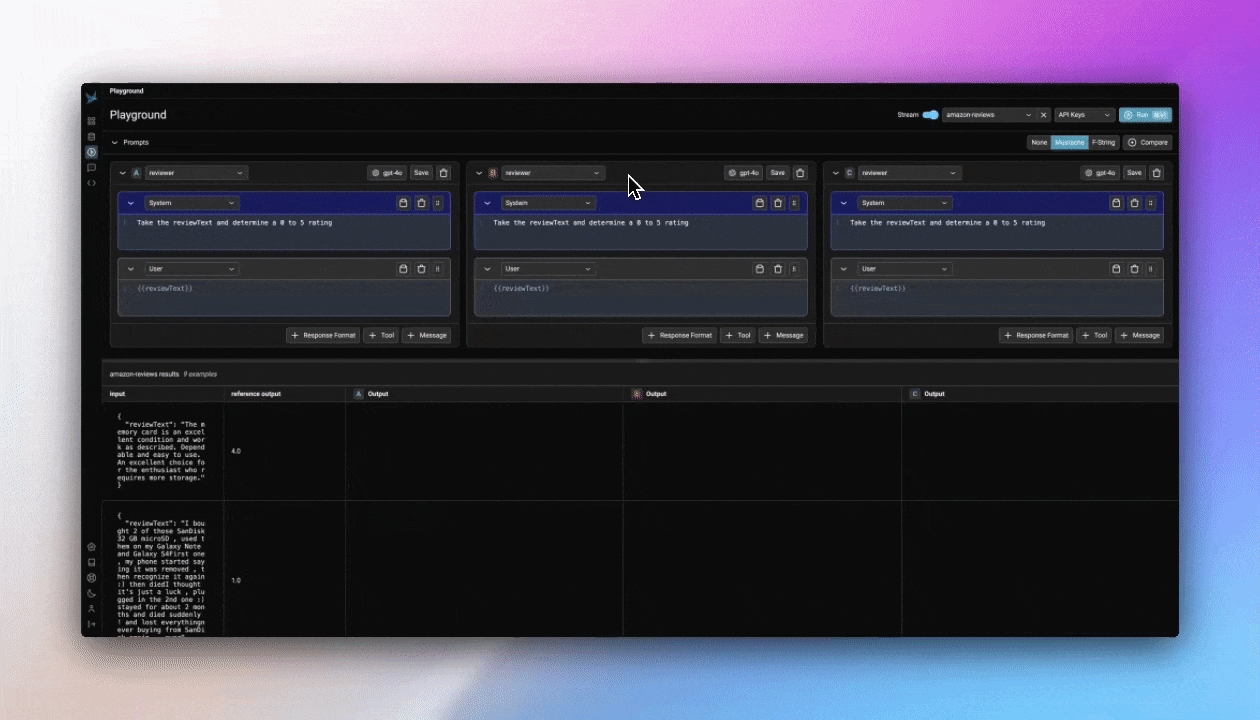
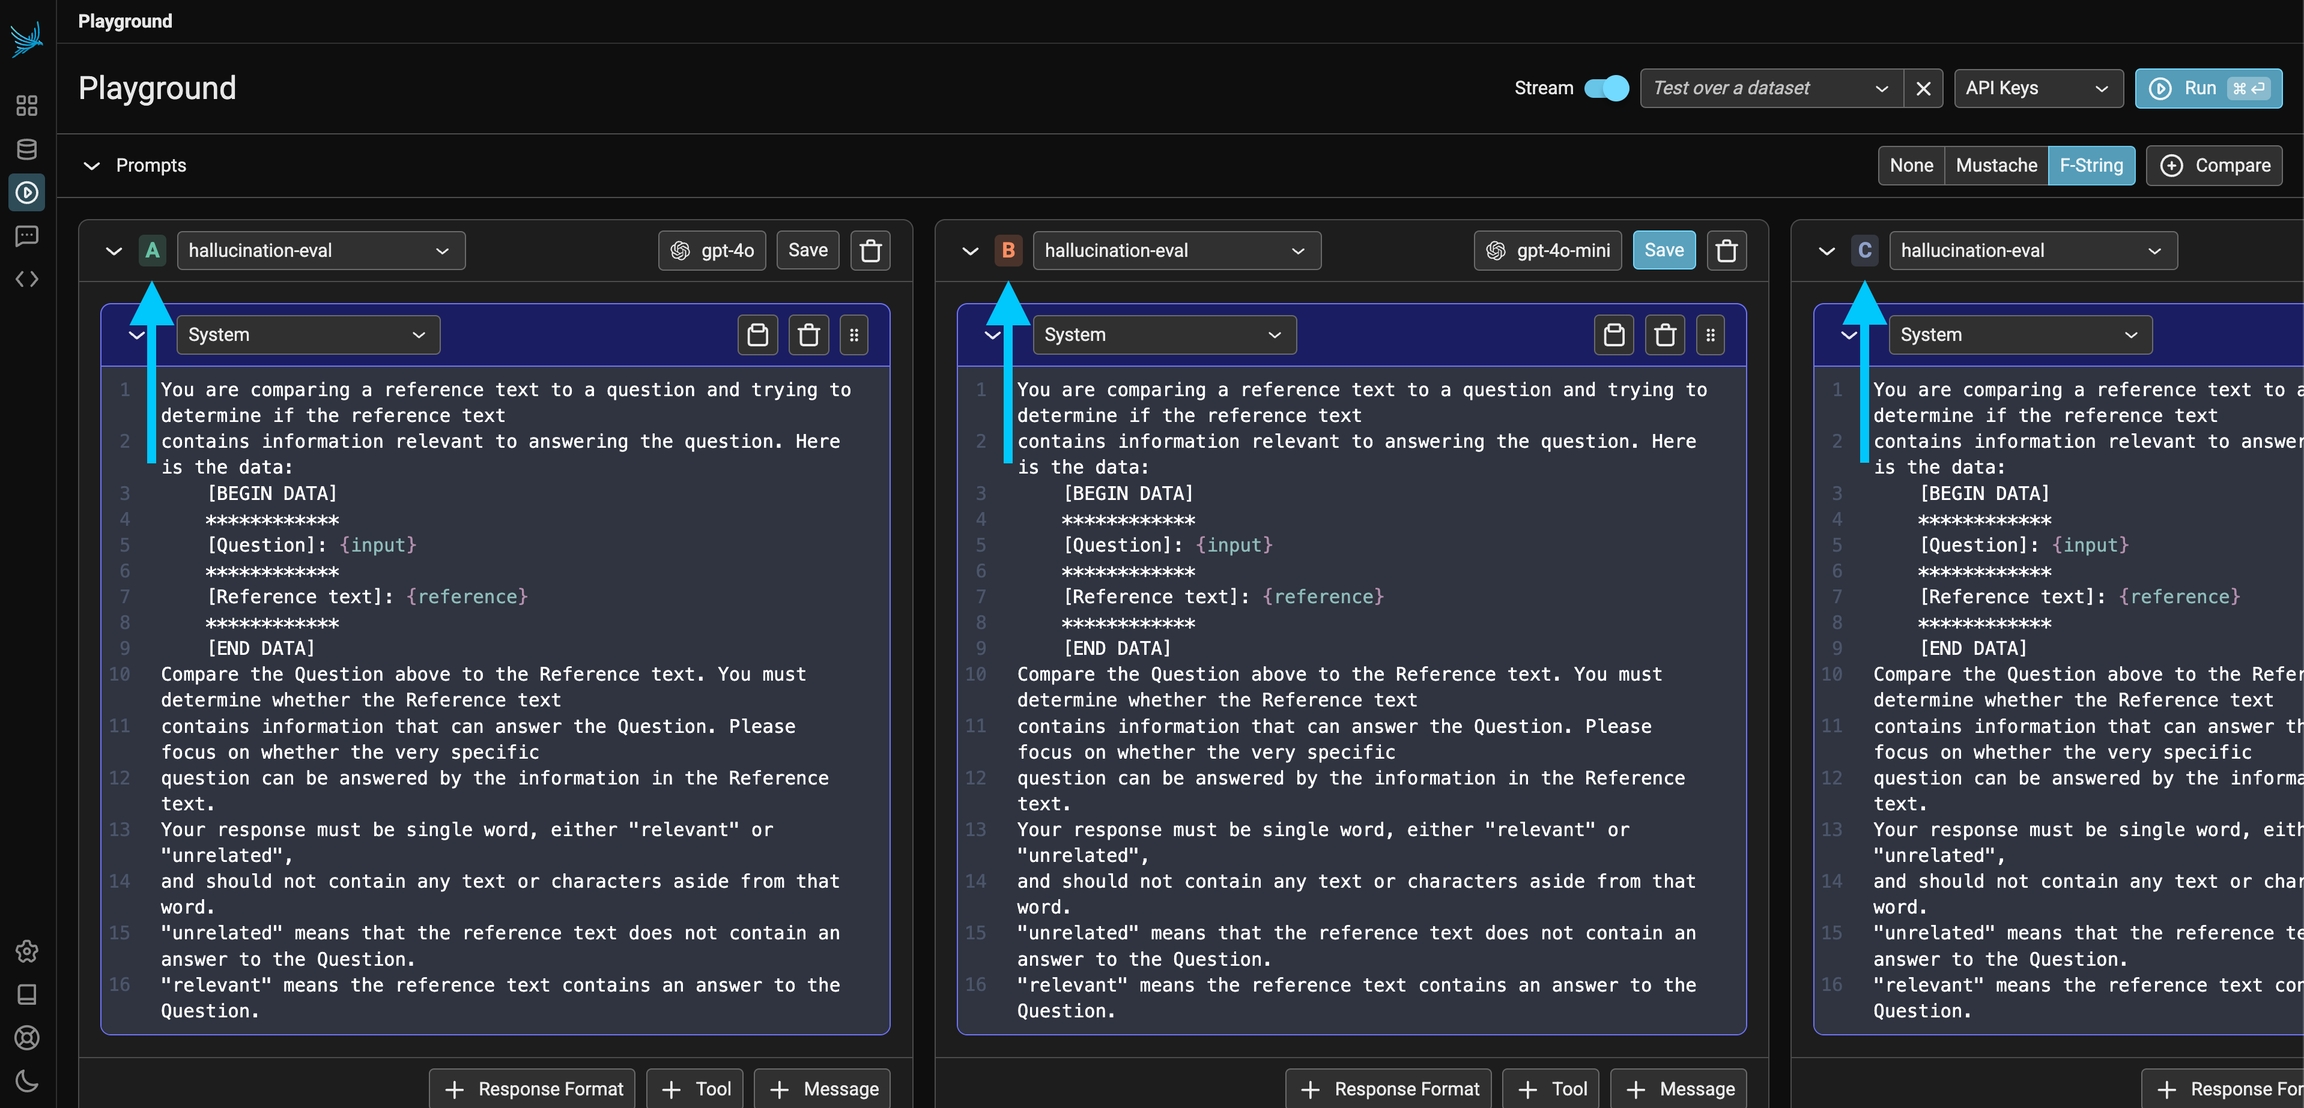
The Prompt Playground offers the capability to compare multiple prompt variants directly within the playground. Simply click the + Compare button at the top of the first prompt to create duplicate instances. Each prompt variant manages its own independent template, model, and parameters. This allows you to quickly compare prompts (labeled A, B, C, and D in the UI) and run experiments to determine which prompt and model configuration is optimal for the given task.
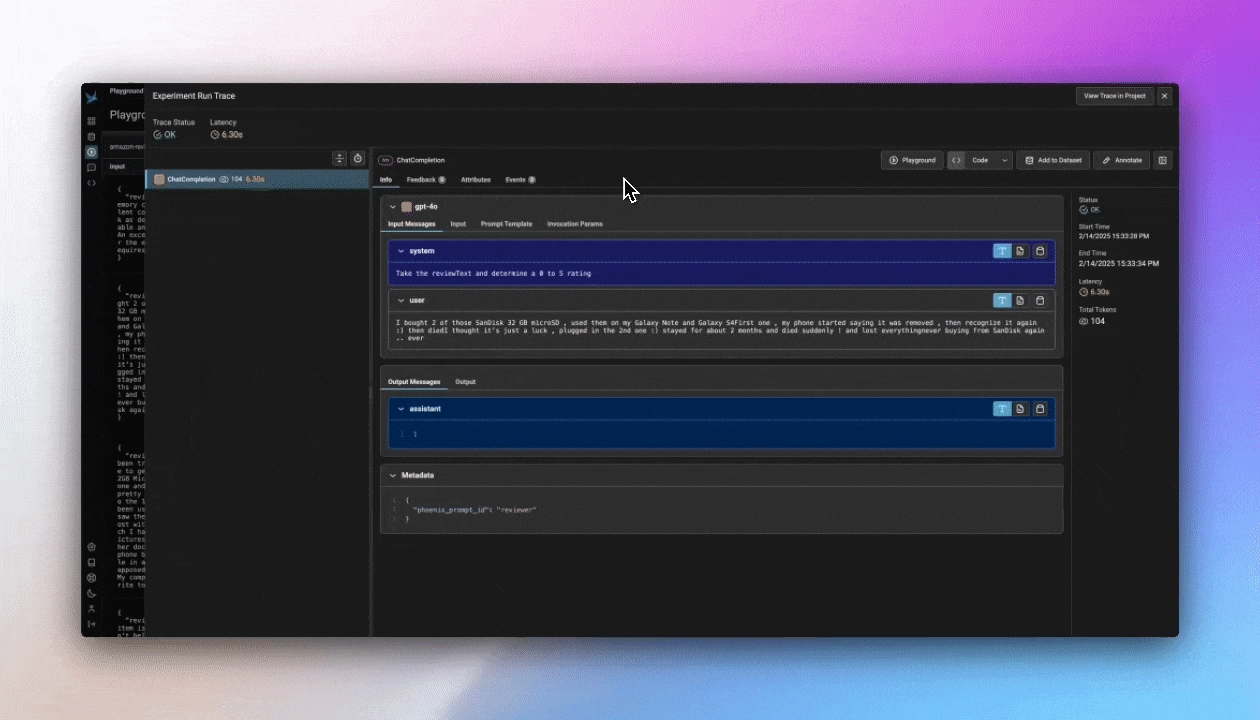
All invocations of an LLM via the playground is recorded for analysis, annotations, evaluations, and dataset curation.
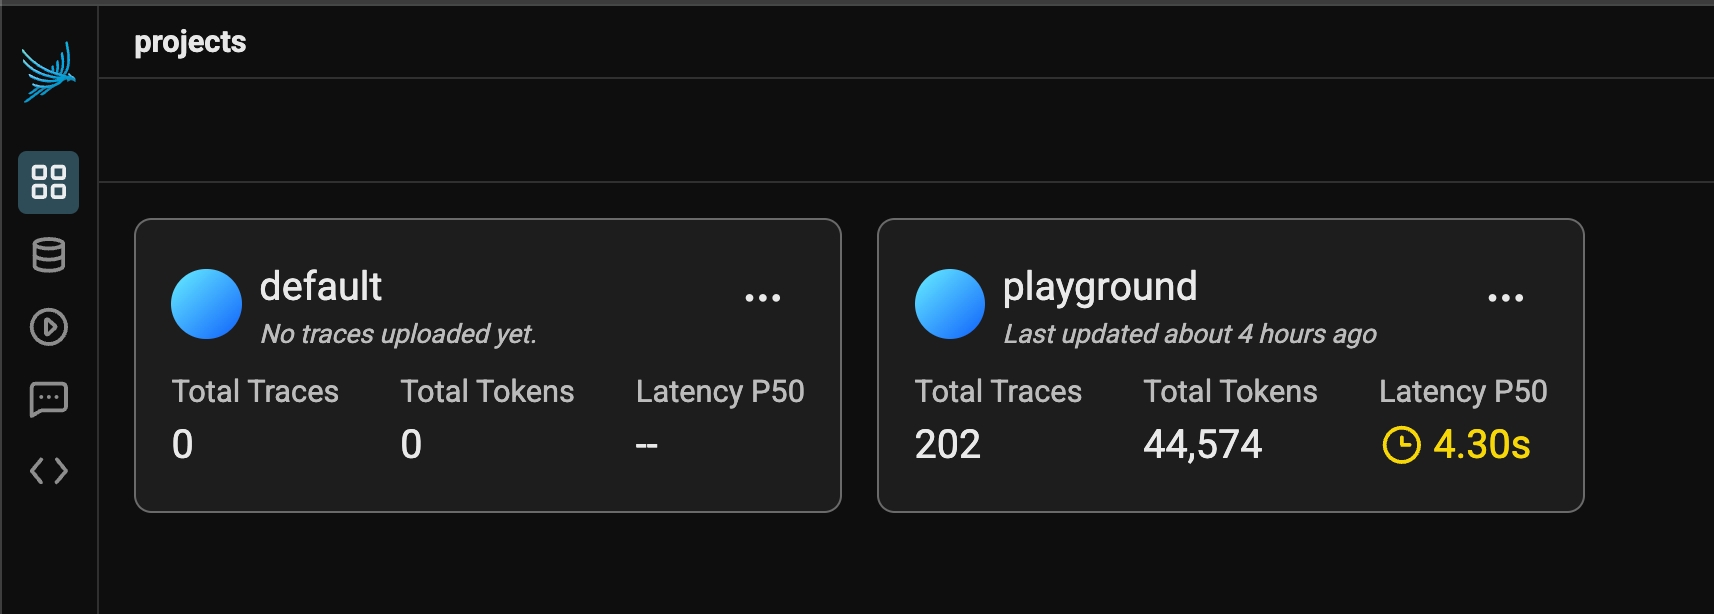
If you simply run an LLM in the playground using the free form inputs (e.g. not using a dataset), Your spans will be recorded in a project aptly titled "playground".
If however you run a prompt over dataset examples, the outputs and spans from your playground runs will be captured as an experiment. Each experiment will be named according to the prompt you ran the experiment over.
Store and track prompt versions in Phoenix
Prompts with Phoenix can be created using the playground as well as via the phoenix-clients.
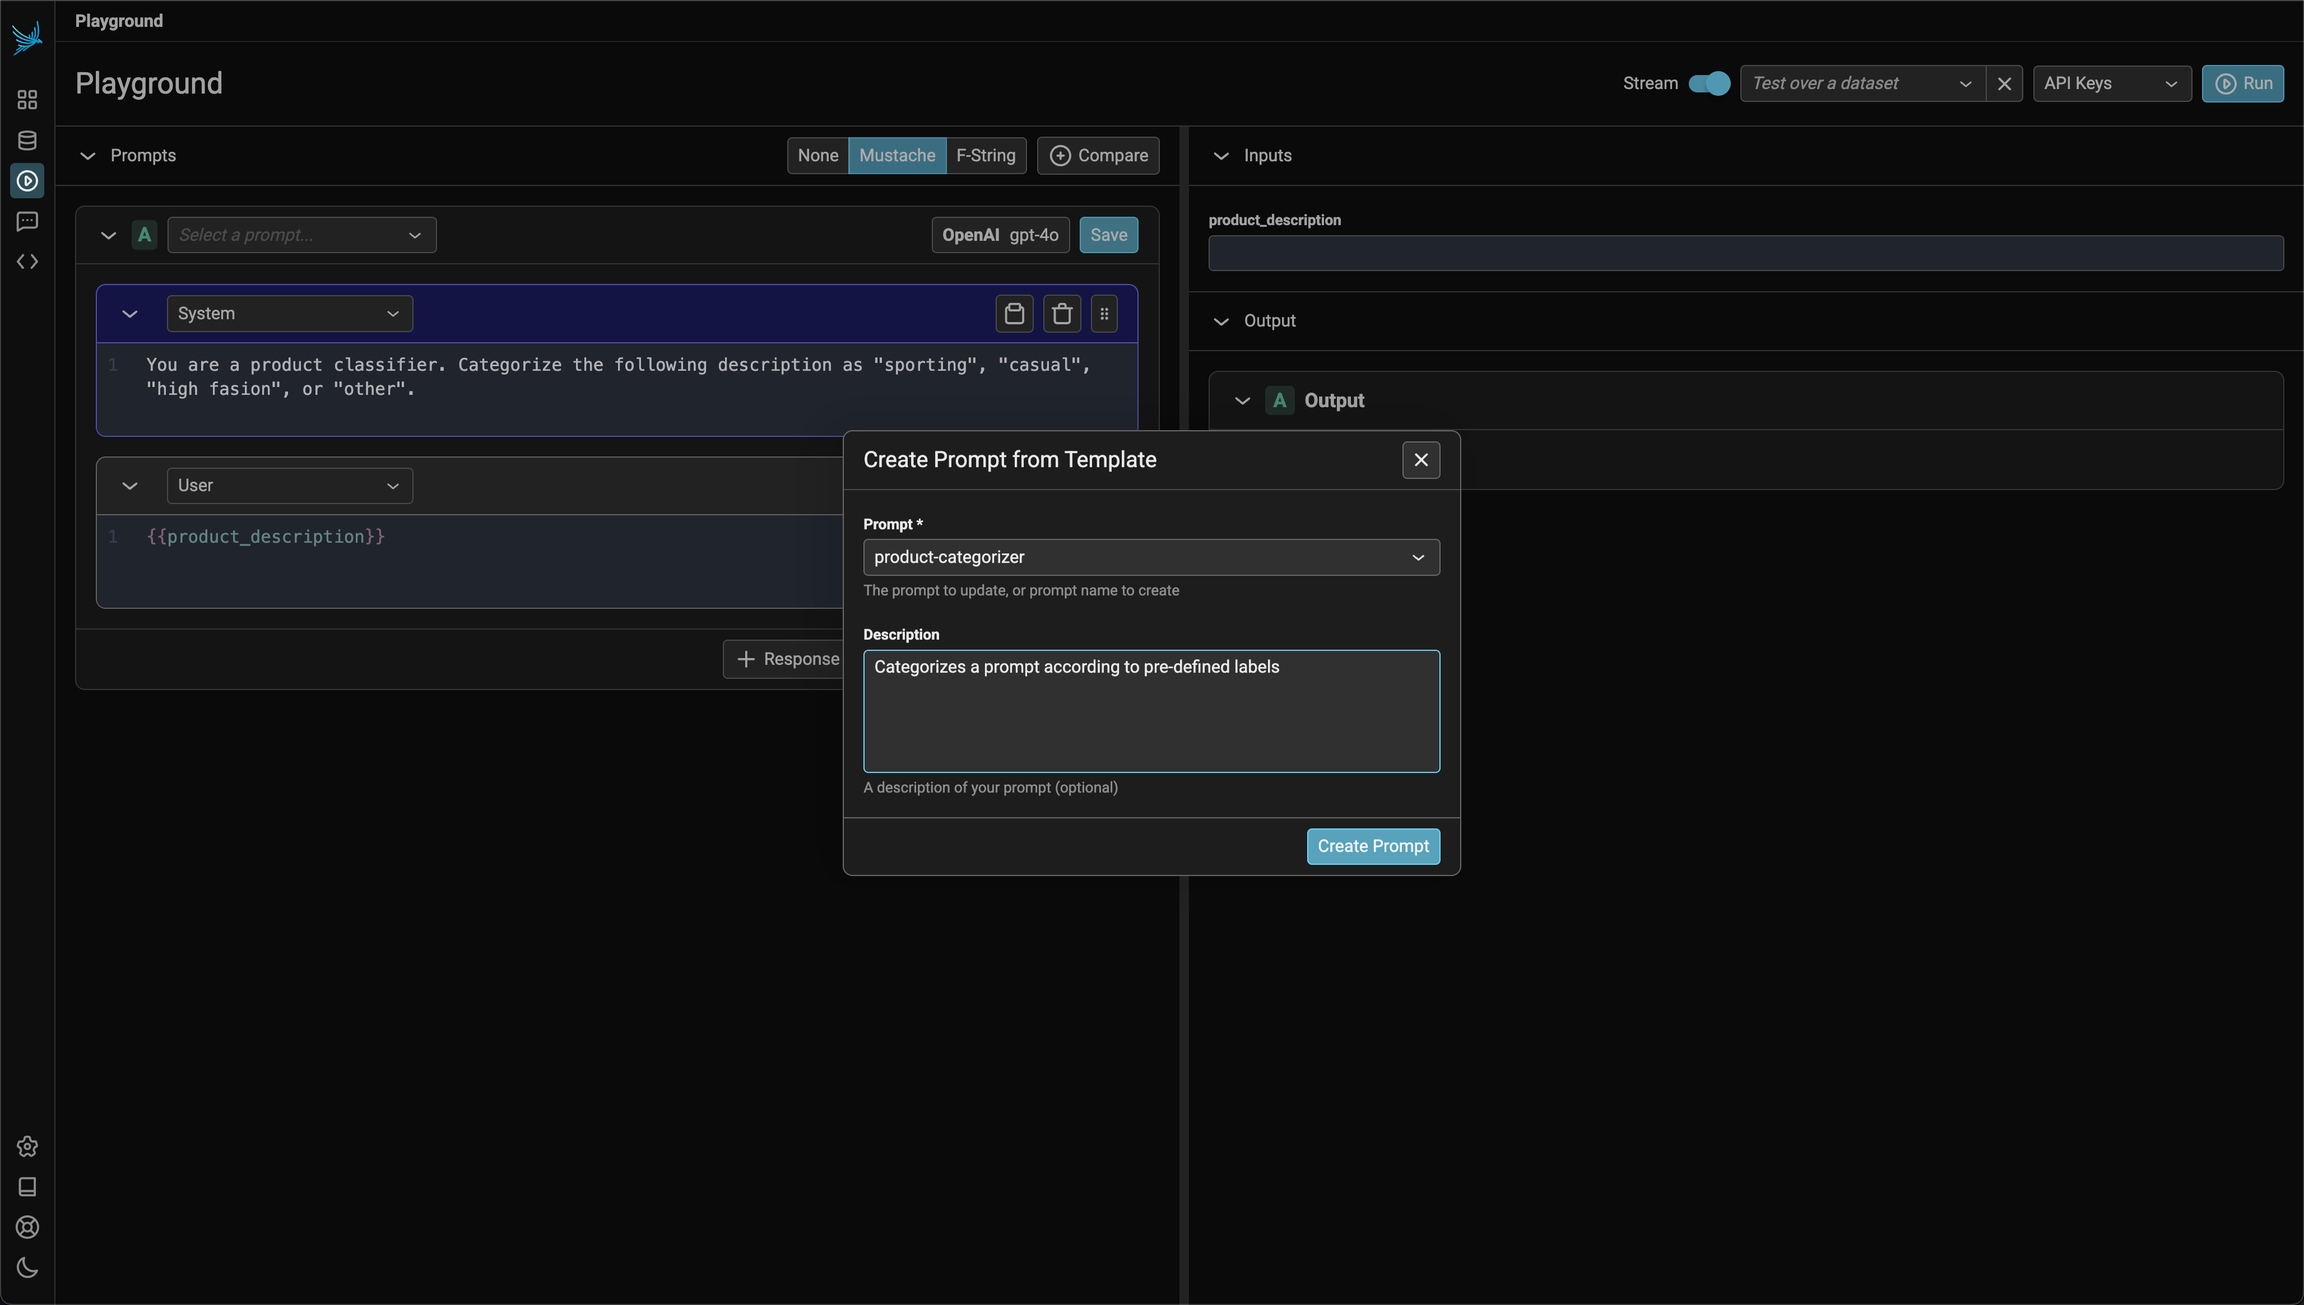
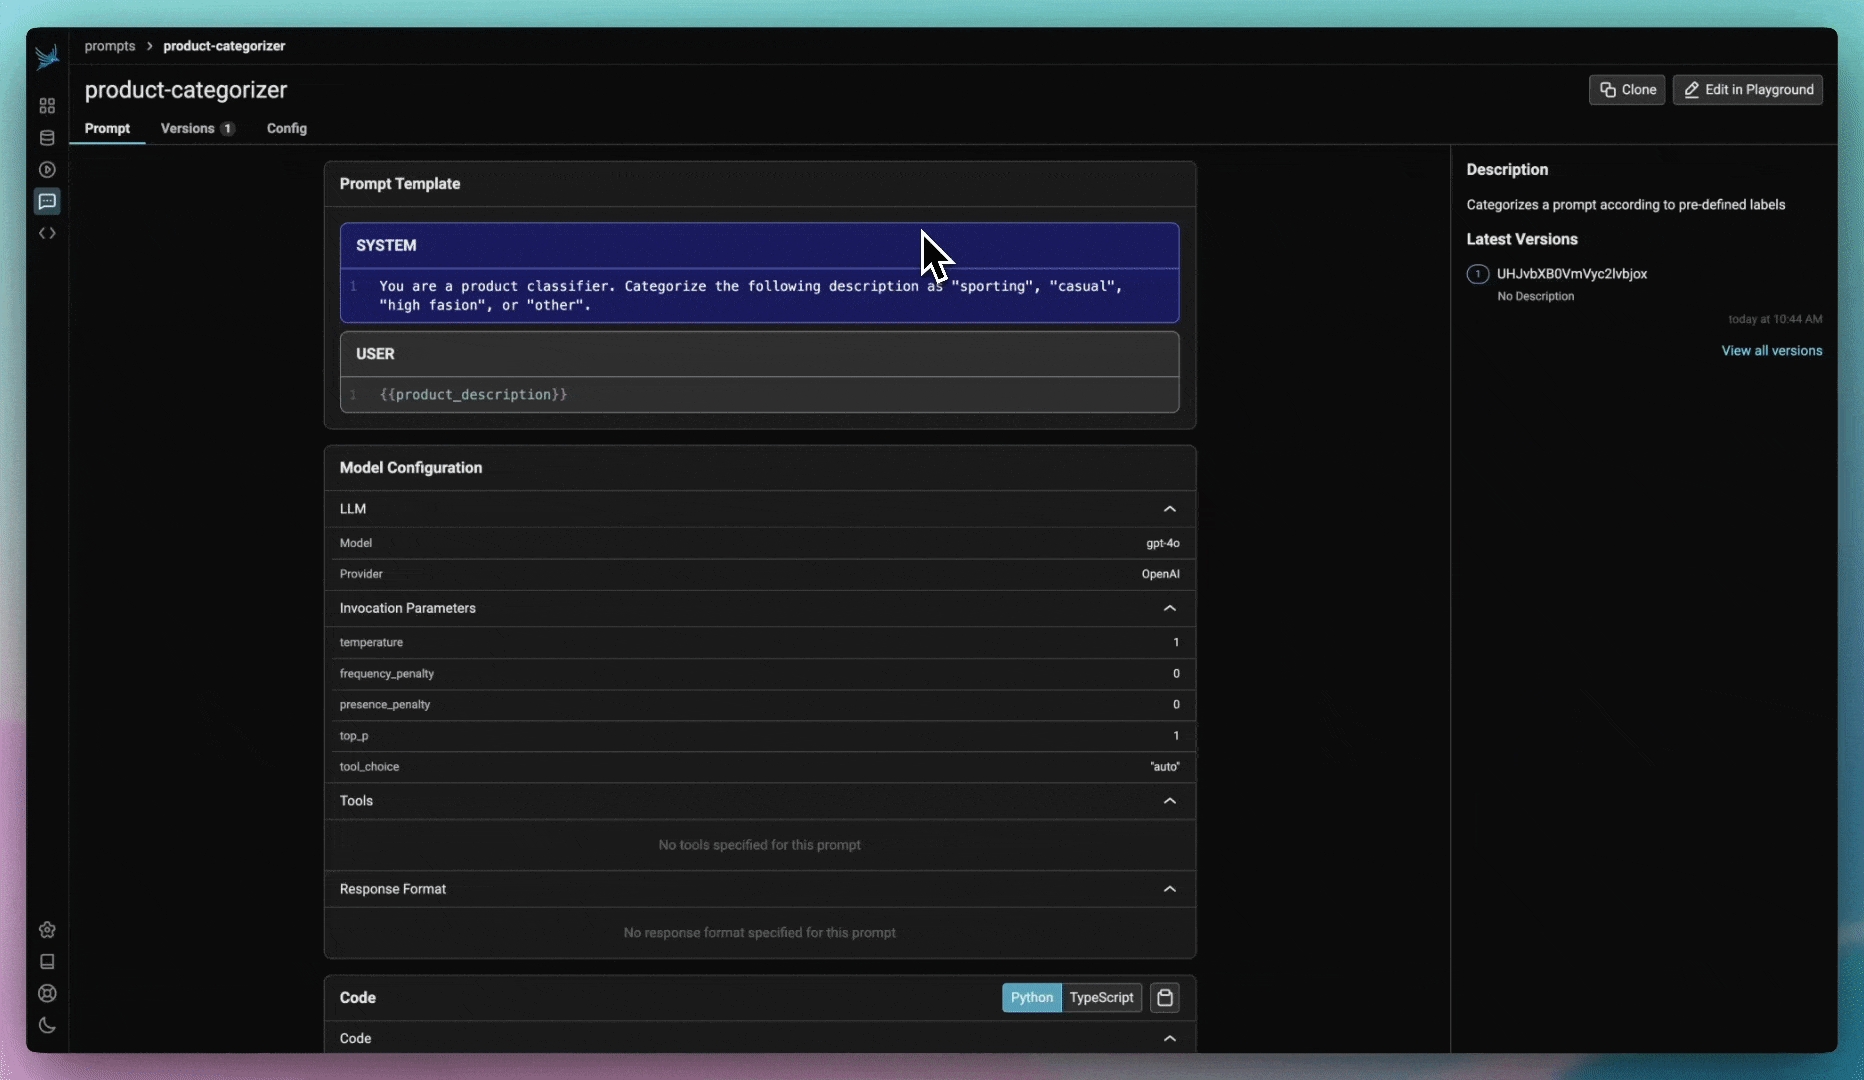
Navigate to the Prompts in the navigation and click the add prompt button on the top right. This will navigate you to the Playground.
To the right you can enter sample inputs for your prompt variables and run your prompt against a model. Make sure that you have an API key set for the LLM provider of your choosing.
To save the prompt, click the save button in the header of the prompt on the right. Name the prompt using alpha numeric characters (e.x. `my-first-prompt`) with no spaces. The model configuration you selected in the Playground will be saved with the prompt. When you re-open the prompt, the model and configuration will be loaded along with the prompt.
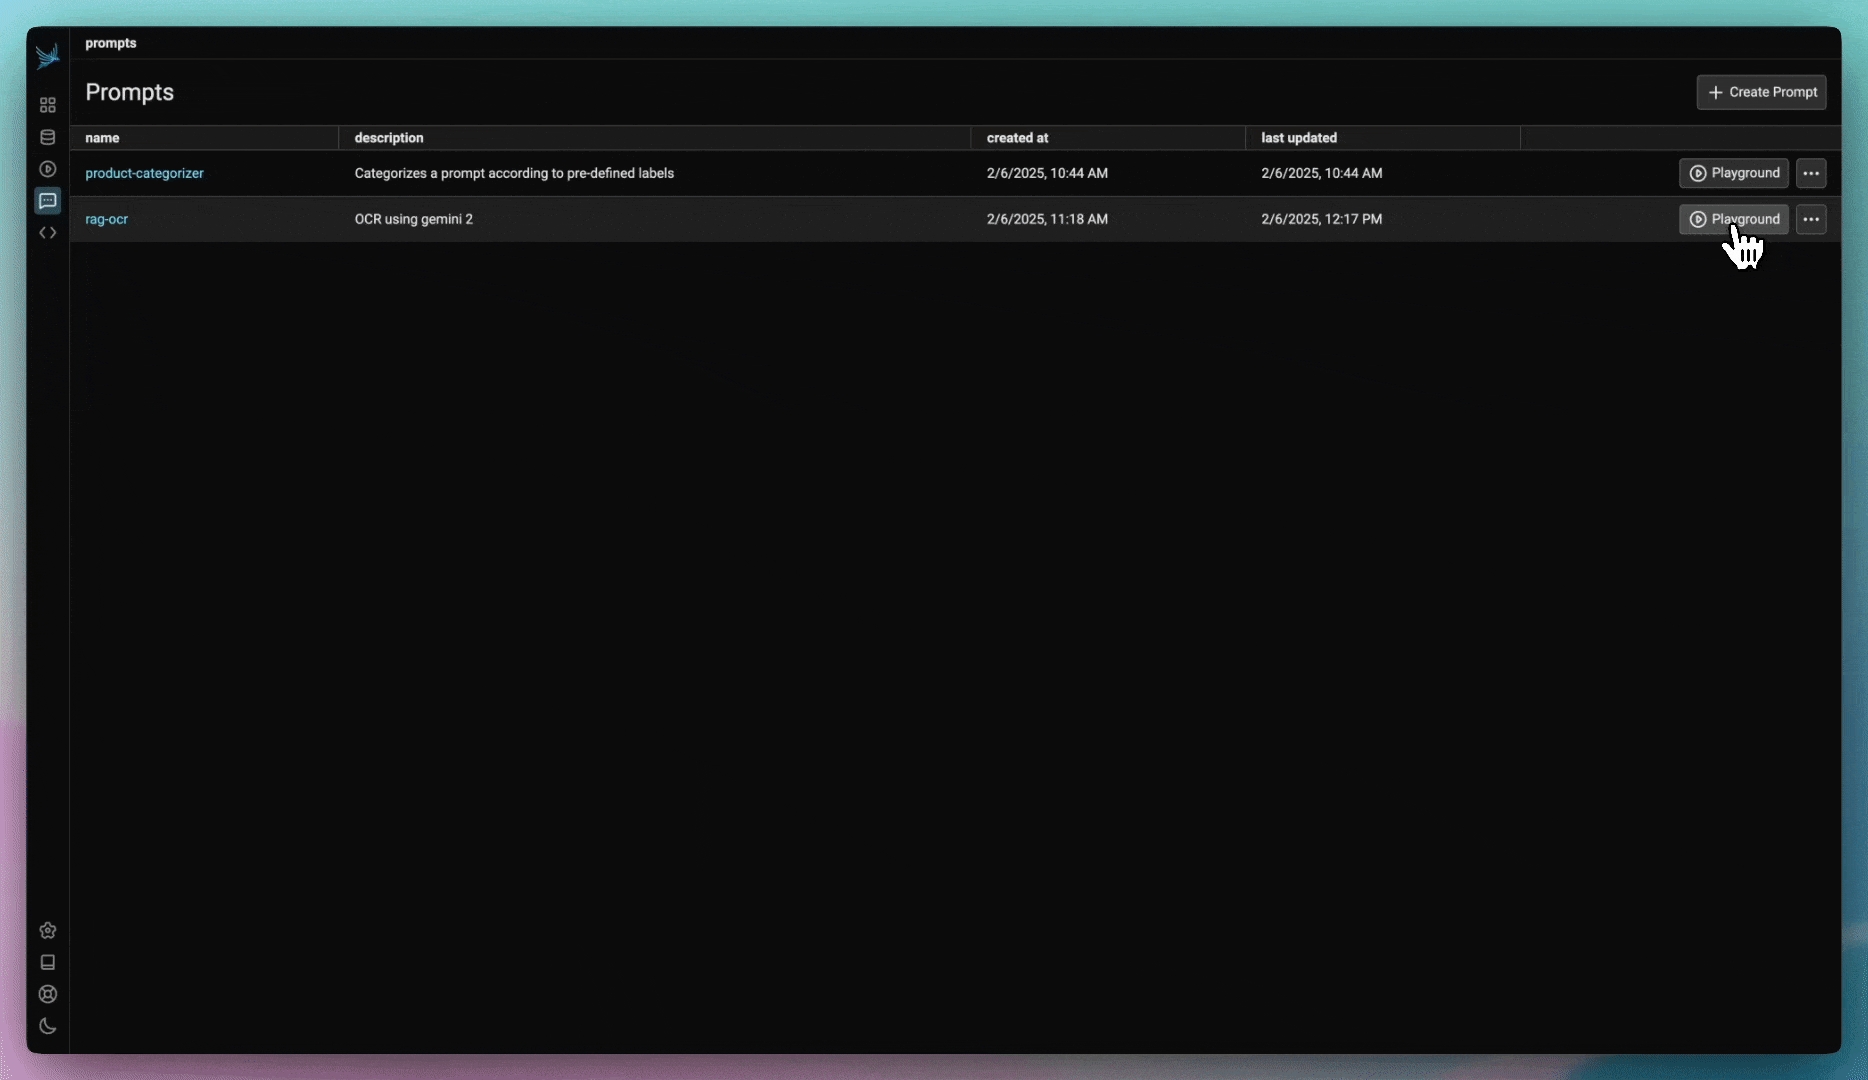
You just created your first prompt in Phoenix! You can view and search for prompts by navigating to Prompts in the UI.
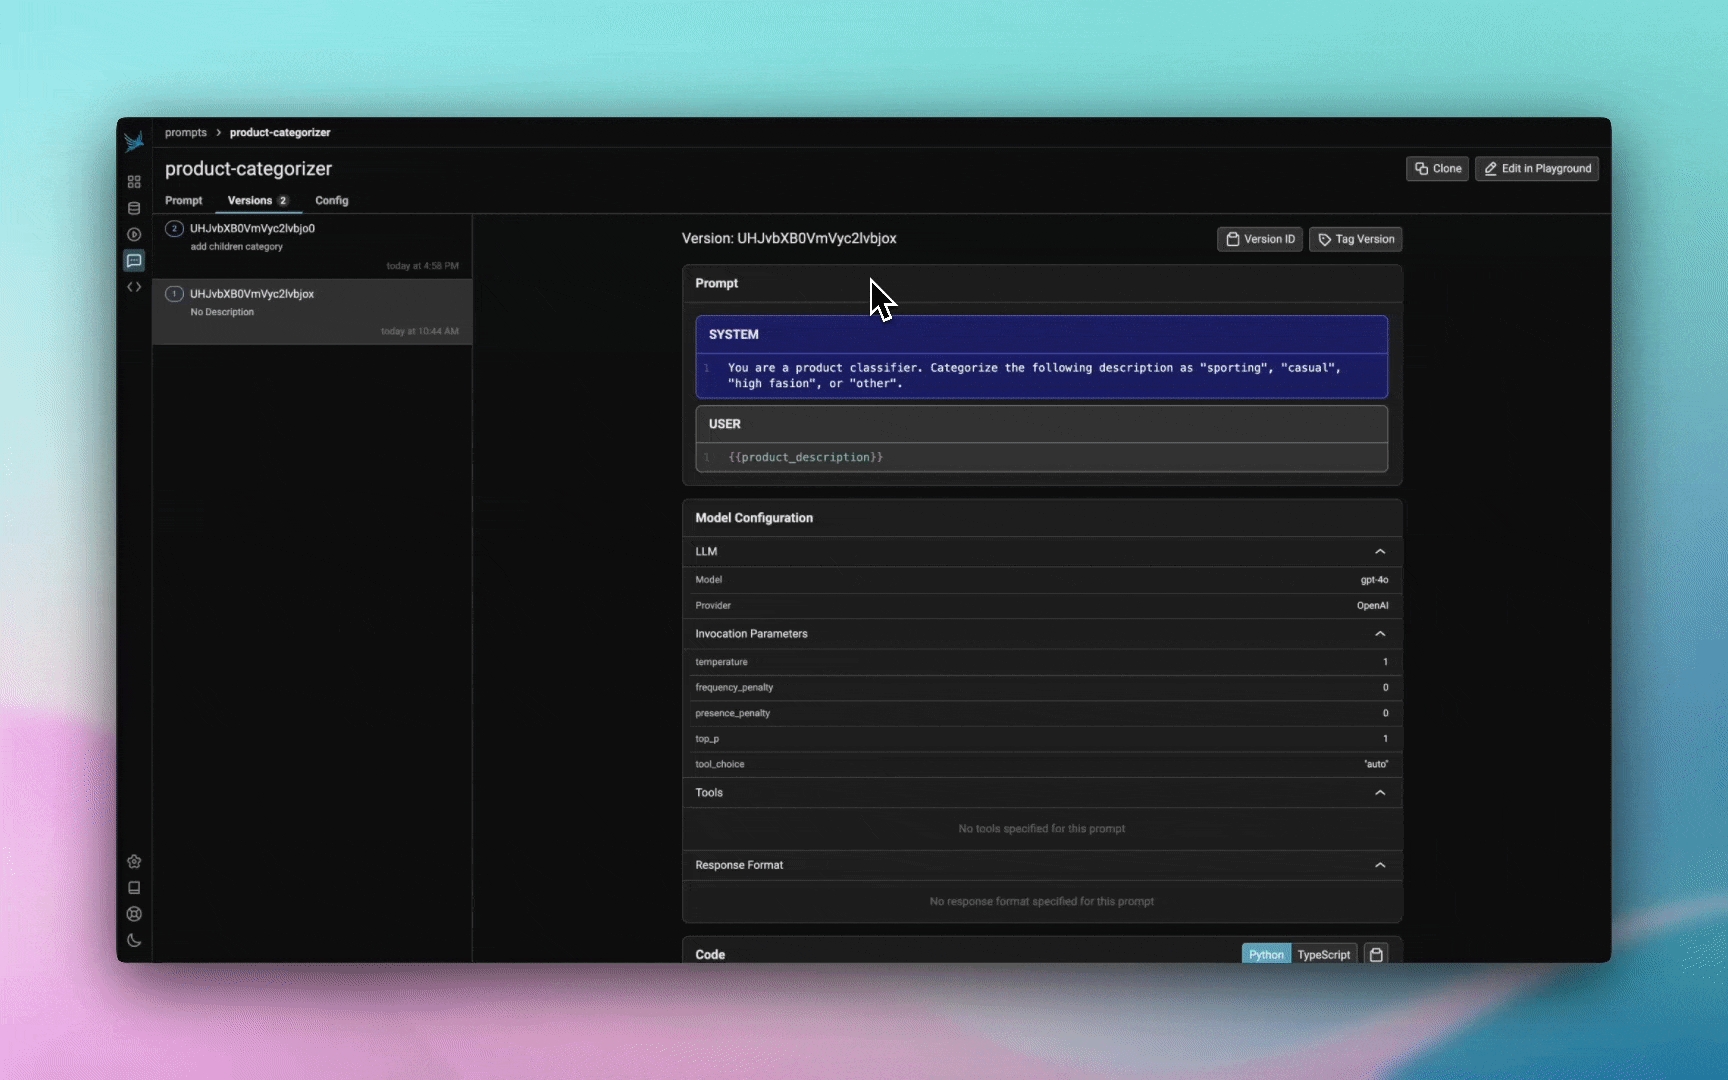
Prompts can be loaded back into the Playground at any time by clicking on "open in playground"
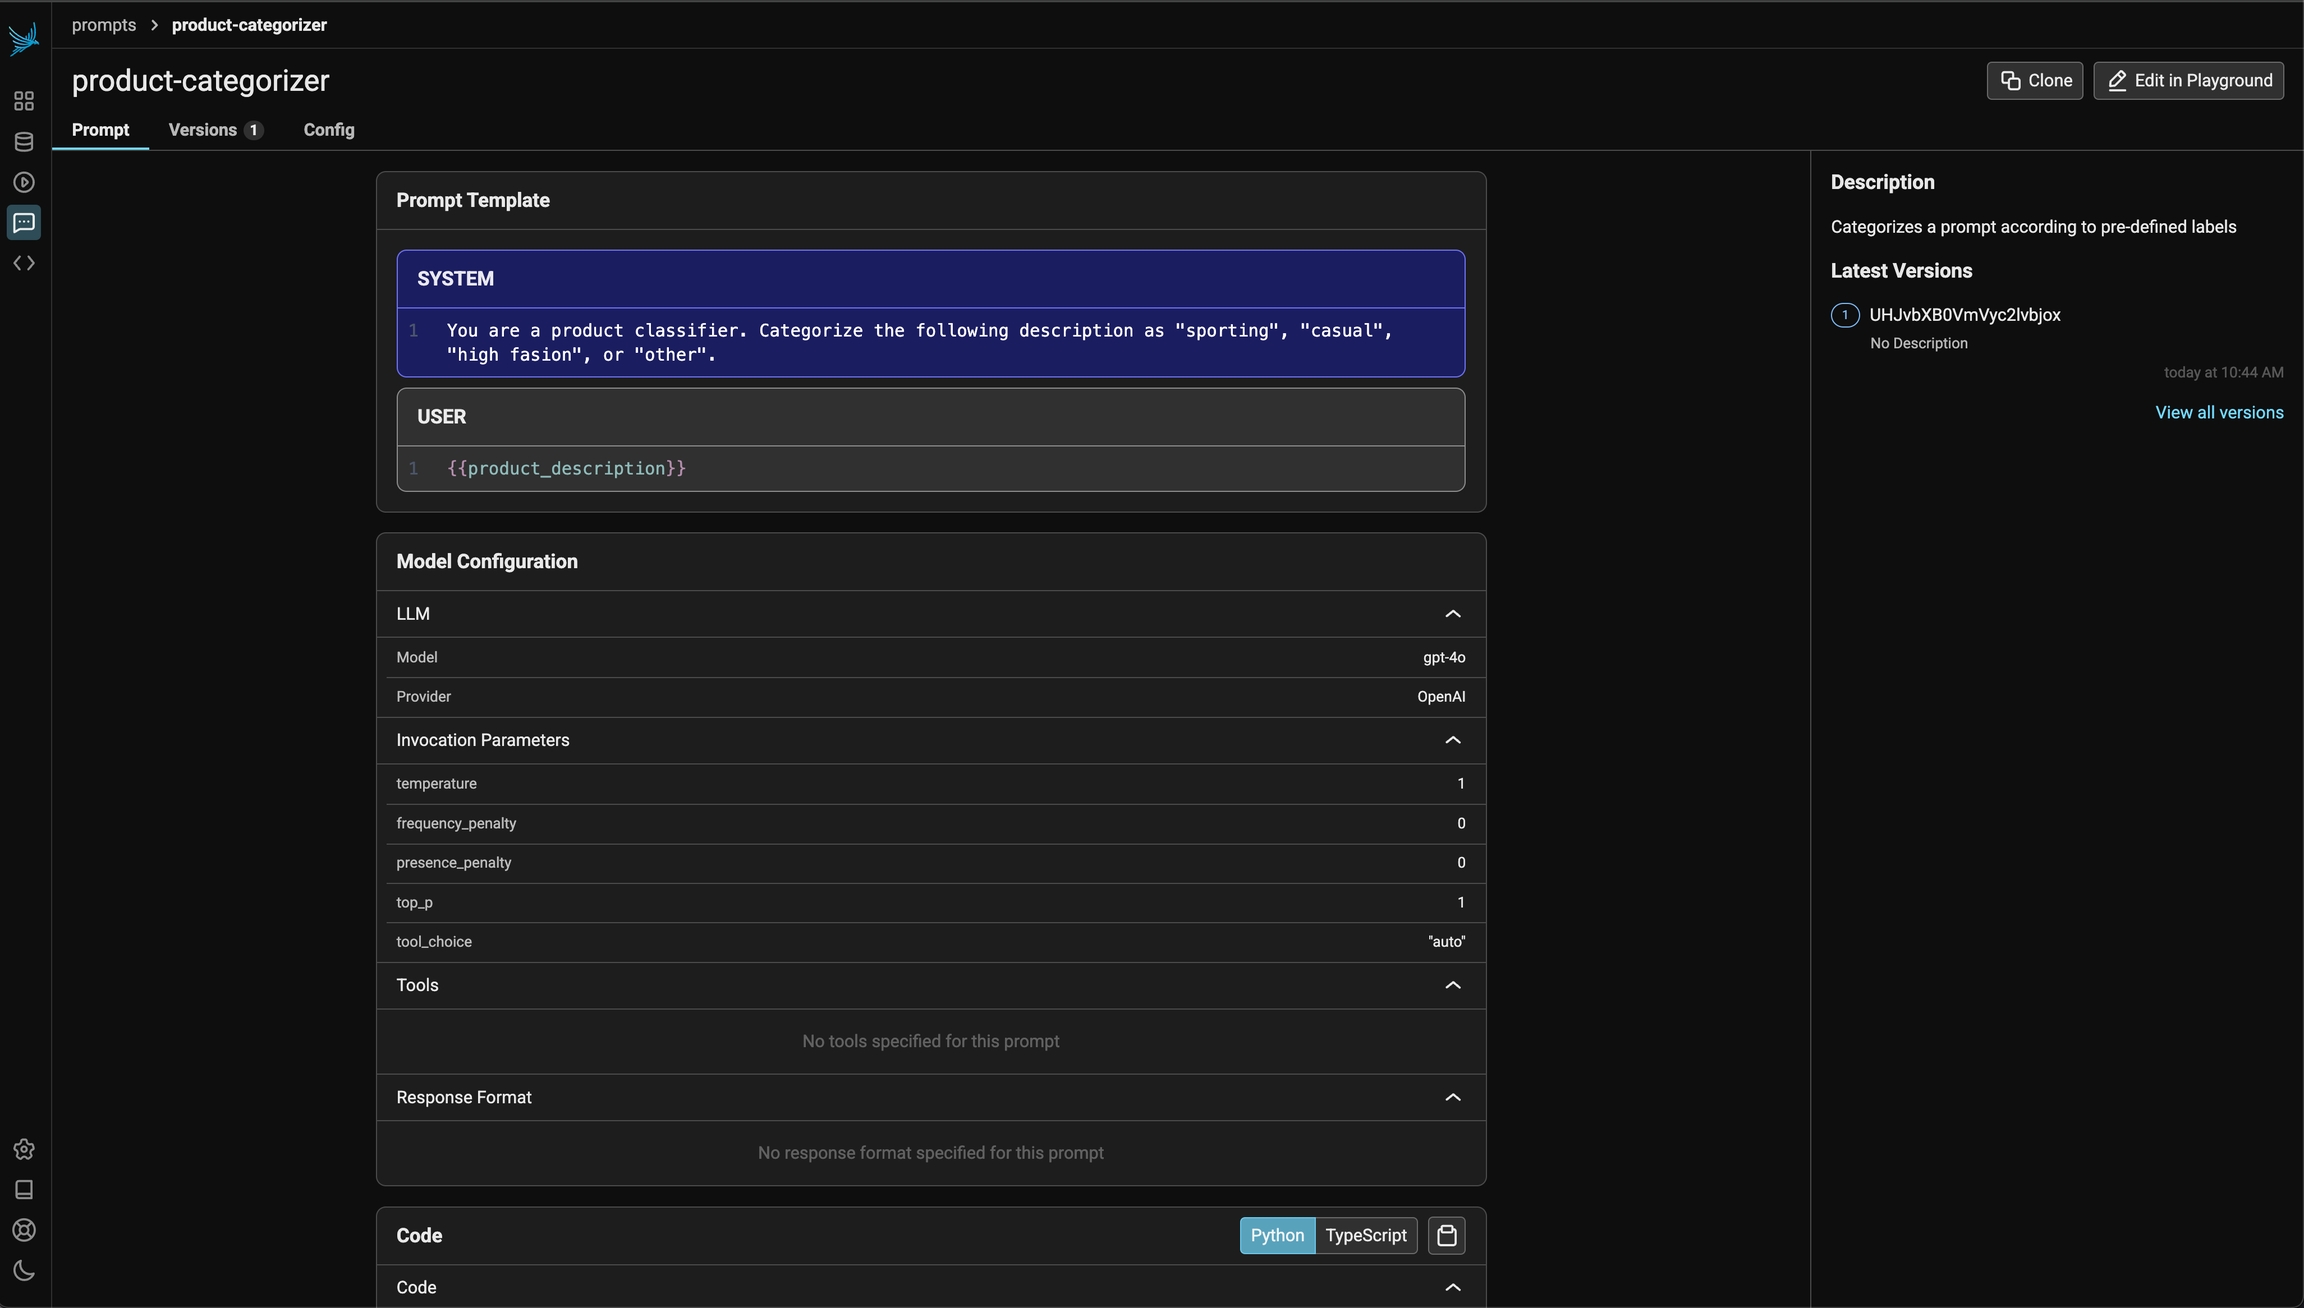
To make edits to a prompt, click on the edit in Playground on the top right of the prompt details view.
When you are happy with your prompt, click save. You will be asked to provide a description of the changes you made to the prompt. This description will show up in the history of the prompt for others to understand what you did.
In some cases, you may need to modify a prompt without altering its original version. To achieve this, you can clone a prompt, similar to forking a repository in Git.
Cloning a prompt allows you to experiment with changes while preserving the history of the main prompt. Once you have made and reviewed your modifications, you can choose to either keep the cloned version as a separate prompt or merge your changes back into the main prompt. To do this, simply load the cloned prompt in the playground and save it as the main prompt.
This approach ensures that your edits are flexible and reversible, preventing unintended modifications to the original prompt.
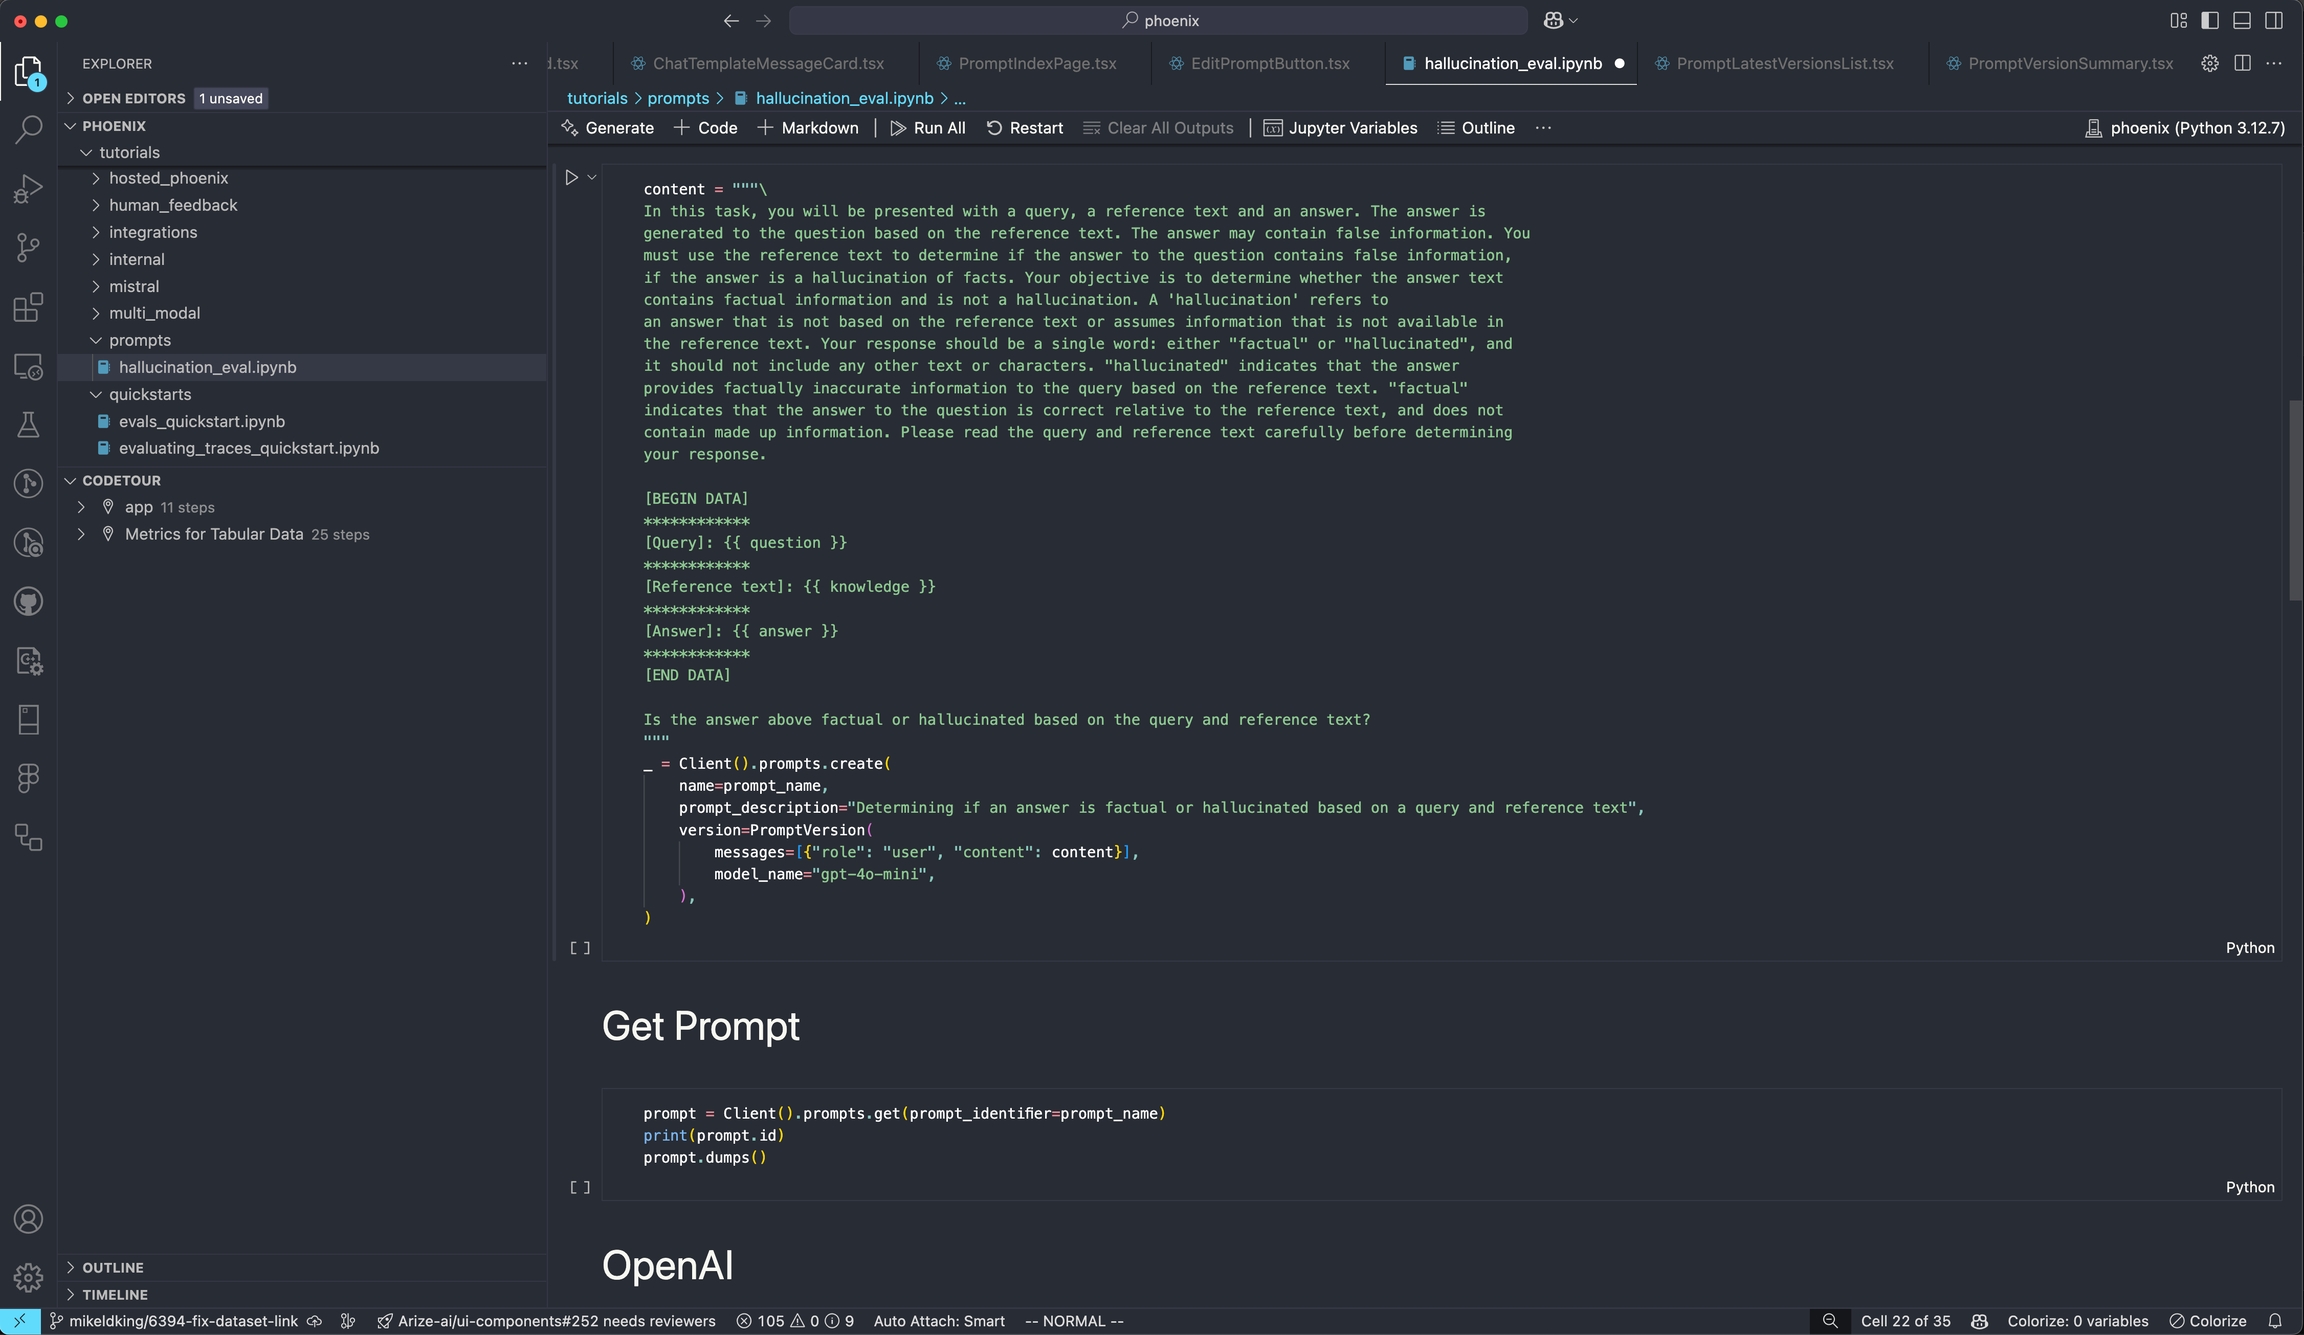
Creating a prompt in code can be useful if you want a programatic way to sync prompts with the Phoenix server.
Below is an example prompt for summarizing articles as bullet points. Use the Phoenix client to store the prompt in the Phoenix server. The name of the prompt is an identifier with lowercase alphanumeric characters plus hyphens and underscores (no spaces).
A prompt stored in the database can be retrieved later by its name. By default the latest version is fetched. Specific version ID or a tag can also be used for retrieval of a specific version.
Testing your prompts before you ship them is vital to deploying reliable AI applications
The Playground is a fast and efficient way to refine prompt variations. You can load previous prompts and validate their performance by applying different variables.
Each single-run test in the Playground is recorded as a span in the Playground project, allowing you to revisit and analyze LLM invocations later. These spans can be added to datasets or reloaded for further testing.
The ideal way to test a prompt is to construct a golden dataset where the dataset examples contains the variables to be applied to the prompt in the inputs and the outputs contains the ideal answer you want from the LLM. This way you can run a given prompt over N number of examples all at once and compare the synthesized answers against the golden answers.
Prompt Playground supports side-by-side comparisons of multiple prompt variants. Click + Compare to add a new variant. Whether using Span Replay or testing prompts over a Dataset, the Playground processes inputs through each variant and displays the results for easy comparison.
How to deploy prompts to different environments safely
Prompts in Phoenix are versioned in a linear history, creating a comprehensive audit trail of all modifications. Each change is tracked, allowing you to:
Review the complete history of a prompt
Understand who made specific changes
Revert to previous versions if needed
When you are ready to deploy a prompt to a certain environment (let's say staging), the best thing to do is to tag a specific version of your prompt as ready. By default Phoenix offers 3 tags, production, staging, and development but you can create your own tags as well.
Each tag can include an optional description to provide additional context about its purpose or significance. Tags are unique per prompt, meaning you cannot have two tags with the same name for the same prompt.
It can be helpful to have custom tags to track different versions of a prompt. For example if you wanted to tag a certain prompt as the one that was used in your v0 release, you can create a custom tag with that name to keep track!
When creating a custom tag, you can provide:
A name for the tag (must be a valid identifier)
An optional description to provide context about the tag's purpose
Once a prompt version is tagged, you can pull this version of the prompt into any environment that you would like (an application, an experiment). Similar to git tags, prompt version tags let you create a "release" of a prompt (e.x. pushing a prompt to staging).
You can retrieve a prompt version by:
Using the tag name directly (e.g., "production", "staging", "development")
Using a custom tag name
Using the latest version (which will return the most recent version regardless of tags)
For full details on how to use prompts in code, see Using a prompt
You can list all tags associated with a specific prompt version. The list is paginated, allowing you to efficiently browse through large numbers of tags. Each tag in the list includes:
The tag's unique identifier
The tag's name
The tag's description (if provided)
This is particularly useful when you need to:
Review all tags associated with a prompt version
Verify which version is currently tagged for a specific environment
Track the history of tag changes for a prompt version
Tag names must be valid identifiers: lowercase letters, numbers, hyphens, and underscores, starting and ending with a letter or number.
Examples: staging, production-v1, release-2024
Once you have tagged a version of a prompt as ready (e.x. "staging") you can pull a prompt into your code base and use it to prompt an LLM.
To use prompts in your code you will need to install the phoenix client library.
For Python:
For JavaScript / TypeScript:
Pulling a prompt by name or ID (e.g. the identifier) is the easiest way to pull a prompt. Note that since name and ID doesn't specify a specific version, you will always get the latest version of a prompt. For this reason we only recommend doing this during development.
Note prompt names and IDs are synonymous.
Pulling a prompt by version retrieves the content of a prompt at a particular point in time. The version can never change, nor be deleted, so you can reasonably rely on it in production-like use cases.
Note that tags are unique per prompt so it must be paired with the prompt_identifier
A Prompt pulled in this way can be automatically updated in your application by simply moving the "staging" tag from one prompt version to another.
The Phoenix Client libraries make it simple to transform prompts to the SDK that you are using (no proxying necessary!)
Both the Python and TypeScript SDKs support transforming your prompts to a variety of SDKs (no proprietary SDK necessary).
Python - support for OpenAI, Anthropic, Gemini
TypeScript - support for OpenAI, Anthropic, and the Vercel AI SDK
The velocity of AI application development is bottlenecked by quality evaluations because AI engineers are often faced with hard tradeoffs: which prompt or LLM best balances performance, latency, and cost. High quality evaluations are critical as they can help developers answer these types of questions with greater confidence.
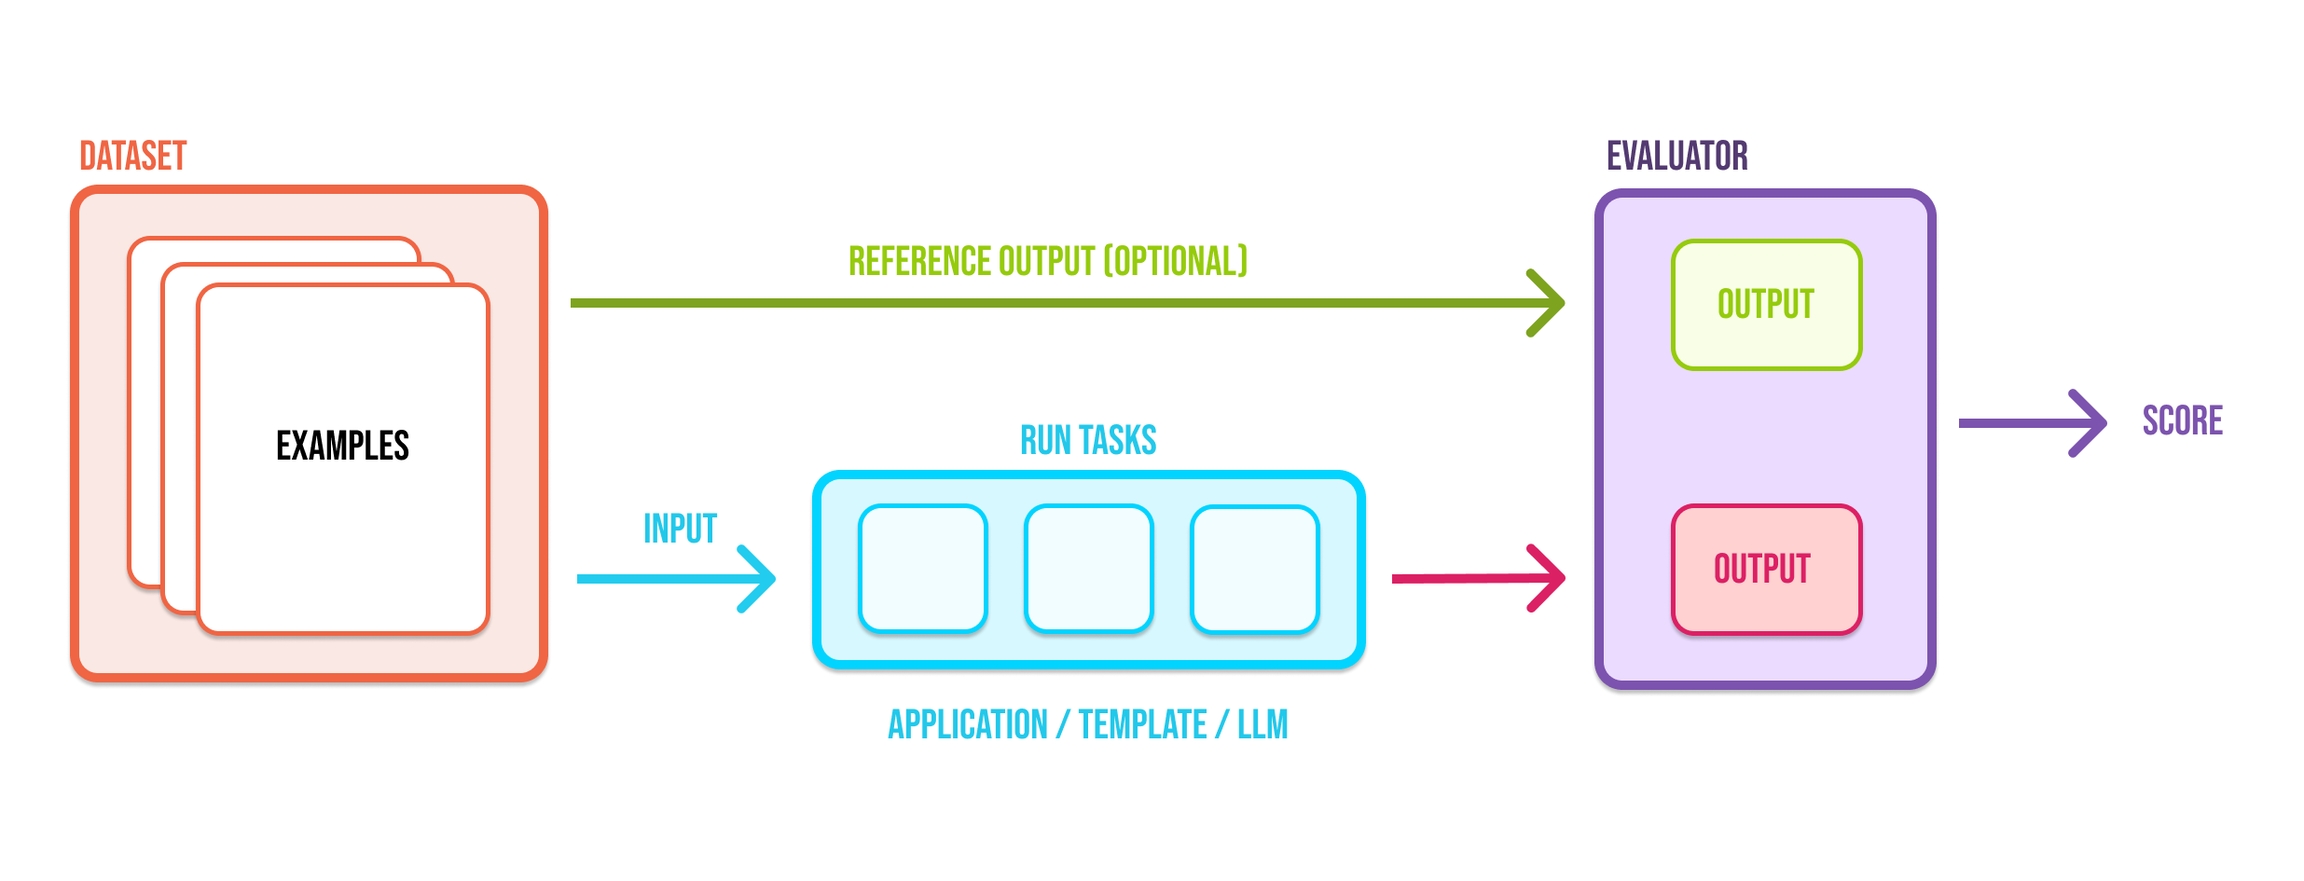
Datasets are integral to evaluation. They are collections of examples that provide the inputs and, optionally, expected reference outputs for assessing your application. Datasets allow you to collect data from production, staging, evaluations, and even manually. The examples collected are used to run experiments and evaluations to track improvements to your prompt, LLM, or other parts of your LLM application.
In AI development, it's hard to understand how a change will affect performance. This breaks the dev flow, making iteration more guesswork than engineering.
Experiments and evaluations solve this, helping distill the indeterminism of LLMs into tangible feedback that helps you ship more reliable product.
Specifically, good evals help you:
Understand whether an update is an improvement or a regression
Drill down into good / bad examples
Compare specific examples vs. prior runs
Avoid guesswork
Phoenix helps you run experiments over your AI and LLM applications to evaluate and iteratively improve their performance. This quickstart shows you how to get up and running quickly.
Grab your API key from the Keys option on the left bar.
In your code, set your endpoint and API key:
In your code, set your endpoint:
Upload a dataset.
Create a task to evaluate.
Use pre-built evaluators to grade task output with code...
or LLMs.
Define custom evaluators with code...
or LLMs.
Run an experiment and evaluate the results.
Run more evaluators after the fact.
And iterate 🚀
Sometimes we may want to do a quick sanity check on the task function or the evaluators before unleashing them on the full dataset. run_experiment() and evaluate_experiment() both are equipped with a dry_run= parameter for this purpose: it executes the task and evaluators on a small subset without sending data to the Phoenix server. Setting dry_run=True selects one sample from the dataset, and setting it to a number, e.g. dry_run=3, selects multiple. The sampling is also deterministic, so you can keep re-running it for debugging purposes.
Datasets are critical assets for building robust prompts, evals, fine-tuning,
Datasets are critical assets for building robust prompts, evals, fine-tuning, and much more. Phoenix allows you to build datasets manually, programmatically, or from files.
Export datasets for offline analysis, evals, and fine-tuning.
Exporting to CSV - how to quickly download a dataset to use elsewhere
Sometimes you just want to upload datasets using plain objects as CSVs and DataFrames can be too restrictive about the keys.
One of the quicket way of getting started is to produce synthetic queries using an LLM.
One use case for synthetic data creation is when you want to test your RAG pipeline. You can leverage an LLM to synthesize hypothetical questions about your knowledge base.
In the below example we will use Phoenix's built-in llm_generate, but you can leverage any synthetic dataset creation tool you'd like.
Imagine you have a knowledge-base that contains the following documents:
Once your synthetic data has been created, this data can be uploaded to Phoenix for later re-use.
Once we've constructed a collection of synthetic questions, we can upload them to a Phoenix dataset.
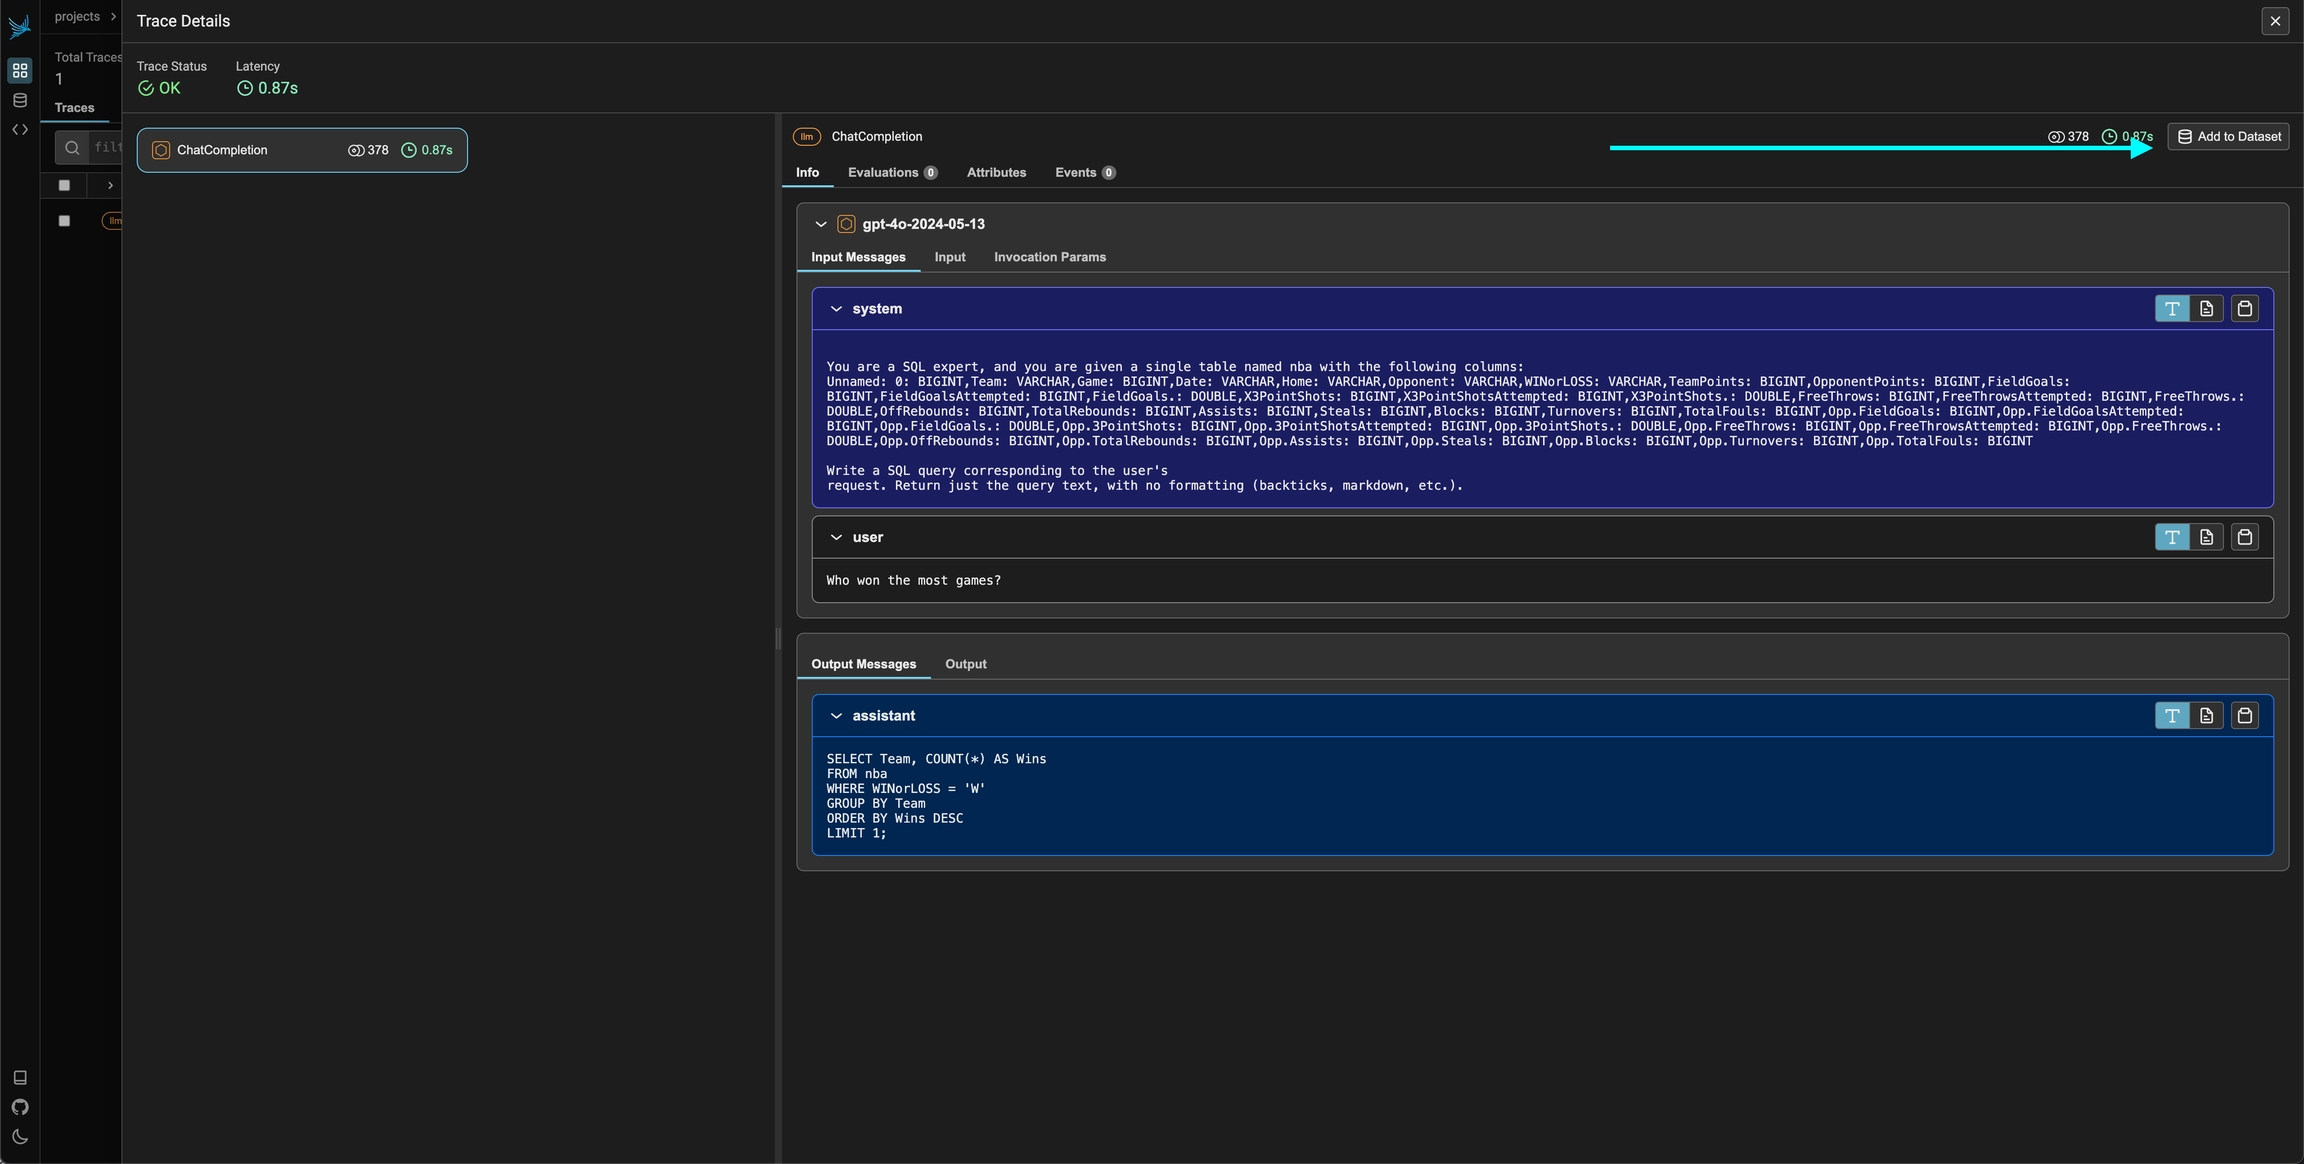
If you have an application that is traced using instrumentation, you can quickly add any span or group of spans using the Phoenix UI.
To add a single span to a dataset, simply select the span in the trace details view. You should see an add to dataset button on the top right. From there you can select the dataset you would like to add it to and make any changes you might need to make before saving the example.
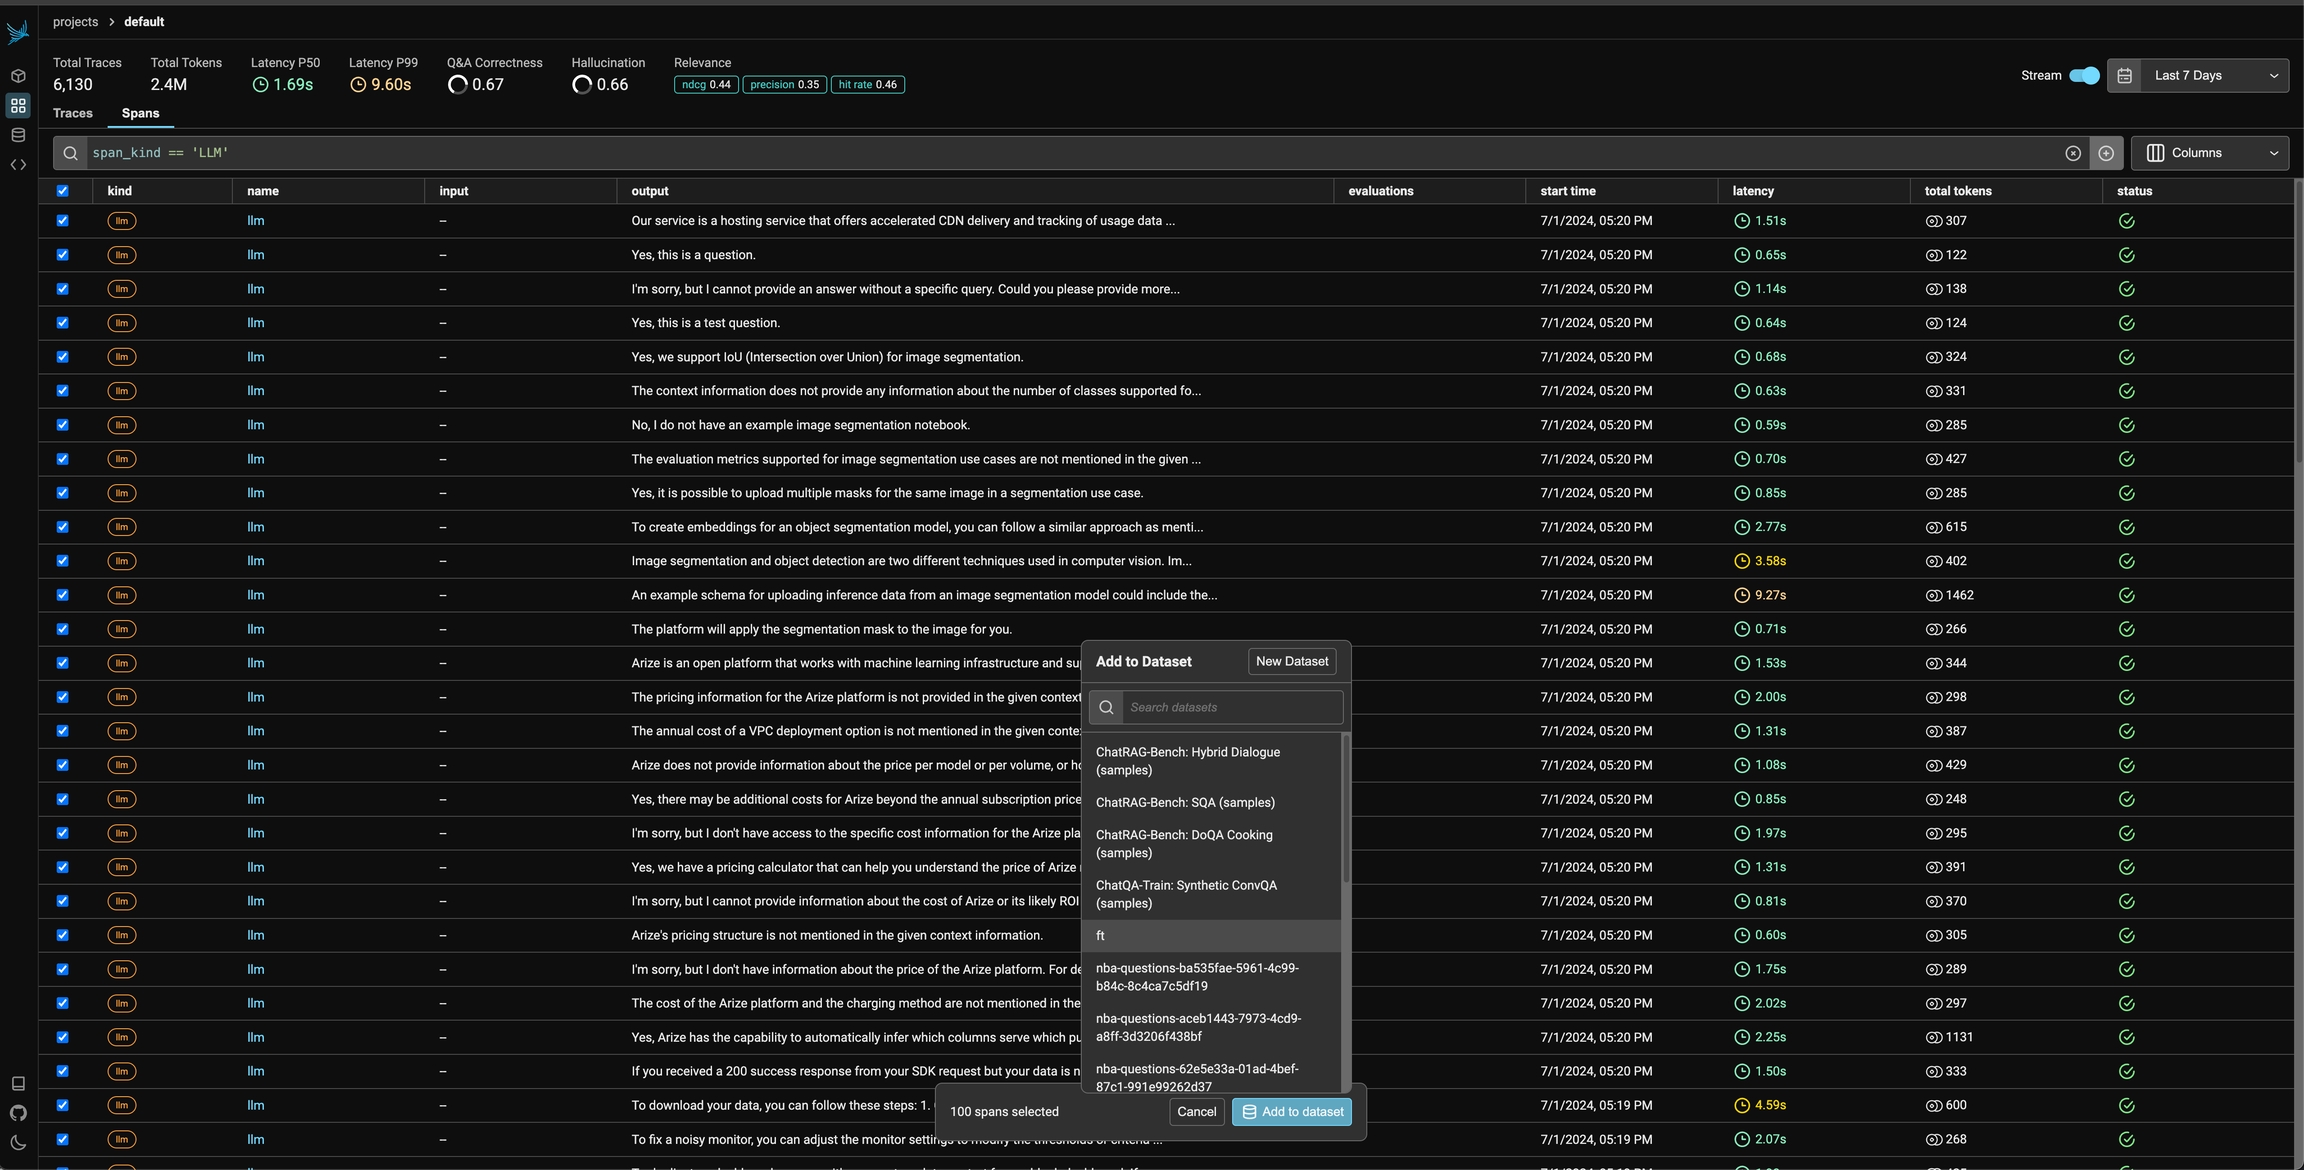
You can also use the filters on the spans table and select multiple spans to add to a specific dataset.
Want to just use the contents of your dataset in another context? Simply click on the export to CSV button on the dataset page and you are good to go!
Fine-tuning lets you get more out of the models available by providing:
Higher quality results than prompting
Ability to train on more examples than can fit in a prompt
Token savings due to shorter prompts
Lower latency requests
Fine-tuning improves on few-shot learning by training on many more examples than can fit in the prompt, letting you achieve better results on a wide number of tasks. Once a model has been fine-tuned, you won't need to provide as many examples in the prompt. This saves costs and enables lower-latency requests. Phoenix natively exports OpenAI Fine-Tuning JSONL as long as the dataset contains compatible inputs and outputs.
The following are the key steps of running an experiment illustrated by simple example.
Make sure you have Phoenix and the instrumentors needed for the experiment setup. For this example we will use the OpenAI instrumentor to trace the LLM calls.
The key steps of running an experiment are:
Define/upload a Dataset (e.g. a dataframe)
Each record of the dataset is called an Example
Define a task
A task is a function that takes each Example and returns an output
Define Evaluators
An Evaluator is a function evaluates the output for each Example
Run the experiment
We'll start by launching the Phoenix app.
A dataset can be as simple as a list of strings inside a dataframe. More sophisticated datasets can be also extracted from traces based on actual production data. Here we just have a small list of questions that we want to ask an LLM about the NBA games:
Create pandas dataframe
The dataframe can be sent to Phoenix via the Client. input_keys and output_keys are column names of the dataframe, representing the input/output to the task in question. Here we have just questions, so we left the outputs blank:
Upload dataset to Phoenix
Each row of the dataset is called an Example.
A task is any function/process that returns a JSON serializable output. Task can also be an async function, but we used sync function here for simplicity. If the task is a function of one argument, then that argument will be bound to the input field of the dataset example.
For our example here, we'll ask an LLM to build SQL queries based on our question, which we'll run on a database and obtain a set of results:
Set Up Database
Set Up Prompt and LLM
Define task as a Function
Recall that each row of the dataset is encapsulated as Example object. Recall that the input keys were defined when we uploaded the dataset:
More complex task inputs
More complex tasks can use additional information. These values can be accessed by defining a task function with specific parameter names which are bound to special values associated with the dataset example:
input
example input
def task(input): ...
expected
example output
def task(expected): ...
reference
alias for expected
def task(reference): ...
metadata
example metadata
def task(metadata): ...
example
Example object
def task(example): ...
A task can be defined as a sync or async function that takes any number of the above argument names in any order!
An evaluator is any function that takes the task output and return an assessment. Here we'll simply check if the queries succeeded in obtaining any result from the database:
Instrument OpenAI
Instrumenting the LLM will also give us the spans and traces that will be linked to the experiment, and can be examine in the Phoenix UI:
Run the Task and Evaluators
Running an experiment is as easy as calling run_experiment with the components we defined above. The results of the experiment will be show up in Phoenix:
evaluate_experiment.If you no longer have access to the original experiment object, you can retrieve it from Phoenix using the get_experiment client method.
Sometimes we may want to do a quick sanity check on the task function or the evaluators before unleashing them on the full dataset. run_experiment() and evaluate_experiment() both are equipped with a dry_run= parameter for this purpose: it executes the task and evaluators on a small subset without sending data to the Phoenix server. Setting dry_run=True selects one sample from the dataset, and setting it to a number, e.g. dry_run=3, selects multiple. The sampling is also deterministic, so you can keep re-running it for debugging purposes.
We provide LLM evaluators out of the box. These evaluators are vendor agnostic and can be instantiated with a Phoenix model wrapper:
Code evaluators are functions that evaluate the output of your LLM task that don't use another LLM as a judge. An example might be checking for whether or not a given output contains a link - which can be implemented as a RegEx match.
phoenix.experiments.evaluators contains some pre-built code evaluators that can be passed to the evaluators parameter in experiments.
The above contains_link evaluator can then be passed as an evaluator to any experiment you'd like to run.
For a full list of code evaluators, please consult repo or API documentation.
The simplest way to create an evaluator is just to write a Python function. By default, a function of one argument will be passed the output of an experiment run. These custom evaluators can either return a boolean or numeric value which will be recorded as the evaluation score.
Imagine our experiment is testing a task that is intended to output a numeric value from 1-100. We can write a simple evaluator to check if the output is within the allowed range:
By simply passing the in_bounds function to run_experiment, we will automatically generate evaluations for each experiment run for whether or not the output is in the allowed range.
More complex evaluations can use additional information. These values can be accessed by defining a function with specific parameter names which are bound to special values:
input
experiment run input
def eval(input): ...
output
experiment run output
def eval(output): ...
expected
example output
def eval(expected): ...
reference
alias for expected
def eval(reference): ...
metadata
experiment metadata
def eval(metadata): ...
These parameters can be used in any combination and any order to write custom complex evaluators!
Below is an example of using the editdistance library to calculate how close the output is to the expected value:
For even more customization, use the create_evaluator decorator to further customize how your evaluations show up in the Experiments UI.
The decorated wordiness_evaluator can be passed directly into run_experiment!
Phoenix supports running multiple evals on a single experiment, allowing you to comprehensively assess your model's performance from different angles. When you provide multiple evaluators, Phoenix creates evaluation runs for every combination of experiment runs and evaluators.
Phoenix Evals come with:
Speed - Phoenix evals are designed for maximum speed and throughput. Evals run in batches and typically run 10x faster than calling the APIs directly.
Evaluating any AI application is a challenge. Evaluating an agent is even more difficult. Agents present a unique set of evaluation pitfalls to navigate. For one, agents can take inefficient paths and still get to the right solution. How do you know if they took an optimal path? For another, bad responses upstream can lead to strange responses downstream. How do you pinpoint where a problem originated?
This page will walk you through a framework for navigating these pitfalls.
An agent is characterized by what it knows about the world, the set of actions it can perform, and the pathway it took to get there. To evaluate an agent, we must evaluate each of these components.
We've built evaluation templates for every step:
Read more to see the breakdown of each component.
Routers are one of the most common components of agents. While not every agent has a specific router node, function, or step, all agents have some method that chooses the next step to take. Routers and routing logic can be powered by intent classifiers, rules-based code, or most often, LLMs that use function calling.
To evaluate a router or router logic, you need to check:
Whether the router chose the correct next step to take, or function to call.
Whether the router extracted the correct parameters to pass on to that next step.
Whether the router properly handles edge cases, such as missing context, missing parameters, or cases where multiple functions should be called concurrently.
Take a travel agent router for example.
User Input: Help me find a flight from SF on 5/15
Router function call: flight-search(date="5/15", departure_city="SF", destination_city="")
Function choice
✅
Parameter extraction
❌
For more complex agents, it may be necessary to first have the agent plan out its intended path ahead of time. This approach can help avoid unnecessary tool calls, or endless repeating loops as the agent bounces between the same steps.
For agents that use this approach, a common evaluation metric is the quality of the plan generated by the agent. This "quality" metric can either take the form of a single overall evaluation, or a set of smaller ones, but either way, should answer:
Does the plan include only skills that are valid?
Are Z skills sufficient to accomplish this task?
Will Y plan accomplish this task given Z skills?
Is this the shortest plan to accomplish this task?
Given the more qualitative nature of these evaluations, they are usually performed by an LLM Judge.
Skills are the individual logic blocks, workflows, or chains that an agent can call on. For example, a RAG retriever skill, or a skill to all a specific API. Skills may be written and defined by the agent's designer, however increasingly skills may be outside services connect to via protocols like Anthropic's MCP.
You can evaluate skills using standard LLM or code evaluations. Since you are separately evaluating the router, you can evaluate skills "in a vacuum". You can assume that the skill was chosen correctly, and the parameters were properly defined, and can focus on whether the skill itself performed correctly.
Some common skill evals are:
Skills can be evaluated by LLM Judges, comparing against ground truth, or in code - depending on the skill.
Agent memory is used to store state between different components of an agent. You may store retrieved context, config variables, or any other info in agent memory. However, the most common information stored in agent memory is a long of the previous steps the agent has taken, typically formatted as LLM messages.
These messages form the best data to evaluate the agent's path.
The main questions that path evaluations try to answer are:
Did the agent go off the rails and onto the wrong pathway?
Does it get stuck in an infinite loop?
Does it choose the right sequence of steps to take given a whole agent pathway for a single action?
One type of path evaluation is measuring agent convergence. This is a numerical value, which is the length of the optimal path / length of the average path for similar queries.
Reflection allows you to evaluate your agents at runtime to enhance their quality. Before declaring a task complete, a plan devised, or an answer generated, ask the agent to reflect on the outcome. If the task isn't accomplished to the standard you want, retry.
See our Agent Reflection evaluation template for a more specific example.
Through a combination of the evaluations above, you can get a far more accurate picture of how your agent is performing.
This quickstart guide will show you through the basics of evaluating data from your LLM application.
The first thing you'll need is a dataset to evaluate. This could be your own collect or generated set of examples, or data you've exported from Phoenix traces. If you've already collected some trace data, this makes a great starting point.
For the sake of this guide however, we'll download some pre-existing data to evaluate. Feel free to sub this with your own data, just be sure it includes the following columns:
reference
query
response
Set up evaluators (in this case for hallucinations and Q&A correctness), run the evaluations, and log the results to visualize them in Phoenix. We'll use OpenAI as our evaluation model for this example, but Phoenix also supports a number of other models. First, we need to add our OpenAI API key to our environment.
Explanation of the parameters used in run_evals above:
dataframe - a pandas dataframe that includes the data you want to evaluate. This could be spans exported from Phoenix, or data you've brought in from elsewhere. This dataframe must include the columns expected by the evaluators you are using. To see the columns expected by each built-in evaluator, check the corresponding page in the Using Phoenix Evaluators section.
evaluators - a list of built-in Phoenix evaluators to use.
provide_explanations - a binary flag that instructs the evaluators to generate explanations for their choices.
Combine your evaluation results and explanations with your original dataset:
Note: You'll only be able to log evaluations to the Phoenix UI if you used a trace or span dataset exported from Phoenix as your dataset in this quickstart. If you've used your own outside dataset, you won't be able to log these results to Phoenix.
Run evaluations via a job to visualize in the UI as traces stream in.
Evaluate traces captured in Phoenix and export results to the Phoenix UI.
Evaluate tasks with multiple inputs/outputs (ex: text, audio, image) using versatile evaluation tasks.
This LLM Eval detects if the output of a model is a hallucination based on contextual data.
This Eval is specifically designed to detect hallucinations in generated answers from private or retrieved data. The Eval detects if an AI answer to a question is a hallucination based on the reference data used to generate the answer.
The above Eval shows how to the the hallucination template for Eval detection.
Precision
0.93
Recall
0.72
F1
0.82
100 Samples
105 sec
This Eval evaluates whether a question was correctly answered by the system based on the retrieved data. In contrast to retrieval Evals that are checks on chunks of data returned, this check is a system level check of a correct Q&A.
question: This is the question the Q&A system is running against
sampled_answer: This is the answer from the Q&A system.
context: This is the context to be used to answer the question, and is what Q&A Eval must use to check the correct answer
The above Eval uses the QA template for Q&A analysis on retrieved data.
Supplemental Data to Squad 2: In order to check the case of detecting incorrect answers, we created wrong answers based on the context data. The wrong answers are intermixed with right answers.
Each example in the dataset was evaluating using the QA_PROMPT_TEMPLATE above, then the resulting labels were compared against the ground truth in the benchmarking dataset.
Precision
1
1
Recall
0.89
0.92
F1
0.94
0.96
100 Samples
124 Sec
This Eval evaluates whether a retrieved chunk contains an answer to the query. It's extremely useful for evaluating retrieval systems.
The above runs the RAG relevancy LLM template against the dataframe df.
Precision
0.60
0.70
Recall
0.77
0.88
F1
0.67
0.78
100 Samples
113 Sec
This Eval helps evaluate the summarization results of a summarization task. The template variables are:
document: The document text to summarize
summary: The summary of the document
The above shows how to use the summarization Eval template.
Precision
0.87
0.79
Recall
0.63
0.88
F1
0.73
0.83
This Eval checks the correctness and readability of the code from a code generation process. The template variables are:
query: The query is the coding question being asked
code: The code is the code that was returned.
The above shows how to use the code readability template.
Precision
0.93
Recall
0.78
F1
0.85
The following shows the results of the toxicity Eval on a toxic dataset test to identify if the AI response is racist, biased, or toxic. The template variables are:
text: the text to be classified
Note: Palm is not useful for Toxicity detection as it always returns "" string for toxic inputs
Precision
0.86
0.91
Recall
1.0
0.91
F1
0.92
0.91
This LLM evaluation is used to compare AI answers to Human answers. Its very useful in RAG system benchmarking to compare the human generated groundtruth.
A workflow we see for high quality RAG deployments is generating a golden dataset of questions and a high quality set of answers. These can be in the range of 100-200 but provide a strong check for the AI generated answers. This Eval checks that the human ground truth matches the AI generated answer. Its designed to catch missing data in "half" answers and differences of substance.
Question:
What Evals are supported for LLMs on generative models?
Human:
Arize supports a suite of Evals available from the Phoenix Evals library, they include both pre-tested Evals and the ability to configure cusotm Evals. Some of the pre-tested LLM Evals are listed below:
Retrieval Relevance, Question and Answer, Toxicity, Human Groundtruth vs AI, Citation Reference Link Relevancy, Code Readability, Code Execution, Hallucination Detection and Summarizaiton
AI:
Arize supports LLM Evals.
Eval:
Incorrect
Explanation of Eval:
The AI answer is very brief and lacks the specific details that are present in the human ground truth answer. While the AI answer is not incorrect in stating that Arize supports LLM Evals, it fails to mention the specific types of Evals that are supported, such as Retrieval Relevance, Question and Answer, Toxicity, Human Groundtruth vs AI, Citation Reference Link Relevancy, Code Readability, Hallucination Detection, and Summarization. Therefore, the AI answer does not fully capture the substance of the human answer.
Overview of template:
GPT-4 Results
Precision
0.90
0.92
Recall
0.56
0.74
F1
0.69
0.82
In chatbots and Q&A systems, many times reference links are provided in the response, along with an answer, to help point users to documentation or pages that contain more information or the source for the answer.
EXAMPLE: Q&A from Arize-Phoenix Documentation
QUESTION: What other models does Arize Phoenix support beyond OpenAI for running Evals?
ANSWER: Phoenix does support a large set of LLM models through the model object. Phoenix supports OpenAI (GPT-4, GPT-4-32k, GPT-3.5 Turbo, GPT-3.5 Instruct, etc...), Azure OpenAI, Google Palm2 Text Bison, and All AWS Bedrock models (Claude, Mistral, etc...).
This Eval checks the reference link returned answers the question asked in a conversation
Each example in the dataset was evaluating using the REF_LINK_EVAL_PROMPT_TEMPLATE_STR above, then the resulting labels were compared against the ground truth label in the benchmark dataset to generate the confusion matrices below.
GPT-4 Results
Precision
0.96
Recall
0.79
F1
0.87
Teams that are using conversation bots and assistants desire to know whether a user interacting with the bot is frustrated. The user frustration evaluation can be used on a single back and forth or an entire span to detect whether a user has become frustrated by the conversation.
The following is an example of code snippet showing how to use the eval above template:
SQL Generation is a common approach to using an LLM. In many cases the goal is to take a human description of the query and generate matching SQL to the human description.
Example of a Question: How many artists have names longer than 10 characters?
Example Query Generated:
SELECT COUNT(ArtistId) \nFROM artists \nWHERE LENGTH(Name) > 10
The goal of the SQL generation Evaluation is to determine if the SQL generated is correct based on the question asked.
The Agent Function Call eval can be used to determine how well a model selects a tool to use, extracts the right parameters from the user query, and generates the tool call code.
Parameters:
df - a dataframe of cases to evaluate. The dataframe must have these columns to match the default template:
This template instead evaluates only the parameter extraction step of a router:
When your agents take multiple steps to get to an answer or resolution, it's important to evaluate the pathway it took to get there. You want most of your runs to be consistent and not take unnecessarily frivolous or wrong actions.
One way of doing this is to calculate convergence:
Run your agent on a set of similar queries
Record the number of steps taken for each
Calculate the convergence score: avg(minimum steps taken / steps taken for this run)
This will give a convergence score of 0-1, with 1 being a perfect score.
The Emotion Detection Eval Template is designed to classify emotions from audio files. This evaluation leverages predefined characteristics, such as tone, pitch, and intensity, to detect the most dominant emotion expressed in an audio input. This guide will walk you through how to use the template within the Phoenix framework to evaluate emotion classification models effectively.
The following is the structure of the EMOTION_PROMPT_TEMPLATE:
The prompt and evaluation logic are part of the phoenix.evals.default_audio_templates module and are defined as:
EMOTION_AUDIO_RAILS: Output options for the evaluation template.
EMOTION_PROMPT_TEMPLATE: Prompt used for evaluating audio emotions.
Evaluation model classes powering your LLM Evals
We currently support the following LLM providers under phoenix.evals:
To authenticate with OpenAI you will need, at a minimum, an API key. The model class will look for it in your environment, or you can pass it via argument as shown above. In addition, you can choose the specific name of the model you want to use and its configuration parameters. The default values specified above are common default values from OpenAI. Quickly instantiate your model as follows:
The code snippet below shows how to initialize OpenAIModel for Azure:
Azure OpenAI supports specific options:
Find more about the functionality available in our EvalModels in the Usage section.
To authenticate with VertexAI, you must pass either your credentials or a project, location pair. In the following example, we quickly instantiate the VertexAI model as follows:
Similar to VertexAIModel above for authentication
To Authenticate, the following code is used to instantiate a session and the session is used with Phoenix Evals
Need to install extra dependency mistralai
Need to install the extra dependency litellm>=1.0.3
Here is an example of how to initialize LiteLLMModel for llama3 using ollama.
In this section, we will showcase the methods and properties that our EvalModels have. First, instantiate your model from theSupported LLM Providers. Once you've instantiated your model, you can get responses from the LLM by simply calling the model and passing a text string.
This guide shows you how to build and improve an LLM as a Judge Eval from scratch.
You'll need two things to build your own LLM Eval:
A dataset to evaluate
A template prompt to use as the evaluation prompt on each row of data.
The dataset can have any columns you like, and the template can be structured however you like. The only requirement is that the dataset has all the columns your template uses.
We have two examples of templates below: CATEGORICAL_TEMPLATE and SCORE_TEMPLATE. The first must be used alongside a dataset with columns query and reference. The second must be used with a dataset that includes a column called context.
Feel free to set up your template however you'd like to match your dataset.
If your eval should have categorical outputs, use llm_classify.
If your eval should have numeric outputs, use llm_generate.
The llm_classify function is designed for classification support both Binary and Multi-Class. The llm_classify function ensures that the output is clean and is either one of the "classes" or "UNPARSABLE"
A binary template looks like the following with only two values "irrelevant" and "relevant" that are expected from the LLM output:
The categorical template defines the expected output of the LLM, and the rails define the classes expected from the LLM:
irrelevant
relevant
The classify uses a snap_to_rails function that searches the output string of the LLM for the classes in the classification list. It handles cases where no class is available, both classes are available or the string is a substring of the other class such as irrelevant and relevant.
A common use case is mapping the class to a 1 or 0 numeric value.
The Phoenix library does support numeric score Evals if you would like to use them. A template for a score Eval looks like the following:
We use the more generic llm_generate function that can be used for almost any complex eval that doesn't fit into the categorical type.
The above is an example of how to run a score based Evaluation.
In order for the results to show in Phoenix, make sure your test_results dataframe has a column context.span_id with the corresponding span id. This value comes from Phoenix when you export traces from the platform. If you've brought in your own dataframe to evaluate, this section does not apply.
At this point, you've constructed a custom Eval, but you have no understanding of how accurate that Eval is. To test your eval, you can use the same techniques that you use to iterate and improve on your application.
Start with a labeled ground truth set of data. Each input would be a row of your dataframe of examples, and each labeled output would be the correct judge label
Test your eval on that labeled set of examples, and compare to the ground truth to calculate F1, precision, and recall scores. For an example of this, see Hallucinations
Tweak your prompt and retest. See https://github.com/Arize-ai/phoenix/blob/docs/docs/evaluation/how-to-evals/broken-reference/README.md for an example of how to do this in an automated way.
Multimodal evaluation templates enable users to evaluate tasks involving multiple input or output modalities, such as text, audio, or images. These templates provide a structured framework for constructing evaluation prompts, allowing LLMs to assess the quality, correctness, or relevance of outputs across diverse use cases.
The flexibility of multimodal templates makes them applicable to a wide range of scenarios, such as:
Evaluating emotional tone in audio inputs, such as detecting user frustration or anger.
Assessing the quality of image captioning tasks.
Judging tasks that combine image and text inputs to produce contextualized outputs.
These examples illustrate how multimodal templates can be applied, but their versatility supports a broad spectrum of evaluation tasks tailored to specific user needs.
ClassificationTemplate is a class used to create evaluation prompts that are more complex than a simple string for classification tasks. We can also build prompts that consist of multiple message parts. We may include text, audio, or images in these messages, enabling us to construct multimodal evals if the LLM supports multimodal inputs.
By defining a ClassificationTemplate we can construct multi-part and multimodal evaluation templates by combining multiple PromptPartTemplateobjects.
An evaluation prompt can consist of multiple PromptPartTemplate objects
Each PromptPartTemplate can have a different content type
Combine multiple PromptPartTemplate with templating variables to evaluate audio or image inputs
A ClassificationTemplate consists of the following components:
Rails: These are the allowed classification labels for this evaluation task
Template: A list of PromptPartTemplate objects specifying the structure of the evaluation input. Each PromptPartTemplate includes:
content_type: The type of content (e.g., TEXT, AUDIO, IMAGE).
template: The string or object defining the content for that part.
Explanation_Template (optional): This is a separate structure used to generate explanations if explanations are enabled via llm_classify. If not enabled, this component is ignored.
The following example demonstrates how to create a ClassificationTemplate for an intent detection eval for a voice application:
The flexibility of ClassificationTemplate allows users to adapt it for various modalities, such as:
Image Inputs: Replace PromptPartContentType.AUDIO with PromptPartContentType.IMAGE and update the templates accordingly.
Mixed Modalities: Combine TEXT, AUDIO, and IMAGE for multimodal tasks requiring contextualized inputs.
llm_classifyThe llm_classify function can be used to run multimodal evaluations. This function supports input in the following formats:
DataFrame: A DataFrame containing audio or image URLs, base64-encoded strings, and any additional data required for the evaluation.
List: A collection of data items (e.g., audio or image URLs, list of base64 encoded strings).
Public Links: If the data contains URLs for audio or image inputs, they must be publicly accessible for OpenAI to process them directly.
Base64-Encoding: For private or local data, users must encode audio or image files as base64 strings and pass them to the function.
Data Processor (optional): If links are not public and require transformation (e.g., base64 encoding), a data processor can be passed directly to llm_classify to handle the conversion in parallel, ensuring secure and efficient processing.
A data processor enables efficient parallel processing of private or raw data into the required format.
Requirements
Consistent Input/Output: Input and output types should match, e.g., a series to a series for DataFrame processing.
Link Handling: Fetch data from provided links (e.g., cloud storage) and encode it in base64.
Column Consistency: The processed data must align with the columns referenced in the template.
Example: Processing Audio Links
The following is an example of a data processor that fetches audio from Google Cloud Storage, encodes it as base64, and assigns it to the appropriate column:
If your data is already base64-encoded, you can skip that step.
To run an evaluation, use the llm_classify function.
This example:
Continuously queries a LangChain application to send new traces and spans to your Phoenix session
Queries new spans once per minute and runs evals, including:
Hallucination
Q&A Correctness
Relevance
Logs evaluations back to Phoenix so they appear in the UI
The evaluation script is run as a cron job, enabling you to adjust the frequency of the evaluation job:
The above script can be run periodically to augment Evals in Phoenix.
Evals are LLM-powered functions that you can use to evaluate the output of your LLM or generative application
Evaluates a pandas dataframe using a set of user-specified evaluators that assess each row for relevance of retrieved documents, hallucinations, toxicity, etc. Outputs a list of dataframes, one for each evaluator, that contain the labels, scores, and optional explanations from the corresponding evaluator applied to the input dataframe.
dataframe (pandas.DataFrame): A pandas dataframe in which each row represents an individual record to be evaluated. Each evaluator uses an LLM and an evaluation prompt template to assess the rows of the dataframe, and those template variables must appear as column names in the dataframe.
HallucinationEvaluator: Evaluates whether a response (stored under an "output" column) is a hallucination given a query (stored under an "input" column) and one or more retrieved documents (stored under a "reference" column).
RelevanceEvaluator: Evaluates whether a retrieved document (stored under a "reference" column) is relevant or irrelevant to the corresponding query (stored under an "input" column).
ToxicityEvaluator: Evaluates whether a string (stored under an "input" column) contains racist, sexist, chauvinistic, biased, or otherwise toxic content.
QAEvaluator: Evaluates whether a response (stored under an "output" column) is correct or incorrect given a query (stored under an "input" column) and one or more retrieved documents (stored under a "reference" column).
SummarizationEvaluator: Evaluates whether a summary (stored under an "output" column) provides an accurate synopsis of an input document (stored under an "input" column).
SQLEvaluator: Evaluates whether a generated SQL query (stored under the "query_gen" column) and a response (stored under the "response" column) appropriately answer a question (stored under the "question" column).
provide_explanation (bool, optional): If true, each output dataframe will contain an explanation column containing the LLM's reasoning for each evaluation.
use_function_calling_if_available (bool, optional): If true, function calling is used (if available) as a means to constrain the LLM outputs. With function calling, the LLM is instructed to provide its response as a structured JSON object, which is easier to parse.
verbose (bool, optional): If true, prints detailed information such as model invocation parameters, retries on failed requests, etc.
concurrency (int, optional): The number of concurrent workers if async submission is possible. If not provided, a recommended default concurrency is set on a per-model basis.
List[pandas.DataFrame]: A list of dataframes, one for each evaluator, all of which have the same number of rows as the input dataframe.
To use run_evals, you must first wrangle your LLM application data into a pandas dataframe either manually or by querying and exporting the spans collected by your Phoenix session. Once your dataframe is wrangled into the appropriate format, you can instantiate your evaluators by passing the model to be used during evaluation.
Run your evaluations by passing your dataframe and your list of desired evaluators.
Assuming your dataframe contains the "input", "reference", and "output" columns required by HallucinationEvaluator and QAEvaluator, your output dataframes should contain the results of the corresponding evaluator applied to the input dataframe, including columns for labels (e.g., "factual" or "hallucinated"), scores (e.g., 0 for factual labels, 1 for hallucinated labels), and explanations. If your dataframe was exported from your Phoenix session, you can then ingest the evaluations using phoenix.log_evaluations so that the evals will be visible as annotations inside Phoenix.
Class used to store and format prompt templates.
text (str): The raw prompt text used as a template.
delimiters (List[str]): List of characters used to locate the variables within the prompt template text. Defaults to ["{", "}"].
text (str): The raw prompt text used as a template.
variables (List[str]): The names of the variables that, once their values are substituted into the template, create the prompt text. These variable names are automatically detected from the template text using the delimiters passed when initializing the class (see Usage section below).
Define a PromptTemplate by passing a text string and the delimiters to use to locate the variables. The default delimiters are { and }.
If the prompt template variables have been correctly located, you can access them as follows:
The PromptTemplate class can also understand any combination of delimiters. Following the example above, but getting creative with our delimiters:
Once you have a PromptTemplate class instantiated, you can make use of its format method to construct the prompt text resulting from substituting values into the variables. To do so, a dictionary mapping the variable names to the values is passed:
Note that once you initialize the PromptTemplate class, you don't need to worry about delimiters anymore, it will be handled for you.
Classifies each input row of the dataframe using an LLM. Returns a pandas.DataFrame where the first column is named label and contains the classification labels. An optional column named explanation is added when provide_explanation=True.
dataframe (pandas.DataFrame): A pandas dataframe in which each row represents a record to be classified. All template variable names must appear as column names in the dataframe (extra columns unrelated to the template are permitted).
template (ClassificationTemplate, or str): The prompt template as either an instance of PromptTemplate or a string. If the latter, the variable names should be surrounded by curly braces so that a call to .format can be made to substitute variable values.
model (BaseEvalModel): An LLM model class instance
rails (List[str]): A list of strings representing the possible output classes of the model's predictions.
system_instruction (Optional[str]): An optional system message for modals that support it
verbose (bool, optional): If True, prints detailed info to stdout such as model invocation parameters and details about retries and snapping to rails. Default False.
use_function_calling_if_available (bool, default=True): If True, use function calling (if available) as a means to constrain the LLM outputs. With function calling, the LLM is instructed to provide its response as a structured JSON object, which is easier to parse.
pandas.DataFrame: A dataframe where the label column (at column position 0) contains the classification labels. If provide_explanation=True, then an additional column named explanation is added to contain the explanation for each label. The dataframe has the same length and index as the input dataframe. The classification label values are from the entries in the rails argument or "NOT_PARSABLE" if the model's output could not be parsed.
Generates a text using a template using an LLM. This function is useful if you want to generate synthetic data, such as irrelevant responses
dataframe (pandas.DataFrame): A pandas dataframe in which each row represents a record to be used as in input to the template. All template variable names must appear as column names in the dataframe (extra columns unrelated to the template are permitted).
template (Union[PromptTemplate, str]): The prompt template as either an instance of PromptTemplate or a string. If the latter, the variable names should be surrounded by curly braces so that a call to format can be made to substitute variable values.
model (BaseEvalModel): An LLM model class.
system_instruction (Optional[str], optional): An optional system message.
output_parser (Callable[[str, int], Dict[str, Any]], optional): An optional function that takes each generated response and response index and parses it to a dictionary. The keys of the dictionary should correspond to the column names of the output dataframe. If None, the output dataframe will have a single column named "output". Default None.
generations_dataframe (pandas.DataFrame): A dataframe where each row represents the generated output
Below we show how you can use llm_generate to use an llm to generate synthetic data. In this example, we use the llm_generate function to generate the capitals of countries but llm_generate can be used to generate any type of data such as synthetic questions, irrelevant responses, and so on.
llm_generate also supports an output parser so you can use this to generate data in a structured format. For example, if you want to generate data in JSON format, you ca prompt for a JSON object and then parse the output using the json library.
Many LLM applications use a technique called Retrieval Augmented Generation. These applications retrieve data from their knowledge base to help the LLM accomplish tasks with the appropriate context.
However, these retrieval systems can still hallucinate or provide answers that are not relevant to the user's input query. We can evaluate retrieval systems by checking for:
Are there certain types of questions the chatbot gets wrong more often?
Are the documents that the system retrieves irrelevant? Do we have the right documents to answer the question?
Does the response match the provided documents?
Phoenix supports retrievals troubleshooting and evaluation on both traces and inferences, but inferences are currently required to visualize your retrievals using a UMAP. See below on the differences.
Troubleshooting for LLM applications
✅
✅
Follow the entirety of an LLM workflow
✅
🚫 support for spans only
Embeddings Visualizer
🚧 on the roadmap
✅
Debug your Search and Retrieval LLM workflows
This quickstart shows how to start logging your retrievals from your vector datastore to Phoenix and run evaluations.
Follow our tutorial in a notebook with our Langchain and LlamaIndex integrations
LangChain
LlamaIndex
The first thing we need is to collect some sample from your vector store, to be able to compare against later. This is to able to see if some sections are not being retrieved, or some sections are getting a lot of traffic where you might want to beef up your context or documents in that area.
1
Voyager 2 is a spacecraft used by NASA to expl...
[-0.02785328, -0.04709944, 0.042922903, 0.0559...
We also will be logging the prompt/response pairs from the deployed application.
who was the first person that walked on the moon
[-0.0126, 0.0039, 0.0217, ...
[7395, 567965, 323794, ...
[11.30, 7.67, 5.85, ...
Neil Armstrong
In order to run retrieval Evals the following code can be used for quick analysis of common frameworks of LangChain and LlamaIndex.
Once the data is in a dataframe, evaluations can be run on the data. Evaluations can be run on on different spans of data. In the below example we run on the top level spans that represent a single trace.
The Evals are available in dataframe locally and can be materilazed back to the Phoenix UI, the Evals are attached to the referenced SpanIDs.
The snipit of code above links the Evals back to the spans they were generated against.
The calculation is done using the LLM Eval on all chunks returned for the span and the log_evaluations connects the Evals back to the original spans.
Observability for all model types (LLM, NLP, CV, Tabular)
Phoenix Inferences allows you to observe the performance of your model through visualizing all the model’s inferences in one interactive UMAP view.
This powerful visualization can be leveraged during EDA to understand model drift, find low performing clusters, uncover retrieval issues, and export data for retraining / fine tuning.
The following Quickstart can be executed in a Jupyter notebook or Google Colab.
We will begin by logging just a training set. Then proceed to add a production set for comparison.
Use pip or condato install arize-phoenix. Note that since we are going to do embedding analysis we must also add the embeddings extra.
Phoenix visualizes data taken from pandas dataframe, where each row of the dataframe compasses all the information about each inference (including feature values, prediction, metadata, etc.)
Let’s begin by working with the training set for this model.
Download the dataset and load it into a Pandas dataframe.
Preview the dataframe with train_df.head() and note that each row contains all the data specific to this CV model for each inference.
Before we can log these inferences, we need to define a Schema object to describe them.
The Schema object informs Phoenix of the fields that the columns of the dataframe should map to.
Here we define a Schema to describe our particular CV training set:
Important: The fields used in a Schema will vary depending on the model type that you are working with.
Wrap your train_df and schema train_schema into a Phoenix Inferences object:
We are now ready to launch Phoenix with our Inferences!
Here, we are passing train_ds as the primary inferences, as we are only visualizing one inference set (see Step 6 for adding additional inference sets).
Running this will fire up a Phoenix visualization. Follow in the instructions in the output to view Phoenix in a browser, or in-line in your notebook:
You are now ready to observe the training set of your model!
Optional - try the following exercises to familiarize yourself more with Phoenix:
We will continue on with our CV model example above, and add a set of production data from our model to our visualization.
This will allow us to analyze drift and conduct A/B comparisons of our production data against our training set.
Note that this schema differs slightly from our train_schema above, as our prod_df does not have a ground truth column!
This time, we will include both train_ds and prod_ds when calling launch_app.
Once again, enter your Phoenix app with the new link generated by your session. e.g.
You are now ready to conduct comparative Root Cause Analysis!
Optional - try the following exercises to familiarize yourself more with Phoenix:
Once you have identified datapoints of interest, you can export this data directly from the Phoenix app for further analysis, or to incorporate these into downstream model retraining and finetuning flows.
Once your model is ready for production, you can add Arize to enable production-grade observability. Phoenix works in conjunction with Arize to enable end-to-end model development and observability.
With Arize, you will additionally benefit from:
Being able to publish and observe your models in real-time as inferences are being served, and/or via direct connectors from your table/storage solution
Scalable compute to handle billions of predictions
Ability to set up monitors & alerts
Production-grade observability
Integration with Phoenix for model iteration to observability
Enterprise-grade RBAC and SSO
Experiment with infinite permutations of model versions and filters
How to create Phoenix inferences and schemas for common data formats
This guide shows you how to define Phoenix inferences using your own data.
Once you have a pandas dataframe df containing your data and a schema object describing the format of your dataframe, you can define your Phoenix dataset either by running
or by optionally providing a name for your dataset that will appear in the UI:
As you can see, instantiating your dataset is the easy part. Before you run the code above, you must first wrangle your data into a pandas dataframe and then create a Phoenix schema to describe the format of your dataframe. The rest of this guide shows you how to match your schema to your dataframe with concrete examples.
Let's first see how to define a schema with predictions and actuals (Phoenix's nomenclature for ground truth). The example dataframe below contains inference data from a binary classification model trained to predict whether a user will click on an advertisement. The timestamps are datetime.datetime objects that represent the time at which each inference was made in production.
2023-03-01 02:02:19
0.91
click
click
2023-02-17 23:45:48
0.37
no_click
no_click
2023-01-30 15:30:03
0.54
click
no_click
2023-02-03 19:56:09
0.74
click
click
2023-02-24 04:23:43
0.37
no_click
click
This schema defines predicted and actual labels and scores, but you can run Phoenix with any subset of those fields, e.g., with only predicted labels.
Phoenix accepts not only predictions and ground truth but also input features of your model and tags that describe your data. In the example below, features such as FICO score and merchant ID are used to predict whether a credit card transaction is legitimate or fraudulent. In contrast, tags such as age and gender are not model inputs, but are used to filter your data and analyze meaningful cohorts in the app.
578
Scammeds
4300
62966
RENT
110
0
0
25
male
not_fraud
fraud
507
Schiller Ltd
21000
52335
RENT
129
0
23
78
female
not_fraud
not_fraud
656
Kirlin and Sons
18000
94995
MORTGAGE
31
0
0
54
female
uncertain
uncertain
414
Scammeds
18000
32034
LEASE
81
2
0
34
male
fraud
not_fraud
512
Champlin and Sons
20000
46005
OWN
148
1
0
49
male
uncertain
uncertain
If your data has a large number of features, it can be inconvenient to list them all. For example, the breast cancer dataset below contains 30 features that can be used to predict whether a breast mass is malignant or benign. Instead of explicitly listing each feature, you can leave the feature_column_names field of your schema set to its default value of None, in which case, any columns of your dataframe that do not appear in your schema are implicitly assumed to be features.
malignant
benign
15.49
19.97
102.40
744.7
0.11600
0.15620
0.18910
0.09113
0.1929
0.06744
0.6470
1.3310
4.675
66.91
0.007269
0.02928
0.04972
0.01639
0.01852
0.004232
21.20
29.41
142.10
1359.0
0.1681
0.3913
0.55530
0.21210
0.3187
0.10190
malignant
malignant
17.01
20.26
109.70
904.3
0.08772
0.07304
0.06950
0.05390
0.2026
0.05223
0.5858
0.8554
4.106
68.46
0.005038
0.01503
0.01946
0.01123
0.02294
0.002581
19.80
25.05
130.00
1210.0
0.1111
0.1486
0.19320
0.10960
0.3275
0.06469
malignant
malignant
17.99
10.38
122.80
1001.0
0.11840
0.27760
0.30010
0.14710
0.2419
0.07871
1.0950
0.9053
8.589
153.40
0.006399
0.04904
0.05373
0.01587
0.03003
0.006193
25.38
17.33
184.60
2019.0
0.1622
0.6656
0.71190
0.26540
0.4601
0.11890
benign
benign
14.53
13.98
93.86
644.2
0.10990
0.09242
0.06895
0.06495
0.1650
0.06121
0.3060
0.7213
2.143
25.70
0.006133
0.01251
0.01615
0.01136
0.02207
0.003563
15.80
16.93
103.10
749.9
0.1347
0.1478
0.13730
0.10690
0.2606
0.07810
benign
benign
10.26
14.71
66.20
321.6
0.09882
0.09159
0.03581
0.02037
0.1633
0.07005
0.3380
2.5090
2.394
19.33
0.017360
0.04671
0.02611
0.01296
0.03675
0.006758
10.88
19.48
70.89
357.1
0.1360
0.1636
0.07162
0.04074
0.2434
0.08488
You can tell Phoenix to ignore certain columns of your dataframe when implicitly inferring features by adding those column names to the excluded_column_names field of your schema. The dataframe below contains all the same data as the breast cancer dataset above, in addition to "hospital" and "insurance_provider" fields that are not features of your model. Explicitly exclude these fields, otherwise, Phoenix will assume that they are features.
malignant
benign
Pacific Clinics
uninsured
15.49
19.97
102.40
744.7
0.11600
0.15620
0.18910
0.09113
0.1929
0.06744
0.6470
1.3310
4.675
66.91
0.007269
0.02928
0.04972
0.01639
0.01852
0.004232
21.20
29.41
142.10
1359.0
0.1681
0.3913
0.55530
0.21210
0.3187
0.10190
malignant
malignant
Queens Hospital
Anthem Blue Cross
17.01
20.26
109.70
904.3
0.08772
0.07304
0.06950
0.05390
0.2026
0.05223
0.5858
0.8554
4.106
68.46
0.005038
0.01503
0.01946
0.01123
0.02294
0.002581
19.80
25.05
130.00
1210.0
0.1111
0.1486
0.19320
0.10960
0.3275
0.06469
malignant
malignant
St. Francis Memorial Hospital
Blue Shield of CA
17.99
10.38
122.80
1001.0
0.11840
0.27760
0.30010
0.14710
0.2419
0.07871
1.0950
0.9053
8.589
153.40
0.006399
0.04904
0.05373
0.01587
0.03003
0.006193
25.38
17.33
184.60
2019.0
0.1622
0.6656
0.71190
0.26540
0.4601
0.11890
benign
benign
Pacific Clinics
Kaiser Permanente
14.53
13.98
93.86
644.2
0.10990
0.09242
0.06895
0.06495
0.1650
0.06121
0.3060
0.7213
2.143
25.70
0.006133
0.01251
0.01615
0.01136
0.02207
0.003563
15.80
16.93
103.10
749.9
0.1347
0.1478
0.13730
0.10690
0.2606
0.07810
benign
benign
CityMed
Anthem Blue Cross
10.26
14.71
66.20
321.6
0.09882
0.09159
0.03581
0.02037
0.1633
0.07005
0.3380
2.5090
2.394
19.33
0.017360
0.04671
0.02611
0.01296
0.03675
0.006758
10.88
19.48
70.89
357.1
0.1360
0.1636
0.07162
0.04074
0.2434
0.08488
Embedding features consist of vector data in addition to any unstructured data in the form of text or images that the vectors represent. Unlike normal features, a single embedding feature may span multiple columns of your dataframe. Use px.EmbeddingColumnNames to associate multiple dataframe columns with the same embedding feature.
To define an embedding feature, you must at minimum provide Phoenix with the embedding vector data itself. Specify the dataframe column that contains this data in the vector_column_name field on px.EmbeddingColumnNames. For example, the dataframe below contains tabular credit card transaction data in addition to embedding vectors that represent each row. Notice that:
Unlike other fields that take strings or lists of strings, the argument to embedding_feature_column_names is a dictionary.
The key of this dictionary, "transaction_embedding," is not a column of your dataframe but is name you choose for your embedding feature that appears in the UI.
The values of this dictionary are instances of px.EmbeddingColumnNames.
Each entry in the "embedding_vector" column is a list of length 4.
fraud
not_fraud
[-0.97, 3.98, -0.03, 2.92]
604
Leannon Ward
22000
100781
RENT
108
0
0
fraud
not_fraud
[3.20, 3.95, 2.81, -0.09]
612
Scammeds
7500
116184
MORTGAGE
42
2
56
not_fraud
not_fraud
[-0.49, -0.62, 0.08, 2.03]
646
Leannon Ward
32000
73666
RENT
131
0
0
not_fraud
not_fraud
[1.69, 0.01, -0.76, 3.64]
560
Kirlin and Sons
19000
38589
MORTGAGE
131
0
0
uncertain
uncertain
[1.46, 0.69, 3.26, -0.17]
636
Champlin and Sons
10000
100251
MORTGAGE
10
0
3
To compare embeddings, Phoenix uses metrics such as Euclidean distance that can only be computed between vectors of the same length. Ensure that all embedding vectors for a particular embedding feature are one-dimensional arrays of the same length, otherwise, Phoenix will throw an error.
If your embeddings represent images, you can provide links or local paths to image files you want to display in the app by using the link_to_data_column_name field on px.EmbeddingColumnNames. The following example contains data for an image classification model that detects product defects on an assembly line.
okay
https://www.example.com/image0.jpeg
[1.73, 2.67, 2.91, 1.79, 1.29]
defective
https://www.example.com/image1.jpeg
[2.18, -0.21, 0.87, 3.84, -0.97]
okay
https://www.example.com/image2.jpeg
[3.36, -0.62, 2.40, -0.94, 3.69]
defective
https://www.example.com/image3.jpeg
[2.77, 2.79, 3.36, 0.60, 3.10]
okay
https://www.example.com/image4.jpeg
[1.79, 2.06, 0.53, 3.58, 0.24]
For local image data, we recommend the following steps to serve your images via a local HTTP server:
In your terminal, navigate to a directory containing your image data and run python -m http.server 8000.
Add URLs of the form "http://localhost:8000/rel/path/to/image.jpeg" to the appropriate column of your dataframe.
For example, suppose your HTTP server is running in a directory with the following contents:
Then your image URL would be http://localhost:8000/image-data/example_image.jpeg.
If your embeddings represent pieces of text, you can display that text in the app by using the raw_data_column_name field on px.EmbeddingColumnNames. The embeddings below were generated by a sentiment classification model trained on product reviews.
Magic Lamp
Makes a great desk lamp!
[2.66, 0.89, 1.17, 2.21]
office
positive
Ergo Desk Chair
This chair is pretty comfortable, but I wish it had better back support.
[3.33, 1.14, 2.57, 2.88]
office
neutral
Cloud Nine Mattress
I've been sleeping like a baby since I bought this thing.
[2.5, 3.74, 0.04, -0.94]
bedroom
positive
Dr. Fresh's Spearmint Toothpaste
Avoid at all costs, it tastes like soap.
[1.78, -0.24, 1.37, 2.6]
personal_hygiene
negative
Ultra-Fuzzy Bath Mat
Cheap quality, began fraying at the edges after the first wash.
[2.71, 0.98, -0.22, 2.1]
bath
negative
Sometimes it is useful to have more than one embedding feature. The example below shows a multi-modal application in which one embedding represents the textual description and another embedding represents the image associated with products on an e-commerce site.
Magic Lamp
Enjoy the most comfortable setting every time for working, studying, relaxing or getting ready to sleep.
[2.47, -0.01, -0.22, 0.93]
https://www.example.com/image0.jpeg
[2.42, 1.95, 0.81, 2.60, 0.27]
Ergo Desk Chair
The perfect mesh chair, meticulously developed to deliver maximum comfort and high quality.
[-0.25, 0.07, 2.90, 1.57]
https://www.example.com/image1.jpeg
[3.17, 2.75, 1.39, 0.44, 3.30]
Cloud Nine Mattress
Our Cloud Nine Mattress combines cool comfort with maximum affordability.
[1.36, -0.88, -0.45, 0.84]
https://www.example.com/image2.jpeg
[-0.22, 0.87, 1.10, -0.78, 1.25]
Dr. Fresh's Spearmint Toothpaste
Natural toothpaste helps remove surface stains for a brighter, whiter smile with anti-plaque formula
[-0.39, 1.29, 0.92, 2.51]
https://www.example.com/image3.jpeg
[1.95, 2.66, 3.97, 0.90, 2.86]
Ultra-Fuzzy Bath Mat
The bath mats are made up of 1.18-inch height premium thick, soft and fluffy microfiber, making it great for bathroom, vanity, and master bedroom.
[0.37, 3.22, 1.29, 0.65]
https://www.example.com/image4.jpeg
[0.77, 1.79, 0.52, 3.79, 0.47]
How to import prompt and response from Large Large Model (LLM)
Below shows a relevant subsection of the dataframe. The embedding of the prompt is also shown.
who was the first person that walked on the moon
[-0.0126, 0.0039, 0.0217, ...
Neil Alden Armstrong
who was the 15th prime minister of australia
[0.0351, 0.0632, -0.0609, ...
Francis Michael Forde
Define the inferences by pairing the dataframe with the schema.
How to import data for the Retrieval-Augmented Generation (RAG) use case
who was the first person that walked on the moon
[-0.0126, 0.0039, 0.0217, ...
[7395, 567965, 323794, ...
[11.30, 7.67, 5.85, ...
who was the 15th prime minister of australia
[0.0351, 0.0632, -0.0609, ...
[38906, 38909, 38912, ...
[11.28, 9.10, 8.39, ...
why is amino group in aniline an ortho para di...
[-0.0431, -0.0407, -0.0597, ...
[779579, 563725, 309367, ...
[-10.89, -10.90, -10.94, ...
Both the retrievals and scores are grouped under prompt_column_names along with the embedding of the query.
Define the inferences by pairing the dataframe with the schema.
How to create Phoenix inferences and schemas for the corpus data
Below is an example dataframe containing Wikipedia articles along with its embedding vector.
1
Voyager 2 is a spacecraft used by NASA to expl...
[-0.02785328, -0.04709944, 0.042922903, 0.0559...
2
The Staturn Nebula is a planetary nebula in th...
[0.03544901, 0.039175965, 0.014074919, -0.0307...
3
Eris is a dwarf planet and a trans-Neptunian o...
[0.05506449, 0.0031612846, -0.020452883, -0.02...
Below is an appropriate schema for the dataframe above. It specifies the id column and that embedding belongs to text. Other columns, if exist, will be detected automatically, and need not be specified by the schema.
Define the inferences by pairing the dataframe with the schema.
Phoenix is an open-source observability tool designed for experimentation, evaluation, and troubleshooting of AI and LLM applications. It allows AI engineers and data scientists to quickly visualize their data, evaluate performance, track down issues, and export data to improve. Phoenix is built by , the company behind the industry-leading AI observability platform, and a set of core contributors.
Phoenix works with OpenTelemetry and instrumentation. See Integrations: Tracing for details.
Phoenix offers tools to workflow.
- Create, store, modify, and deploy prompts for interacting with LLMs
- Play with prompts, models, invocation parameters and track your progress via tracing and experiments
- Replay the invocation of an LLM. Whether it's an LLM step in an LLM workflow or a router query, you can step into the LLM invocation and see if any modifications to the invocation would have yielded a better outcome.
- Phoenix offers client SDKs to keep your prompts in sync across different applications and environments.
Learn more about options.
If you are set up, see to start using Phoenix in your preferred environment.
provides free-to-use Phoenix instances that are preconfigured for you with 10GBs of storage space. Phoenix Cloud instances are a great starting point, however if you need more storage or more control over your instance, self-hosting options could be a better fit.
See .
Tracing is a helpful tool for understanding how your LLM application works. Phoenix offers comprehensive tracing capabilities that are not tied to any specific LLM vendor or framework. Phoenix accepts traces over the OpenTelemetry protocol (OTLP) and supports first-class instrumentation for a variety of frameworks ( , ,), SDKs (, , , ), and Languages. (Python, Javascript, etc.)
To get started, check out the .
Read more about and
Check out the for specific tutorials.
Use to mark functions and code blocks.
Use to capture all calls made to supported frameworks.
Use instrumentation. Supported in and
Use to mark functions and code blocks.
Use to capture all calls made to supported frameworks.
Use instrumentation. Supported in and , among many other languages.
Sign up for an Arize Phoenix account at
Grab your API key from the Keys option on the left bar.
In your code, set your endpoint and API key:
Having trouble finding your endpoint? Check out
Run Phoenix using Docker, local terminal, Kubernetes etc. For more information, .
In your code, set your endpoint:
Having trouble finding your endpoint? Check out
Phoenix can also capture all calls made to supported libraries automatically. Just install the :
Explore tracing
View use cases to see
Use to capture all calls made to supported frameworks.
Use instrumentation. Supported in and , among many other languages.
Sign up for an Arize Phoenix account at
Run Phoenix using Docker, local terminal, Kubernetes etc. For more information, see .
Starting with Node v22, Node can . If this is not supported in your runtime, ensure that you can compile your TypeScript files to JavaScript, or use JavaScript instead.
Phoenix can capture all calls made to supported libraries automatically. Just install the :
Explore tracing
View use cases to see
Setup Tracing in or
Add Integrations via
your application
Phoenix natively works with a variety of frameworks and SDKs across and via OpenTelemetry auto-instrumentation. Phoenix can also be natively integrated with AI platforms such as and .
Using .
Using .
See for an end-to-end example of a manually instrumented application.
Let's next install the package so that we can construct spans with LLM semantic conventions:
If you need to add or then it's less convenient to use a decorator.
Semantic attributes are pre-defined attributes that are well-known naming conventions for common kinds of data. Using semantic attributes lets you normalize this kind of information across your systems. In the case of Phoenix, the package provides a set of well-known attributes that are used to represent LLM application specific semantic conventions.
The OpenInference Tracer shown above respects context Managers for &
Phoenix is written and maintained in Python to make it natively runnable in Python notebooks. However, it can be stood up as a trace collector so that your LLM traces from your NodeJS application (e.g., LlamaIndex.TS, Langchain.js) can be collected. The traces collected by Phoenix can then be downloaded to a Jupyter notebook and used to run evaluations (e.g., , Ragas).
Phoenix natively supports automatic instrumentation provided by OpenInference. For more details on OpenInference, checkout the on GitHub.
To enable in your app, you’ll need to have an initialized .
As shown above with OpenAI, you can register additional instrumentation libraries with the OpenTelemetry provider in order to generate telemetry data for your dependencies. For more information, see .
The following code assumes you have Phoenix running locally, on its default port of 6006. See our documentation if you'd like to learn more about running Phoenix.
Learn more by visiting the Node.js documentation on and or see our documentation for an end to end example.
The values of instrumentation-scope-name and instrumentation-scope-version should uniquely identify the , such as the package, module or class name. While the name is required, the version is still recommended despite being optional.
Now that you have initialized, you can create .
: Starts a new span without setting it on context.
: Starts a new span and calls the given callback function passing it the created span as first argument. The new span gets set in context and this context is activated for the duration of the function call.
Sometimes it’s helpful to do something with the current/active at a particular point in program execution.
It can also be helpful to get the from a given context that isn’t necessarily the active span.
let you attach key/value pairs to a so it carries more information about the current operation that it’s tracking. For OpenInference related attributes, use the @arizeai/openinference-semantic-conventions keys. However you are free to add any attributes you'd like!
There are semantic conventions for spans representing operations in well-known protocols like HTTP or database calls. OpenInference also publishes it's own set of semantic conventions related to LLM applications. Semantic conventions for these spans are defined in the specification under . In the simple example of this guide the source code attributes can be used.
A is a human-readable message on an that represents a discrete event with no duration that can be tracked by a single timestamp. You can think of it like a primitive log.
You can also create Span Events with additional
A can be set on a , typically used to specify that a Span has not completed successfully - Error. By default, all spans are Unset, which means a span completed without error. The Ok status is reserved for when you need to explicitly mark a span as successful rather than stick with the default of Unset (i.e., “without error”).
It can be a good idea to record exceptions when they happen. It’s recommended to do this in conjunction with setting .
If you are using LangChain, you can use LangChain's native threads to track sessions! See
In order to customize spans that are created via , The Otel Context can be used to set span attributes created during a block of code (think child spans or spans under that block of code). Our packages offer convenient tools to write and read from the OTel Context. The benefit of this approach is that OpenInference auto will pass (e.g. inherit) these attributes to all spans underneath a parent trace.
*UI support for session, user, and metadata is coming soon in an upcoming phoenix release ()
We provide a using_session context manager to add session a ID to the current OpenTelemetry Context. OpenInference auto will read this Context and pass the session ID as a span attribute, following the OpenInference . Its input, the session ID, must be a non-empty string.
We provide a setSession function which allows you to set a sessionId on context. You can use this utility in conjunction with to set the active context. OpenInference will then pick up these attributes and add them to any spans created within the context.with callback.
We provide a using_user context manager to add user ID to the current OpenTelemetry Context. OpenInference auto will read this Context and pass the user ID as a span attribute, following the OpenInference . Its input, the user ID, must be a non-empty string.
We provide a setUser function which allows you to set a userId on context. You can use this utility in conjunction with to set the active context. OpenInference will then pick up these attributes and add them to any spans created within the context.with callback.
We provide a using_metadata context manager to add metadata to the current OpenTelemetry Context. OpenInference auto will read this Context and pass the metadata as a span attribute, following the OpenInference . Its input, the metadata, must be a dictionary with string keys. This dictionary will be serialized to JSON when saved to the OTEL Context and remain a JSON string when sent as a span attribute.
We provide a setMetadata function which allows you to set a metadata attributes on context. You can use this utility in conjunction with to set the active context. OpenInference will then pick up these attributes and add them to any spans created within the context.with callback. Metadata attributes will be serialized to a JSON string when stored on context and will be propagated to spans in the same way.
We provide a using_tags context manager to add tags to the current OpenTelemetry Context. OpenInference auto will read this Context and pass the tags as a span attribute, following the OpenInference . The input, the tag list, must be a list of strings.
We provide a setTags function which allows you to set a list of string tags on context. You can use this utility in conjunction with to set the active context. OpenInference will then pick up these attributes and add them to any spans created within the context.with callback. Tags, like metadata, will be serialized to a JSON string when stored on context and will be propagated to spans in the same way.
We provide a using_attributes context manager to add attributes to the current OpenTelemetry Context. OpenInference auto will read this Context and pass the attributes fields as span attributes, following the OpenInference . This is a convenient context manager to use if you find yourself using many of the previous ones in conjunction.
We provide a setAttributes function which allows you to add a set of attributes to context. You can use this utility in conjunction with to set the active context. OpenInference will then pick up these attributes and add them to any spans created within the context.with callback. Attributes set on context using setAttributes must be valid span .
You can also use setAttributes in conjunction with the to set OpenInference attributes manually.
Instrumenting prompt templates and variables allows you to track and visualize prompt changes. These can also be combined with to measure the performance changes driven by each of your prompts.
We provide a using_prompt_template context manager to add a prompt template (including its version and variables) to the current OpenTelemetry Context. OpenInference will read this Context and pass the prompt template fields as span attributes, following the OpenInference . Its inputs must be of the following type:
Template: non-empty string.
Version: non-empty string.
Variables: a dictionary with string keys. This dictionary will be serialized to JSON when saved to the OTEL Context and remain a JSON string when sent as a span attribute.
It can also be used as a decorator:
template - a string with templated variables ex. "hello {{name}}"
variables - an object with variable names and their values ex. {name: "world"}
version - a string version of the template ex. v1.0
All of these are optional. Application of variables to a template will typically happen before the call to an llm and may not be picked up by auto instrumentation. So, this can be helpful to add to ensure you can see the templates and variables while troubleshooting.
This process is similar to the , but instead of creating your own dataset or using an existing external one, you'll export a trace dataset from Phoenix and log the evaluation results to Phoenix.
Phoenix's
Your own
If you're interested in more complex evaluation and evaluators, start with
If you're ready to start testing your application in a more rigorous manner, check out
An evaluation must have a name (e.g. "Q&A Correctness") and its DataFrame must contain identifiers for the subject of evaluation, e.g. a span or a document (more on that below), and values under either the score, label, or explanation columns. See for more information.
Phoenix supports loading data that contains . This allows you to load an existing dataframe of traces into your Phoenix instance.
Usually these will be traces you've previously saved using .
By default all queries are executed against the default project or the project set via the PHOENIX_PROJECT_NAME environment variable. If you choose to pull from a different project, all methods on the have an optional parameter named project_name
Note that this DataFrame can be used directly as input for the .
We can accomplish this with a simple query as follows. Also see for a helper function executing this query.
In addition to the document content, if we also want to explode the document score, we can simply add the document.score attribute to the .explode() method alongside document.content as follows. Keyword arguments are necessary to name the output columns, and in this example we name the output columns as reference and score. (Python's double-asterisk unpacking idiom can be used to specify arbitrary output names containing spaces or symbols. See for an example.)
Filtering spans by evaluation results, e.g. score or label, can be done via a special syntax. The name of the evaluation is specified as an indexer on the special keyword evals. The example below filters for spans with the incorrect label on their correctness evaluations. (See for how to compute evaluations for traces, and for how to ingest those results back to Phoenix.)
You can also use Python boolean expressions to filter spans in the Phoenix UI. These expressions can be entered directly into the search bar above your experiment runs, allowing you to apply complex conditions involving span attributes. Any expressions that work with the .where() method can also be used in the UI.
The document contents can also be concatenated together. The query below concatenates the list of document.content with (double newlines), which is the default separator. Keyword arguments are necessary to name the output columns, and in this example we name the output column as reference. (Python's double-asterisk unpacking idiom can be used to specify arbitrary output names containing spaces or symbols. See for an example.)
To do this, we would provide two queries to Phoenix which will return two simultaneous dataframes that can be joined together by pandas. The query_for_child_spans uses parent_id as index as shown in , and px.Client().query_spans() returns a list of dataframes when multiple queries are given.
To learn more about extracting span attributes, see .
To extract the dataframe input for , we can apply the query described in the , or leverage the function implementing the same query.
To extract the dataframe input to the , we can use a function or use the following query (which is what's inside the helper function). This query applies techniques described in the section.
The query shown in the example can be done more simply with a helper function as follows. The output DataFrame can be used directly as input for the .
To extract the dataframe input to the , we can use the following helper function.
The output DataFrame would look something like the one below. The input contains contains the question, the output column contains the answer, and the reference column contains a concatenation of all the retrieved documents. This helper function assumes that the questions and answers are the input.value and output.value attributes of the root spans, and the list of retrieved documents are contained in a direct child span of the root span. (The helper function applies the techniques described in the section.)
- Create, store, modify, and deploy prompts for interacting with LLMs
- Play with prompts, models, invocation parameters and track your progress via tracing and experiments
- Replay the invocation of an LLM. Whether it's an LLM step in an LLM workflow or a router query, you can step into the LLM invocation and see if any modifications to the invocation would have yielded a better outcome.
- Phoenix offers client SDKs to keep your prompts in sync across different applications and environments.
Phoenix's Prompt Playground makes the process of iterating and testing prompts quick and easy. Phoenix's playground supports (OpenAI, Anthropic, Gemini, Azure) as well as custom model endpoints, making it the ideal prompt IDE for you to build experiment and evaluate prompts and models for your task.
Speed: Rapidly test variations in the , model, invocation parameters, , and output format.
Reproducibility: All runs of the playground are , unlocking annotations and evaluation.
Datasets: Use as a fixture to run a prompt variant through its paces and to evaluate it systematically.
Prompt Management: directly within the playground.
prompts dynamically
templates by name, version, or tag
templates with runtime variables and use them in your code. Native support for OpenAI, Anthropic, Gemini, Vercel AI SDK, and more. No propriatry client necessary.
Support for and Execute tools defined within the prompt. Phoenix prompts encompasses more than just the text and messages.
Prompts in Phoenix can be created, iterated on, versioned, tagged, and used either via the UI or our Python/TS SDKs. The UI option also includes our , which allows you to compare prompt variations side-by-side in the Phoenix UI.
It looks like the second option is doing the most concise summary. Go ahead and .
Prompt playground can be used to run a series of dataset rows through your prompts. To start off, we'll need a dataset. Phoenix has many options to , to keep things simple here, we'll directly upload a CSV. Download the articles summaries file linked below:
From here, you could to test its performance, or add complexity to your prompts by including different tools, output schemas, and models to test against.
Having trouble finding your Phoenix endpoint? Check out
How to use your prompts in
Prompt iteration
First, install the :
The Phoenix client natively supports passing your prompts to OpenAI, Anthropic, and the.
Take a look a the TypeScript examples in the Phoenix client ()
Try out some Deno notebooks to experiment with prompts ()
If there is a LLM endpoint you would like to use, reach out to
The prompt editor (typically on the left side of the screen) is where you define the . You select the template language (mustache or f-string) on the toolbar. Whenever you type a variable placeholder in the prompt (say {{question}} for mustache), the variable to fill will show up in the inputs section. Input variables must either be filled in by hand or can be filled in via a dataset (where each row has key / value pairs for the input).
Phoenix lets you run a prompt (or multiple prompts) on a dataset. Simply containing the input variables you want to use in your prompt template. When you click Run, Phoenix will apply each configured prompt to every example in the dataset, invoking the LLM for all possible prompt-example combinations. The result of your playground runs will be tracked as an experiment under the loaded dataset (see Playground Traces)
The is like the IDE where you will develop your prompt. The prompt section on the right lets you add more messages, change the template format (f-string or mustache), and an output schema (JSON mode).
To view the details of a prompt, click on the prompt name. You will be taken to the prompt details view. The prompt details view shows all the that has been saved (e.x. the model used, the invocation parameters, etc.)
Once you've crated a prompt, you probably need to make tweaks over time. The best way to make tweaks to a prompt is using the playground. Depending on how destructive a change you are making you might want to just create a new or the prompt.
Prompt labels and metadata is still
Starting with prompts, Phoenix has a dedicated client that lets you programmatically. Make sure you have installed the appropriate before proceeding.
phoenix-client for both Python and TypeScript are very early in it's development and may not have every feature you might be looking for. Please drop us an issue if there's an enhancement you'd like to see.
If a version is with, e.g. "production", it can retrieved as follows.
If a version is with, e.g. "production", it can retrieved as follows.
Playground integrates with to help you iterate and incrementally improve your prompts. Experiment runs are automatically recorded and available for subsequent evaluation to help you understand how changes to your prompts, LLM model, or invocation parameters affect performance.
Sometimes you may want to test a prompt and run evaluations on a given prompt. This can be particularly useful when custom manipulation is needed (e.x. you are trying to iterate on a system prompt on a variety of different chat messages). This tutorial is coming soon
There are three major ways pull prompts, pull by (latest), pull by version, and pull by tag.
Pulling by prompt by is most useful when you want a particular version of a prompt to be automatically used in a specific environment (say "staging"). To pull prompts by tag, you must Tag a prompt in the UI first.
The phoenix clients support formatting the prompt with variables, and providing the messages, model information, , and response format (when applicable).
Sign up for an Arize Phoenix account at
Run Phoenix using Docker, local terminal, Kubernetes etc. For more information, .
- want to fine tune an LLM for better accuracy and cost? Export llm examples for fine-tuning.
- have some good examples to use for benchmarking of llms using OpenAI evals? export to OpenAI evals format.
When manually creating a dataset (let's say collecting hypothetical questions and answers), the easiest way to start is by using a spreadsheet. Once you've collected the information, you can simply upload the CSV of your data to the Phoenix platform using the UI. You can also programmatically upload tabular data using Pandas as
Evals provide a framework for evaluating large language models (LLMs) or systems built using LLMs. OpenAI Evals offer an existing registry of evals to test different dimensions of OpenAI models and the ability to write your own custom evals for use cases you care about. You can also use your data to build private evals. Phoenix can natively export the OpenAI Evals format as JSONL so you can use it with OpenAI Evals. See for details.
The standard for evaluating text is human labeling. However, high-quality LLM outputs are becoming cheaper and faster to produce, and human evaluation cannot scale. In this context, evaluating the performance of LLM applications is best tackled by using a LLM. The Phoenix is designed for simple, fast, and accurate .
Pre-built evals - Phoenix provides pre-tested eval templates for common tasks such as RAG and function calling. Learn more about pretested templates . Each eval is pre-tested on a variety of eval models. Find the most up-to-date template on .
Run evals on your own data - takes a dataframe as its primary input and output, making it easy to run evaluations on your own data - whether that's logs, traces, or datasets downloaded for benchmarking.
Built-in Explanations - All Phoenix evaluations include an that requires eval models to explain their judgment rationale. This boosts performance and helps you understand and improve your eval.
- Phoenix let's you configure which foundation model you'd like to use as a judge. This includes OpenAI, Anthropic, Gemini, and much more. See Eval Models
You can evaluate the individual skills and response using normal LLM evaluation strategies, such as , , , or .
See our for an implementation example.
See our for a specific example.
and for RAG skills
and
See our for a specific example.
See our for a specific example.
For an example of using these evals in combination, see . You can also review our .
Provided you started from a trace dataset, you can log your evaluation results to Phoenix using .
(llm_classify)
(llm_generate)
All evals templates are tested against golden data that are available as part of the LLM eval library's and target precision at 70-90% and F1 at 70-85%.
We currently support a growing set of models for LLM Evals, please check out the .
We are continually iterating our templates, view the most up-to-date template .
This benchmark was obtained using notebook below. It was run using the as a ground truth dataset. Each example in the dataset was evaluating using the HALLUCINATION_PROMPT_TEMPLATE above, then the resulting labels were compared against the is_hallucination label in the HaluEval dataset to generate the confusion matrices below.
We are continually iterating our templates, view the most up-to-date template .
The used was created based on:
Squad 2: The 2.0 version of the large-scale dataset Stanford Question Answering Dataset (SQuAD 2.0) allows researchers to design AI models for reading comprehension tasks under challenging constraints.
We are continually iterating our templates, view the most up-to-date template .
This benchmark was obtained using notebook below. It was run using the as a ground truth dataset. Each example in the dataset was evaluating using the RAG_RELEVANCY_PROMPT_TEMPLATE above, then the resulting labels were compared against the ground truth label in the WikiQA dataset to generate the confusion matrices below.
We are continually iterating our templates, view the most up-to-date template .
This benchmark was obtained using notebook below. It was run using a as a ground truth dataset. Each example in the dataset was evaluating using the SUMMARIZATION_PROMPT_TEMPLATE above, then the resulting labels were compared against the ground truth label in the summarization dataset to generate the confusion matrices below.
We are continually iterating our templates, view the most up-to-date template .
This benchmark was obtained using notebook below. It was run using an as a ground truth dataset. Each example in the dataset was evaluating using the CODE_READABILITY_PROMPT_TEMPLATE above, then the resulting labels were compared against the ground truth label in the benchmark dataset to generate the confusion matrices below.
We are continually iterating our templates, view the most up-to-date template .
This benchmark was obtained using notebook below. It was run using the as a ground truth dataset. Each example in the dataset was evaluating using the TOXICITY_PROMPT_TEMPLATE above, then the resulting labels were compared against the ground truth label in the benchmark dataset to generate the confusion matrices below.
We are continually iterating our templates, view the most up-to-date template .
The follow benchmarking data was gathered by comparing various model results to ground truth data. The ground truth data used was a handcrafted dataset consisting of questions about the Arize platform. That.
REFERENCE LINK:
We are continually iterating our templates, view the most up-to-date template .
This benchmark was obtained using notebook below. It was run using a handcrafted ground truth dataset consisting of questions on the Arize platform. That .
We are continually iterating our templates, view the most up-to-date template .
We are continually iterating our templates, view the most up-to-date template .
We are continually iterating our templates, view the most up-to-date template .
question - the query made to the model. If you've to evaluate, this will the llm.input_messages column in your exported data.
tool_call - information on the tool called and parameters included. If you've to evaluate, this will be the llm.function_call column in your exported data.
This prompt template is heavily inspired by the paper: .
For full details on Azure OpenAI, check out the
You can choose among supported by LiteLLM. Make sure you have set the right environment variables set prior to initializing the model. For additional information about the environment variables for specific model providers visit:
You will need a dataset of results to evaluate. This dataset should be a pandas dataframe. If you are already collecting traces with Phoenix, you can and use them as the dataframe to evaluate:
You can use cron to run evals client-side as your traces and spans are generated, augmenting your dataset with evaluations in an online manner. View the .
evaluators (List[LLMEvaluator]): A list of evaluators to apply to the input dataframe. Each evaluator class accepts a as input, which is used in conjunction with an evaluation prompt template to evaluate the rows of the input dataframe and to output labels, scores, and optional explanations. Currently supported evaluators include:
This example uses OpenAIModel, but you can use any of our .
For an end-to-end example, see the .
provide_explanation (bool, default=False): If True, provides an explanation for each classification label. A column named explanation is added to the output dataframe. Note that this will default to using function calling if available. If the model supplied does not support function calling, llm_classify will need a prompt template that prompts for an explanation. For phoenix's pre-tested eval templates, the template is swapped out for a based template that prompts for an explanation.
Check out our to get started. Look at our to better understand how to troubleshoot and evaluate different kinds of retrieval systems. For a high level overview on evaluation, check out our .
Retrieval Analyzer w/ Embeddings
Traces and Spans
Retrieval Analyzer w/ Embeddings
Traces and Spans
For more details, visit this .
For more details, visit this .
Independent of the framework you are instrumenting, Phoenix traces allow you to get retrieval data in a common dataframe format that follows the specification.
This example shows how to run Q&A and Hallucnation Evals with OpenAI (many other are available including Anthropic, Mixtral/Mistral, Gemini, OpenAI Azure, Bedrock, etc...)
are run on the individual chunks returned on retrieval. In addition to calculating chunk level metrics, Phoenix also calculates MRR and NDCG for the retrieved span.
For this Quickstart, we will show an example of visualizing the inferences from a computer vision model. See example notebooks for all model types .
For examples on how Schema are defined for other model types (NLP, tabular, LLM-based applications), see example notebooks under and .
Checkpoint A.
Note that Phoenix automatically generates clusters for you on your data using a clustering algorithm called HDBSCAN (more information: )
Discuss your answers in our !
In order to visualize drift, conduct A/B model comparisons, or in the case of an information retrieval use case, compare inferences against a , you will need to add a comparison dataset to your visualization.
Read more about comparison dataset Schemas here:
Checkpoint B.
Discuss your answers in our !
See more on exporting data .
Create your and see the full suite of features.
Read more about Embeddings Analysis
Join the to ask questions, share findings, provide feedback, and connect with other developers.
For a conceptual overview of the Phoenix API, including a high-level introduction to the notion of inferences and schemas, see .
For a comprehensive description of phoenix.Dataset and phoenix.Schema, see the .
For a conceptual overview of embeddings, see .
For a comprehensive description of px.EmbeddingColumnNames, see the .
The features in this example are to be the columns of the dataframe that do not appear in the schema.
For the Retrieval-Augmented Generation (RAG) use case, see the section.
See for the Retrieval-Augmented Generation (RAG) use case where relevant documents are retrieved for the question before constructing the context for the LLM.
In Retrieval-Augmented Generation (RAG), the retrieval step returns from a (proprietary) knowledge base (a.k.a. ) a list of documents relevant to the user query, then the generation step adds the retrieved documents to the prompt context to improve response accuracy of the Large Language Model (LLM). The IDs of the retrieval documents along with the relevance scores, if present, can be imported into Phoenix as follows.
Below shows only the relevant subsection of the dataframe. The retrieved_document_ids should matched the ids in the data. Note that for each row, the list under the relevance_scores column have a matching length as the one under the retrievals column. But it's not necessary for all retrieval lists to have the same length.
In , a document is any piece of information the user may want to retrieve, e.g. a paragraph, an article, or a Web page, and a collection of documents is referred to as the corpus. A corpus can provide the knowledge base (of proprietary data) for supplementing a user query in the prompt context to a Large Language Model (LLM) in the Retrieval-Augmented Generation (RAG) use case. Relevant documents are first based on the user query and its embedding, then the retrieved documents are combined with the query to construct an augmented prompt for the LLM to provide a more accurate response incorporating information from the knowledge base. Corpus inferences can be imported into Phoenix as shown below.
The launcher accepts the corpus dataset through corpus= parameter.
is a helpful tool for understanding how your LLM application works. Phoenix's open-source library offers comprehensive tracing capabilities that are not tied to any specific LLM vendor or framework.
Phoenix accepts traces over the OpenTelemetry protocol (OTLP) and supports first-class instrumentation for a variety of frameworks (, ,), SDKs (, , , ), and Languages. (, , etc.)
Phoenix is built to help you and understand their true performance. To accomplish this, Phoenix includes:
A standalone library to on your own datasets. This can be used either with the Phoenix library, or independently over your own data.
into the Phoenix dashboard. Phoenix is built to be agnostic, and so these evals can be generated using Phoenix's library, or an external library like , , or .
to attach human ground truth labels to your data in Phoenix.
let you test different versions of your application, store relevant traces for evaluation and analysis, and build robust evaluations into your development process.
to test and compare different iterations of your application
, or directly upload Datasets from code / CSV
, export them in fine-tuning format, or attach them to an Experiment.
We provide a setPromptTemplate function which allows you to set a template, version, and variables on context. You can use this utility in conjunction with to set the active context. OpenInference will then pick up these attributes and add them to any spans created within the context.with callback. The components of a prompt template are:
Tracing
Prompt Playground
Datasets and Experiments
Evaluation
Inferences


Tracing
Prompt Playground
Datasets and Experiments
Evaluation
Visualizing Inferences

Tracing (Python)
Tracing (TS)


Prompts (Python SDK)
Prompts (TS SDK)
Prompts (UI)


Phoenix Cloud
Connect to a pre-configured, managed Phoenix instance
In a Notebook
Run Phoenix in the notebook as you run experiments
From the Terminal
Run Phoenix via the CLI on your local machine
As a Container
Self-host your own Phoenix


AI vs. Human
Reference Link
User Frustration
SQL Generation
Agent Function Calling
Audio Emotion
Hallucination Eval
Tested on:
Hallucination QA Dataset, Hallucination RAG Dataset
Q&A Eval
Tested on:
WikiQA
Retrieval Eval
Tested on:
MS Marco, WikiQA
Summarization Eval
Tested on:
GigaWorld, CNNDM, Xsum
Code Generation Eval
Tested on:
WikiSQL, HumanEval, CodeXGlu
Toxicity Eval
Tested on:
WikiToxic