Signal and managed agents are generally available: Continuous monitoring and automated fix proposals
July 29, 2026New AgentsSignal reviews your production traces on a schedule, groups recurring failures into ranked issues, and writes each one up with the supporting evidence, a likely cause, and a proposed fix. The telemetry you already collect becomes an input that an agent can act on rather than something only a human reads. With a repository connected, a managed agent carries that investigation into your codebase, proposes the change, and opens a pull request. The cause and the proposed change are already written when you open the pull request, you just need to decide whether to ship rather than where to start.Signal and managed agents are now live in both the US and EU regions, with Signal included on every plan and managed agents available on Enterprise.
- Bring your own Anthropic key — mark an Anthropic provider as eligible for agents, then use it on individual presets, on Signal, or as the space-wide default. Enterprises that require customer-owned keys only can request that Arize disable the Arize-managed integration.
- Custom roles for managed agents — grant
MANAGED_AGENT_READ,MANAGED_AGENT_CREATE,MANAGED_AGENT_UPDATE, andMANAGED_AGENT_DELETEindependently to separate who can view agent runs from who can start them. - Slack for managed agents — connect Slack and bind managed agents to the channels where your team already works.
- Skills for Agent-as-a-Judge — attach account-level skills to Agent-as-a-Judge evaluators.
Bind one service key across multiple organizations and spaces
July 29, 2026New SDKs and REST APIsA single service key can now be bound to several organizations and spaces at once, each with its own predefined or custom role, instead of being limited to one space per key. CI pipelines, agents, and integrations that operate across several teams can run on one credential with per-scope roles, full RBAC checks at every scope, and a revocation that covers every bound space, which leaves you with fewer credentials to rotate and a cleaner audit trail.Create a multi-binding key under Settings → Service Keys, or programmatically through the REST v2 API, the Python and Go SDKs, and the AX CLI. The code example below creates one key bound to two organizations, with a predefined role in each space of the first and a custom role in the second:Score traces with your own remote evaluators on Enterprise accounts
July 27, 2026New EvaluatorsRemote evaluators are now enabled for all Enterprise accounts. Register an HTTP endpoint you host, and Arize AX queries the span data, calls your endpoint, and joins the returned scores and labels back onto your traces, so you keep the scoring logic while the platform handles querying, scheduling, retries, error handling, and monitoring.- Your own systems and dependencies — the endpoint runs in your environment, so it can call your databases, internal APIs, and any library live, including packages that are not available to code evaluations in Arize AX.
- Proprietary and non-LLM scorers — return a structured score or label from rule-based checks, machine learning models, or an internal gateway, with no need to conform to a supported LLM provider format.
- External eval services — wrap a third-party scorer and still get Arize AX orchestration and analytics around the results.
- Compliance and data residency — evaluation runs on your own infrastructure, and any auth tokens or secret headers you configure are encrypted at rest and masked in the UI.
label, a score, or both. The code example below is a complete evaluator endpoint that satisfies the contract:Find your data region’s OTLP and Flight endpoints in settings
July 27, 2026New Tracing and SessionsA new Personal settings page brings your profile, appearance, and connection details into one place. Under Data Region, you can now copy the exact OTLP HTTP, OTLP gRPC, and Flight endpoints for the region your account is connected to, so you can point your OpenTelemetry exporter at the right host without looking it up or asking support.- Connection endpoints — copy your region’s OTLP HTTP, OTLP gRPC, and Flight endpoints straight from the Data Region section.
- Personal preferences — switch between light, dark, and system themes, set your display time zone independently of the active time range, and change your password.
Run Claude Opus 5 in the Playground, Prompt Hub, and evaluators
July 24, 2026New Models and IntegrationsSelect Claude Opus 5 from the model picker to prototype prompts, run experiments, and score traces with Anthropic’s latest frontier model. It’s available through the direct Anthropic API as well as AWS Bedrock and Google Vertex AI, and runs with adaptive extended thinking for complex reasoning.- Anthropic —
claude-opus-5 - AWS Bedrock —
us.anthropic.claude-opus-5andglobal.anthropic.claude-opus-5 - Vertex AI —
claude-opus-5@default
Fixes and improvements
July 23–29, 2026Models and Integrations- Fix Sort the ML Models list page by name, volume, or created date again.
- Fix Run models on custom OpenAI-compatible endpoints that require
max_completion_tokensin the Playground, which now sends the token limit these endpoints expect.
- Fix Align an evaluator in Alyx reliably, with the evaluator loaded into the Playground before alignment begins.
- Fix View the evaluator list in Alyx for datasets whose evaluation tasks include a code-based evaluator.
- Fix Read experiment evaluation and annotation scores accurately in the comparison view, with non-finite values now rejected at ingest.
- Fix Manage custom OpenAI-compatible model endpoints through the
/v2/integrationsREST API, where they now return with theCUSTOMtype. - Improvement Work with experiments that have no associated dataset in the JavaScript and TypeScript SDK, which now accepts null dataset and version IDs.
- Improvement Grant or revoke API key creation for SAML-mapped users with a new developer-access control on each role mapping.
- Improvement Narrow the user activity view with new exclude filters on source and kind, not just match filters.
Chart dataset and experiment distributions on your dashboards
July 21, 2026New Dashboards and VisualizationsBar chart widgets can now be backed by datasets and experiments, not just project models, so you can visualize how any column, annotation, or evaluation is distributed across a dataset or experiment run directly on your dashboards. Click a bar to drill straight into the underlying dataset examples or the experiment comparison view.Learn more about dashboard widgets.Run Gemini 3.6 Flash and Gemini 3.5 Flash-lite in the Playground and evaluators
July 21, 2026New Models and IntegrationsSelectgemini-3.6-flash and gemini-3.5-flash-lite from the model picker to prototype prompts and score traces with Google’s latest Flash lineup. Both models are available through the direct Gemini and Vertex AI providers, support a 65,536-token maximum output, and accept audio file input.Learn more about model integrations.Manage annotation configs, dataset examples, and restrictions from the CLI
July 21, 2026New CLI CommandsThree new AX CLI commands let you script more of your workspace management: update an existing annotation config, delete specific examples from a dataset version, and list the resource restrictions in your space.The code example below runs each of the three new commands:Review Signal issues across your whole agent fleet
July 21, 2026New AgentsThe Agent Swarms page now surfaces Signal issues from every project in one space-wide view, grouped by severity, so you can triage your agent fleet without opening each project’s Signal tab one at a time. Open any issue to read its investigation and act on it in place, whether you add it to a dataset, create an evaluator, or open a fix PR. When you enable Signal on a project, you can now choose which agent integration runs it instead of defaulting to the Arize-managed runtime.Learn more about Signal.Connect AWS Bedrock, Vertex AI, NVIDIA NIM, and custom endpoints through the REST API
July 20, 2026New Models and IntegrationsThe/v2/integrations REST API now supports four more LLM providers, so you can provision AWS Bedrock, Vertex AI, NVIDIA NIM, and custom OpenAI-compatible endpoints programmatically instead of configuring each one by hand in the UI.The code example below creates a Vertex AI integration through the REST API and the CLI:- REST
- CLI
Save and reuse custom dataset views
July 17, 2026New Datasets and ExperimentsCustom dataset views are now generally available on every account, backed by durable storage so your saved configurations persist across sessions. Capture the columns, filters, and sort order you use most on a dataset’s examples, then switch between saved views instead of reconfiguring the table each time.Fixes and improvements
July 16–22, 2026Models and Integrations- Fix Use Anthropic Claude models through Vertex AI again, with request headers and parameters handled correctly for Vertex’s API.
- Fix Run GPT-5 and o-series models in the Playground on Azure, which now sends the token limit these models require.
- Improvement Evaluate longer sessions and traces with
gpt-4.1, now supported up to a 1M-character context.
- Fix Reference dataset columns by name in chained evaluators, including columns whose names match experiment outputs such as
inputoroutput. - Improvement Create evaluators with the scope preset to match the template you start from, so Session and Trajectory templates no longer default to Span.
- Fix Create and fetch template evaluators through the SDK and CLI without deserialization errors from the new
use_structured_outputfield.
- Fix Track LLM cost on spans imported through file upload, which now preserves the cost attributes on ingest.
- Improvement See tool-call arguments in the Input panel for tool spans sent with OpenTelemetry GenAI conventions.
- Fix Share a direct link to a specific session that opens with full context on the dashboard.
- Fix Jump to the latest available data reliably in an empty project view, without a previous project’s time range carrying over.
- Fix See correct timestamps at fine granularities in half-hour-offset time zones.
- Improvement Pass naive timestamps to any AX CLI command and have them interpreted as UTC.
- Fix Keep shared service API keys active after removing the user who created them.
See all experiments in one place, grouped your way
July 15, 2026New Datasets and ExperimentsA new Experiments page in the left navigation brings every experiment in your space together, independent of the dataset each one belongs to, so you can review and compare results across projects without opening datasets one at a time. Group the view by target, source, or dataset to bucket related runs the way that fits your analysis.
REST API v2 now uses consistent casing and schema names
July 15, 2026Breaking SDKs and REST APIsThe Arize AX REST API v2 follows one naming convention across every resource, so your generated client code and types stay consistent and predictable: enum values useSCREAMING_SNAKE_CASE, and request and response schemas follow a verb-first pattern. Update any hardcoded enum values and regenerate your client from the latest spec, because the API now rejects legacy lowercase enum values with a 400 instead of coercing them.- Enum recasing — values such as
admin,openAI, andtemplate_evaluationare nowADMIN,OPEN_AI, andTEMPLATE_EVALUATION. - Verb-first schemas — response types such as
IntegrationListResponseandSpanDeleteResponseare nowListIntegrationsResponseandDeleteSpansResponse.
Model registry lists only actively supported models
July 14, 2026Deprecation Models and IntegrationsThe Playground and evaluators now offer only models that providers still serve. Models retired by their providers, along with the deprecated Gemini 2.0 family, are removed from the Arize AX model registry, and the default direct Gemini model is nowgemini-3.5-flash.- End-of-life removals — retired OpenAI, Anthropic, Vertex AI, AWS Bedrock, and NVIDIA NIM snapshots, including
gpt-4-0314and the legacy Claude 3, 3.5, and 3.7 versions. - Gemini 2.0 deprecation —
gemini-2.0-flash,gemini-2.0-flash-001, andgemini-2.0-flash-liteare removed, and saved prompts that referenced them fall back gracefully.
Agent Playground and Remote Agents are generally available
July 13, 2026Improvement AgentsAgent Playground, Remote Agents, and Agent Experiment Traces are now generally available on every account, including self-hosted deployments, so you can run and compare agent experiments without a feature flag. The Improve navigation groups them with Prompt Playground under a single Playgrounds section next to Prompts.Learn more about agent experiments.Update existing dataset examples in place with the Python SDK
July 10, 2026New Datasets and ExperimentsYou can now update the content of existing dataset examples by ID with the newupdate_examples method in the Python SDK, so you can correct or enrich examples without recreating the dataset or losing example identity across experiment iterations. Apply the change in place on the current version, or pass new_version to capture it as a new dataset version.The code example below updates two fields on an existing example, keeping its ID stable:Attach multiple session and trace evaluators to a single task
July 10, 2026New EvaluatorsYou can now add more than one session- or trace-level evaluator to the same online task, so a single task can score conversations across several dimensions instead of being limited to one session evaluator.Learn more about session-level evals.Self-serve 13-month data retention on Pro plans
July 10, 2026New Data FabricPro-plan users can now extend data retention to 13 months on their own, unlocking longer historical analysis as a self-serve upgrade. Start from a gated time-range preset (Last Month, 3 Months, 6 Months) or the Upgrade Retention button on the Pro plan card, and the add-on attaches to your existing subscription with an immediate prorated charge and no change to your renewal date.Learn more about pricing and usage.New OpenAI GPT-5.6 models in the Playground and evaluators
July 9, 2026New Models and IntegrationsThree OpenAI GPT-5.6 models are now available anywhere you pick an OpenAI model, including the Playground and evaluators, so you can run prompts and LLM-as-judge evaluations on OpenAI’s latest lineup. Each model exposes a newmax reasoning-effort level for the most demanding tasks.- Model options —
gpt-5.6-sol(frontier),gpt-5.6-terra(balanced), andgpt-5.6-luna(efficient). - Reasoning effort — choose from
none,low,medium,high,xhigh, and the newmaxlevel.
Bring your own Anthropic key for managed agents
July 9, 2026New AgentsYou can now run managed agents on your own Anthropic API key instead of the Arize-managed default, so agent jobs use your provider account and quota. Mark an Anthropic provider as eligible for agents, then pick it as the runtime in the agent preset editor or the setup wizard, or set a space-wide default runtime so new agents inherit it automatically.Learn more about agent presets.Fixes and improvements
July 9–15, 2026Tracing and Sessions- Fix Track accurate cost and token totals across agent and chain traces that report SDK rollups.
- Improvement Search on span start time, end time, and latency in the attributes panel, and include them in span exports.
- Fix Get completed results from evaluators you apply directly in the Playground.
- Fix Select Gemini 2.5 and newer models in the Playground model picker.
- Fix Track accurate trace cost for Vertex AI models.
- Fix Run non-pro GPT-5 models against custom and OpenAI-compatible endpoints that implement only Chat Completions.
- Fix Filter distribution widgets and monitors by the values you set.
- Fix Scope annotation configurations to the specific trace you apply them to.
- Improvement Submit dataset example annotations once at least one row is labeled.
- Improvement Tell Alyx how many spans to run a task on and whether to skip already-evaluated spans.
Enter spaces with any resource role you have been granted
July 8, 2026Fix SDKs and REST APIsCustom roles with a space-level binding allow for entry into their spaces, so a user granted a single resource permission such as dataset access reaches the space in the UI and through the v2 spaces API. Any role binding in a space’s lineage grants entry, while per-resource permissions stay enforced on the resources inside.- Space entry gate — holding any binding in the space lineage, or legacy membership, is enough to enter the space.
- Full coverage — restores both the in-app space view and the
GET /v2/spacesandGET /v2/spaces/{id}endpoints for custom-role users.
Control Arize AX’s appearance with a system theme and refreshed light mode
July 7, 2026New Dashboards and VisualizationsYour profile menu now offers a System theme that follows your operating system’s light or dark setting, and light mode itself has a warmer, higher-contrast redesign, so Arize AX matches the rest of your desktop and stays easy to read.- System theme — choose System, Light, or Dark; System follows your OS appearance and switches live as it changes, with no reload.
- Refreshed light mode — a warm-neutral palette with layered elevation and vivid success, warning, danger, and info status colors.
- Accessibility — links, severe text, and input placeholders now meet WCAG AA contrast.
Fixes and improvements
July 6–8, 2026Alyx- Improvement Alyx can now order aggregated results and return the top-N groups by a column you choose, so it can answer ranking questions such as which models drive the most cost.
- Improvement Code evaluator test runs now send only the dataset columns you have mapped to the evaluator’s arguments, so the test payload matches what the evaluator receives.
- Fix You can now drag to select text in the prompt variable editor.
- Improvement The trace slideover now hides the Evaluations and Annotations tabs by default and omits internal-only metadata from evaluation tables; re-enable the tabs anytime from Customize Tabs.
- Fix Trace field values that contain non-ASCII, multibyte characters are now truncated on character boundaries, so international text stays intact and valid.
- Fix You can now filter pivot table widgets on null or empty values and get the matching rows.
- Fix Webhook endpoints now accept requests that include a trailing query string, so integrations that append one deliver successfully.
Evaluate agents with new prebuilt trajectory and session evaluators
July 1, 2026New EvaluatorsThe evaluator gallery now includes seven new LLM-as-a-judge templates for agent trajectories and multi-turn sessions, so you can measure agent goal completion, path efficiency, and session quality without writing evaluation prompts from scratch.- New agent and session evaluators — Goal Completion, Path Efficiency, Reasoning Coherence, Session Resolution, Topic Coherence, Session Frustration, and Session Completion.
- Organized by workflow — templates are grouped into Response Quality, Code Quality, Trajectory, Session, RAG, and Security so you can find the right evaluator faster.
- Scope at a glance — each template shows whether it runs on a span, trace, or session, and the Security group is now available to all users.
Capture more LLM and tool detail with new OpenInference span attributes
July 1, 2026New Tracing and SessionsArize now stores four additional OpenInference span attributes as typed, queryable columns, so you can filter and analyze traces on richer LLM, tool, and embedding metadata.llm.system— the system or provider that served the LLM call.llm.finish_reason— why the model stopped generating.tool.id— the tool-call identifier, now available as a top-level attribute.embedding.invocation_parameters— the parameters used for embedding calls.
Run prompts and evaluations on Claude Sonnet 5
June 30, 2026New Models and IntegrationsClaude Sonnet 5 (native Anthropic) is now available across the Prompt Playground and LLM-as-a-judge evaluators, so you can test and evaluate your prompts on Anthropic’s latest Sonnet-tier model without leaving Arize.- Available everywhere you pick a model — select Claude Sonnet 5 in the Prompt Playground and when configuring evaluators.
- Automatic cost tracking — input, output, and cache token costs are recorded for every call, so spend shows up in your usage and evaluation costs.
- Adaptive reasoning — like other latest Claude models, Sonnet 5 manages its own reasoning effort, so the temperature, top-p, and top-k controls no longer apply.
Map evaluator variables to dataset columns in the Prompt Playground
June 29, 2026New PlaygroundYou can now map evaluator template variables to differently-named dataset columns directly in the Prompt Playground, and Alyx can fill in those mappings for you, so you can run an evaluator over any dataset without rewriting its template to match your column names.- Per-instance variable mappings — a Mappings control on each evaluator instance maps template variables such as
{{input}}to dataset columns such asquestion, and warns you when a mapping is missing. - Automatic mapping with Alyx — the Align Eval flow detects column mismatches and applies the correct mappings before running.
- Preview with resolved values — the preview table shows each
variable → columnmapping alongside the resolved values.
Launch prebuilt agents with a guided setup wizard
June 27, 2026New AgentsAgent Studio now includes a guided setup wizard that walks you through connecting, configuring, and launching a ready-made agent, so you can spin up a purpose-built agent, such as an on-call SRE or a failing-trace investigator, without assembling skills, projects, and tasks by hand.- Ready-made agents — start from templates like SRE/On-Call, Investigate Failing Traces, Fix a Bug, Incident Commander, and Cost.
- Guided Connect, Configure, and Review — connect skills, point the agent at a project or repository, and launch it as a session or a recurring automation.
Analyze experiment trends with the new Experiment Analysis view
June 25, 2026New Datasets and ExperimentsThe redesigned Experiment Analysis view, a refined trend chart paired with a Scoreboard, is now the default charting experience on the dataset Experiments page, so you can spot performance changes across experiment runs at a glance.- Trend chart — track how scores and metrics change across experiment runs over time.
- Scoreboard — compare the key metrics for your selected experiments side by side.
Fixes and improvements
June 25–July 1, 2026Evaluators- Improvement You can now start an evaluator run on a dataset directly from the slideover in a single step.
- Improvement Your span Input/Output and Attributes display format (Pretty, Raw, JSON) now persists across sessions.
- Improvement The Projects flyout now lists recently viewed projects with a 7-day volume sparkline, and prompt tools appear as top-level navigation items.
- Improvement Added a Clear Filters action to the tracing table empty state so you can recover from a filtered-empty view in one click.
- Improvement Automation detail slide-overs now show the agent’s investigation report, with clickable references to the traces it examined.
Evaluate multi-step agents with new query filters
June 22, 2026New EvaluatorsWhen you create an online evaluation task on traces or sessions, you can now use multi-span queries, the same filter model as multi-span filters on the Tracing page, to define relationships between spans and choose which traces to evaluate.Instead of asking “does this trace contain a retriever and an LLM?” you can ask “did the retriever directly call the LLM?” or “did the agent call a tool before the final answer?” This is the same intuitive pattern-matching you already use when searching traces, now built into online eval tasks.- Span relationships — combine up to five named span filters with operators such as
=>(direct parent),->(happened before),AND, andORto express how spans connect, not just that they coexist. - Variable mapping by span role — map each evaluator input (for example, question, context, and answer) to the subquery that should supply it.
Easily view full sessions from labeling queues
June 22, 2026New AnnotationsLabeling queue records now include a View Session action alongside View Trace whenever the underlying span carries a session ID.This means reviewers can open the complete session (every trace in the conversation) directly from a queue item, with the originating trace highlighted, so they can annotate with full context instead of judging a single trace in isolation.- View Trace or View Session — choose the level of context directly from the queue record’s source-data menu.
- Originating trace highlighted — the session view scrolls to and highlights the trace the queue record came from.
Fixes and improvements
June 18–24, 2026Evaluators- Fix Session-level evaluators can now be run from the Use Evaluator slideover, which previously left the Run button disabled.
- Fix Online tasks running multiple span-level evaluators now stamp each eval span with its own eval name, so eval results filter correctly in dashboards.
- Fix Experiment runs launched from the playground no longer fail when template variables are supplied through per-example overrides.
- Improvement External audio attachments now play in the span view even when the waveform preview can’t be generated.
- Fix Clicking the text inside a rich-text table cell now activates the row, matching the rest of the row’s click behavior.
- Improvement Alyx now recovers gracefully from query timeouts with a retry prompt instead of failing.
- Fix Large synthetic datasets generated by Alyx now render their apply widget reliably instead of stalling.
- Improvement Alyx now asks follow-up questions through interactive prompts and places reference links at the end of its responses.
- Improvement The Python SDK’s
list_examples()method now supports cursor pagination, so you can export large datasets in batches instead of loading every example at once. See the Datasets client documentation. - Fix The Python SDK no longer writes datasets to the local cache when caching is disabled, restoring
list_examples()andlist_runs()on read-only filesystems such as AWS Lambda. - Improvement The annotation endpoints (
annotatefor spans, dataset examples, experiment runs, and annotation queues) graduated from alpha to beta in the Go and TypeScript SDKs. - Improvement The Python SDK now tailors its async-execution guidance to your Python version, recommending sync execution on Python 3.14+ where
nest_asynciois unsupported.
The Go SDK v2 is now generally available with full feature parity
June 17, 2026New SDKs and REST APIsThe Go SDK v2 has reached general availability and now covers every resource available in the Python and TypeScript SDKs — tasks, evaluators, prompts, experiments, datasets, annotation queues, spans, organizations, and more. Go teams can automate the full Arize workflow natively, without switching languages or reaching for the REST API directly.The code example below shows how to initialize the Go SDK v2 client:Populate annotation queues with traces
June 16, 2026New AnnotationsYou can now add whole-trace records to an annotation queue, not just spans and dataset examples. This unblocks trace-level human review, allowing you to queue every trace in a time window for annotation.Visit the labeling queues documentation to learn more.See active traces as they run with in-progress trace support
June 12, 2026New Tracing and SessionsTraces that are still mid-flight, or missing a root span due to out-of-order ingestion, now appear in the Traces table. Long-running agent workflows are visible as they run, and orphaned spans no longer vanish while waiting for their root span to arrive.- Active traces — long-running workflows appear in the table while still executing, not just after they complete.
- Orphaned spans surface immediately — when the root span hasn’t arrived yet, the earliest span holds the row until it does.
- Status labels — each trace is clearly marked complete, in-progress, or orphaned.
Add Claude Fable 5 to your prompts and evaluations
June 10, 2026New Models and IntegrationsClaude Fable 5 is now available in the model selector for Anthropic, so you can run prompts and LLM-as-a-judge evaluations on Anthropic’s latest model. You can adopt Claude Fable 5 across the playground and evaluators without custom model configuration, and cost tracking works out of the box.- Anthropic provider — select Claude Fable 5 anywhere you choose a model, backed by your Anthropic integration.
- Cost tracking included — input, output, and cache token pricing for Claude Fable 5 is preloaded for both Anthropic and Vertex AI.
Reuse Custom Metrics across models, projects and dashboards
June 10, 2026Deprecation Custom MetricsCustom Metrics are now managed at the space level from a single Custom Metrics page, and the legacy per-model custom metrics flow has been removed. You can now define a metric once and reuse it across every model, project, dashboard, and monitor in the space, instead of recreating it per model.- Space-level management — create, edit, and browse all custom metrics from the Custom Metrics page in the sidebar.
- Per-model flow removed — the Custom Metrics tab on individual model and project overview pages, along with the per-model create and edit pages, is no longer available; recreate any metrics you still need at the space level.
Append runs to an existing experiment from the SDK
June 9, 2026New Datasets and ExperimentsYou can now append runs to an experiment that already exists, using the new append-runs method in the Python, TypeScript, and Go SDKs. This change allows you to incrementally add results to an experiment as they finish, instead of recomputing and re-logging the whole experiment each time.- Up to 1,000 runs per request — each run references an existing example by
example_idand supplies itsoutput, plus any extra fields you want to record. - Run IDs returned in order — the response includes the IDs of the newly created runs in input order.
- Python
- TypeScript
- Go
Manage evaluation tasks directly from the Go SDK
June 9, 2026New SDKs and REST APIsThe Go SDK adds a Tasks subclient with full CRUD and asynchronous run management, bringing evaluation-task automation to Go alongside the existing Python support. This means you can create, trigger, poll, and cancel online evaluation tasks programmatically from Go services, so you can score runs on a schedule or on demand without manual steps in the UI.- Full lifecycle — list, get, create, update, and delete evaluation and run-experiment tasks.
- Async run control — trigger runs over a chosen data window, poll until completion, and cancel in-progress runs.
Plan for the API key status rename from “deleted” to “revoked”
June 9, 2026Breaking SDKs and REST APIsThe API key status valuedeleted has been renamed to revoked across the REST API, SDKs, and UI. If you filter API keys by status, update your integrations: querying status=revoked now returns soft-deleted keys, and status=deleted returns an HTTP 400 error.- Update filters — replace
deletedwithrevokedwherever you query or display API key status. - SDK enums updated — the
ApiKeyStatusenum in the Python, TypeScript, and Go SDKs now usesrevoked.
Create and edit labeling queues conversationally with Alyx
June 9, 2026New AlyxAlyx can now list, create, and edit labeling queues from the chat, presenting an editable queue form you confirm before any change is applied. Set up human review workflows by describing what you want in natural language, without leaving the conversation to configure queues by hand.- Conversational setup — ask Alyx to create or update a labeling queue and review the proposed configuration before accepting it.
- Jump to the queue — open the created queue directly from a link in Alyx’s response.
Edit and resend messages in an Alyx conversation
June 9, 2026New AlyxYou can now edit a message you already sent to Alyx and resend it, and the conversation will be updated in place. You can correct or refine a prompt without restarting the thread, so Alyx continues from your revised message.- Edit in place — hover any message to edit and resend it.
- Safe branching — when a response included a widget, editing forks the thread and archives the original so earlier results are preserved.
Fixes and improvements
June 8–10, 2026Evaluators- Improvement Running a single evaluator now opens the run confirmation modal scoped to that evaluator instead of firing the run immediately.
- Fix The back button on the evaluator detail page returns to the previous page correctly.
- Fix Data quality monitors persist comparison-window filters even when the primary window has none.
- Fix Clearing a monitor’s evaluation-window input no longer resets it to zero.
- Fix Unsaved new widgets are discarded when the edit form is closed.
- Fix Session- and trace-level eval counts no longer overcount in span-level aggregations.
- Fix The
CONTAINSfilter on string-list columns matches list elements case-insensitively, so trace and dashboard counts agree.
- Fix You can remove a stuck prompt from Alyx’s context.
- Fix Alyx no longer emits runaway text when a model returns a stop signal as plain text.
- Fix Creating evaluators and fixing variable mappings works from the trace slideover and sessions page.
- Improvement The Python SDK
SDKConfigurationacceptsdefault_headersto attach custom headers to all HTTP, gRPC, and Flight requests. - Improvement
ax api-keys refreshaccepts--grace-period-secondsto keep the previous key valid during rotation. - Improvement Flight-backed export commands (
spans,datasets,experiments,traces) support--allunder OAuth authentication. - Fix Dataset ingest rejects raw binary columns with a clear error before upload instead of failing mid-import.
- Fix Triggering a task without a configured LLM integration returns HTTP 400 with a clear error instead of HTTP 500.
- Fix Corrected the
axCLI snippets shown in the in-app code modals.
- Fix Table-source ingestion jobs (Snowflake, BigQuery, Databricks) are no longer auto-paused prematurely when polling with no new data.
Continuously investigate production agent failures with Signal
June 5, 2026New AgentsSignal is an always-on AI worker that continuously reviews new production traces, identifies recurring failure patterns, and groups related traces into investigation reports. Each report includes a summary, root-cause analysis, estimated impact, and suggested next steps.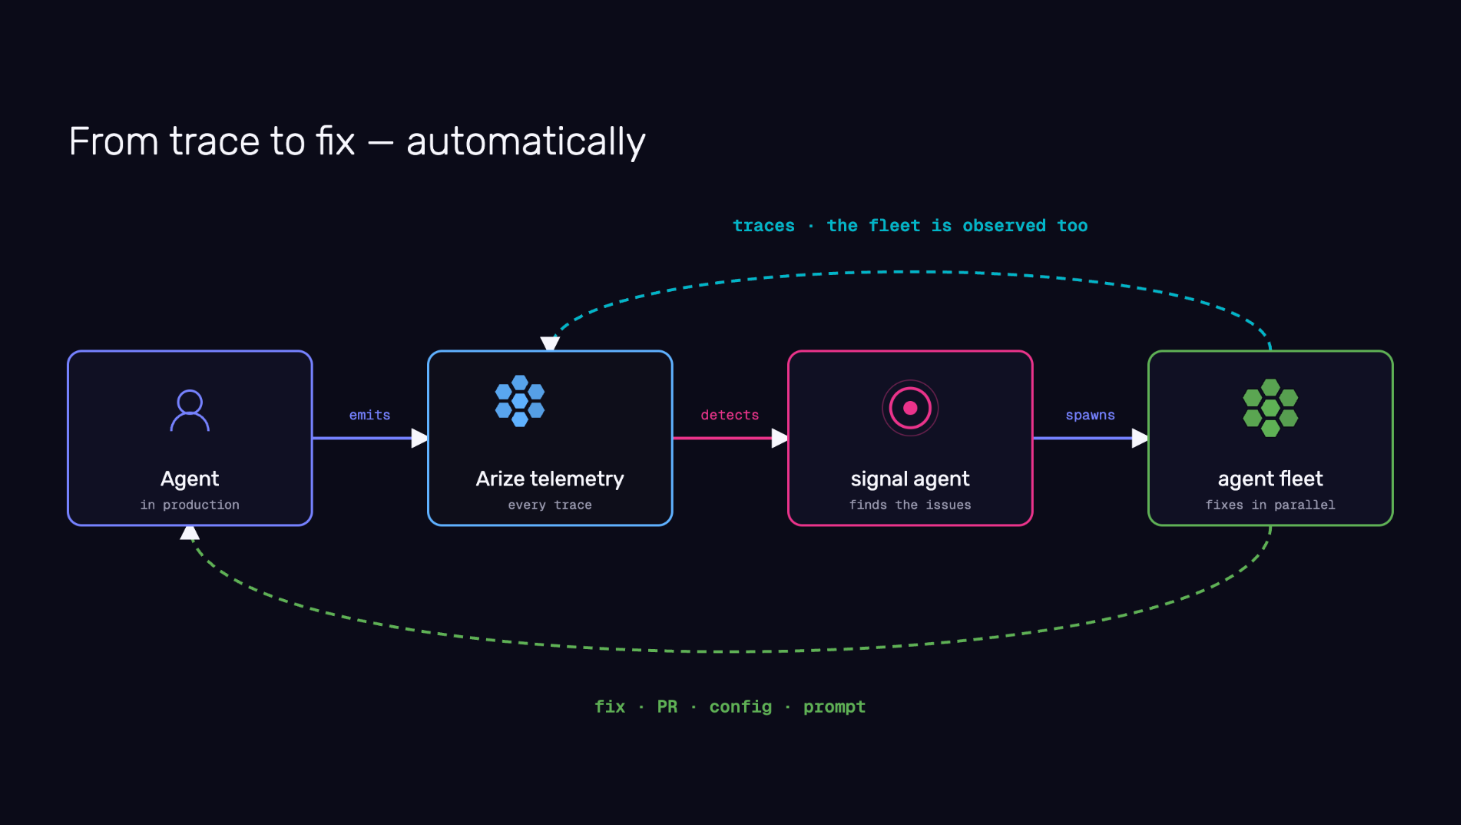
Orchestrate repo-aware managed agents across your engineering workflows
June 5, 2026New AgentsArize AX now supports orchestrating long-running, repo-aware managed agents that inspect traces, access external systems, analyze code, create investigation artifacts, and propose changes as pull requests for human review. Teams can start with prebuilt workflows or build their own using configurable harnesses, sandboxes, repositories, skills, and automations.Repetitive investigation and analysis work, regression triage, debugging production behavior, dataset curation, eval generation, security reviews, and code remediation, can now be delegated to agents that gather evidence and propose actions, while engineers retain full control to review, approve, modify, or reject every proposal.Refer to the Agent Swarms documentation to learn more.Track managed agents in your organization from a single view
June 5, 2026New AgentsAgent Swarms provides a centralized view of managed agents in your space—active sandboxes, sessions, automations, transcripts, and trace links.As teams deploy more AI workers, visibility into what those agents are doing, how they are performing, and what resources they are consuming becomes essential. You can track long-running investigations, understand agent behavior over time, and manage your growing fleet without switching between surfaces.Check out the Agent Studio documentation to learn more.Agent Experimentation surfaces behavioral diffs across your complete agent system
June 5, 2026New AgentsAgent Experimentation lets you run curated datasets through your entire agent system and compare outputs, traces, and evaluation scores across runs.Production agents are systems made of tools, retrieval, routing, memory, models, fallbacks, application code, and business logic. A change in any layer can improve one behavior while breaking another. Each run surfaces the behavioral diff: whether tool use improved, latency shifted, retrieval quality held, or a fix for one failure introduced a regression elsewhere.Visit the agent experiments documentation to learn more.Adapt your evaluation criteria to emerging agent failures with Agent-as-a-Judge
June 5, 2026New AgentsAgent-as-a-Judge lets you describe good behavior, then uses an agentic judge to inspect traces, identify relevant spans, classify issues, and generate labels for future monitoring, evaluation, and experimentation.Traditional LLM judges work best when you already know what to measure. Agent failures are rarely that predictable. New failure modes emerge as agents interact with tools, users, and changing environments in production. Agent-as-a-Judge produces evaluation signal that adapts to what is actually breaking, not just what was anticipated.Refer to the Agent-as-a-Judge documentation to learn more.Observe, replay, and evaluate voice agent conversations natively
June 5, 2026New AgentsArize AX now provides native support for observing, searching, replaying, and evaluating voice agent conversations. You can inspect audio sessions alongside transcripts and traces, analyze interruptions and time-to-first-audio, replay conversations end-to-end, and run evaluations directly against audio interactions.Voice agents introduce complexity beyond text. Audio streams, interruptions, speech latency, transcription quality, and multimodal interactions all become part of the agent experience. Native voice support brings voice conversations into the same observability and evaluation workflow as text agents, so you can debug, monitor, and improve conversational AI systems with the same rigor you apply to the rest of your stack.Check out the tracing and evaluating audio documentation to learn more.Design custom views for annotation queues with Alyx
June 5, 2026New AlyxYou can now give annotators exactly the view they need: describe the layout you want in plain language, and Alyx generates a custom React view for your annotation queue records with color coding, visualizations, or any presentation that fits your workflow. Views can surface specific attributes cleanly, and you can publish a view org-wide or push it to other queues. Custom Views are also available in the trace slideover for spans and traces.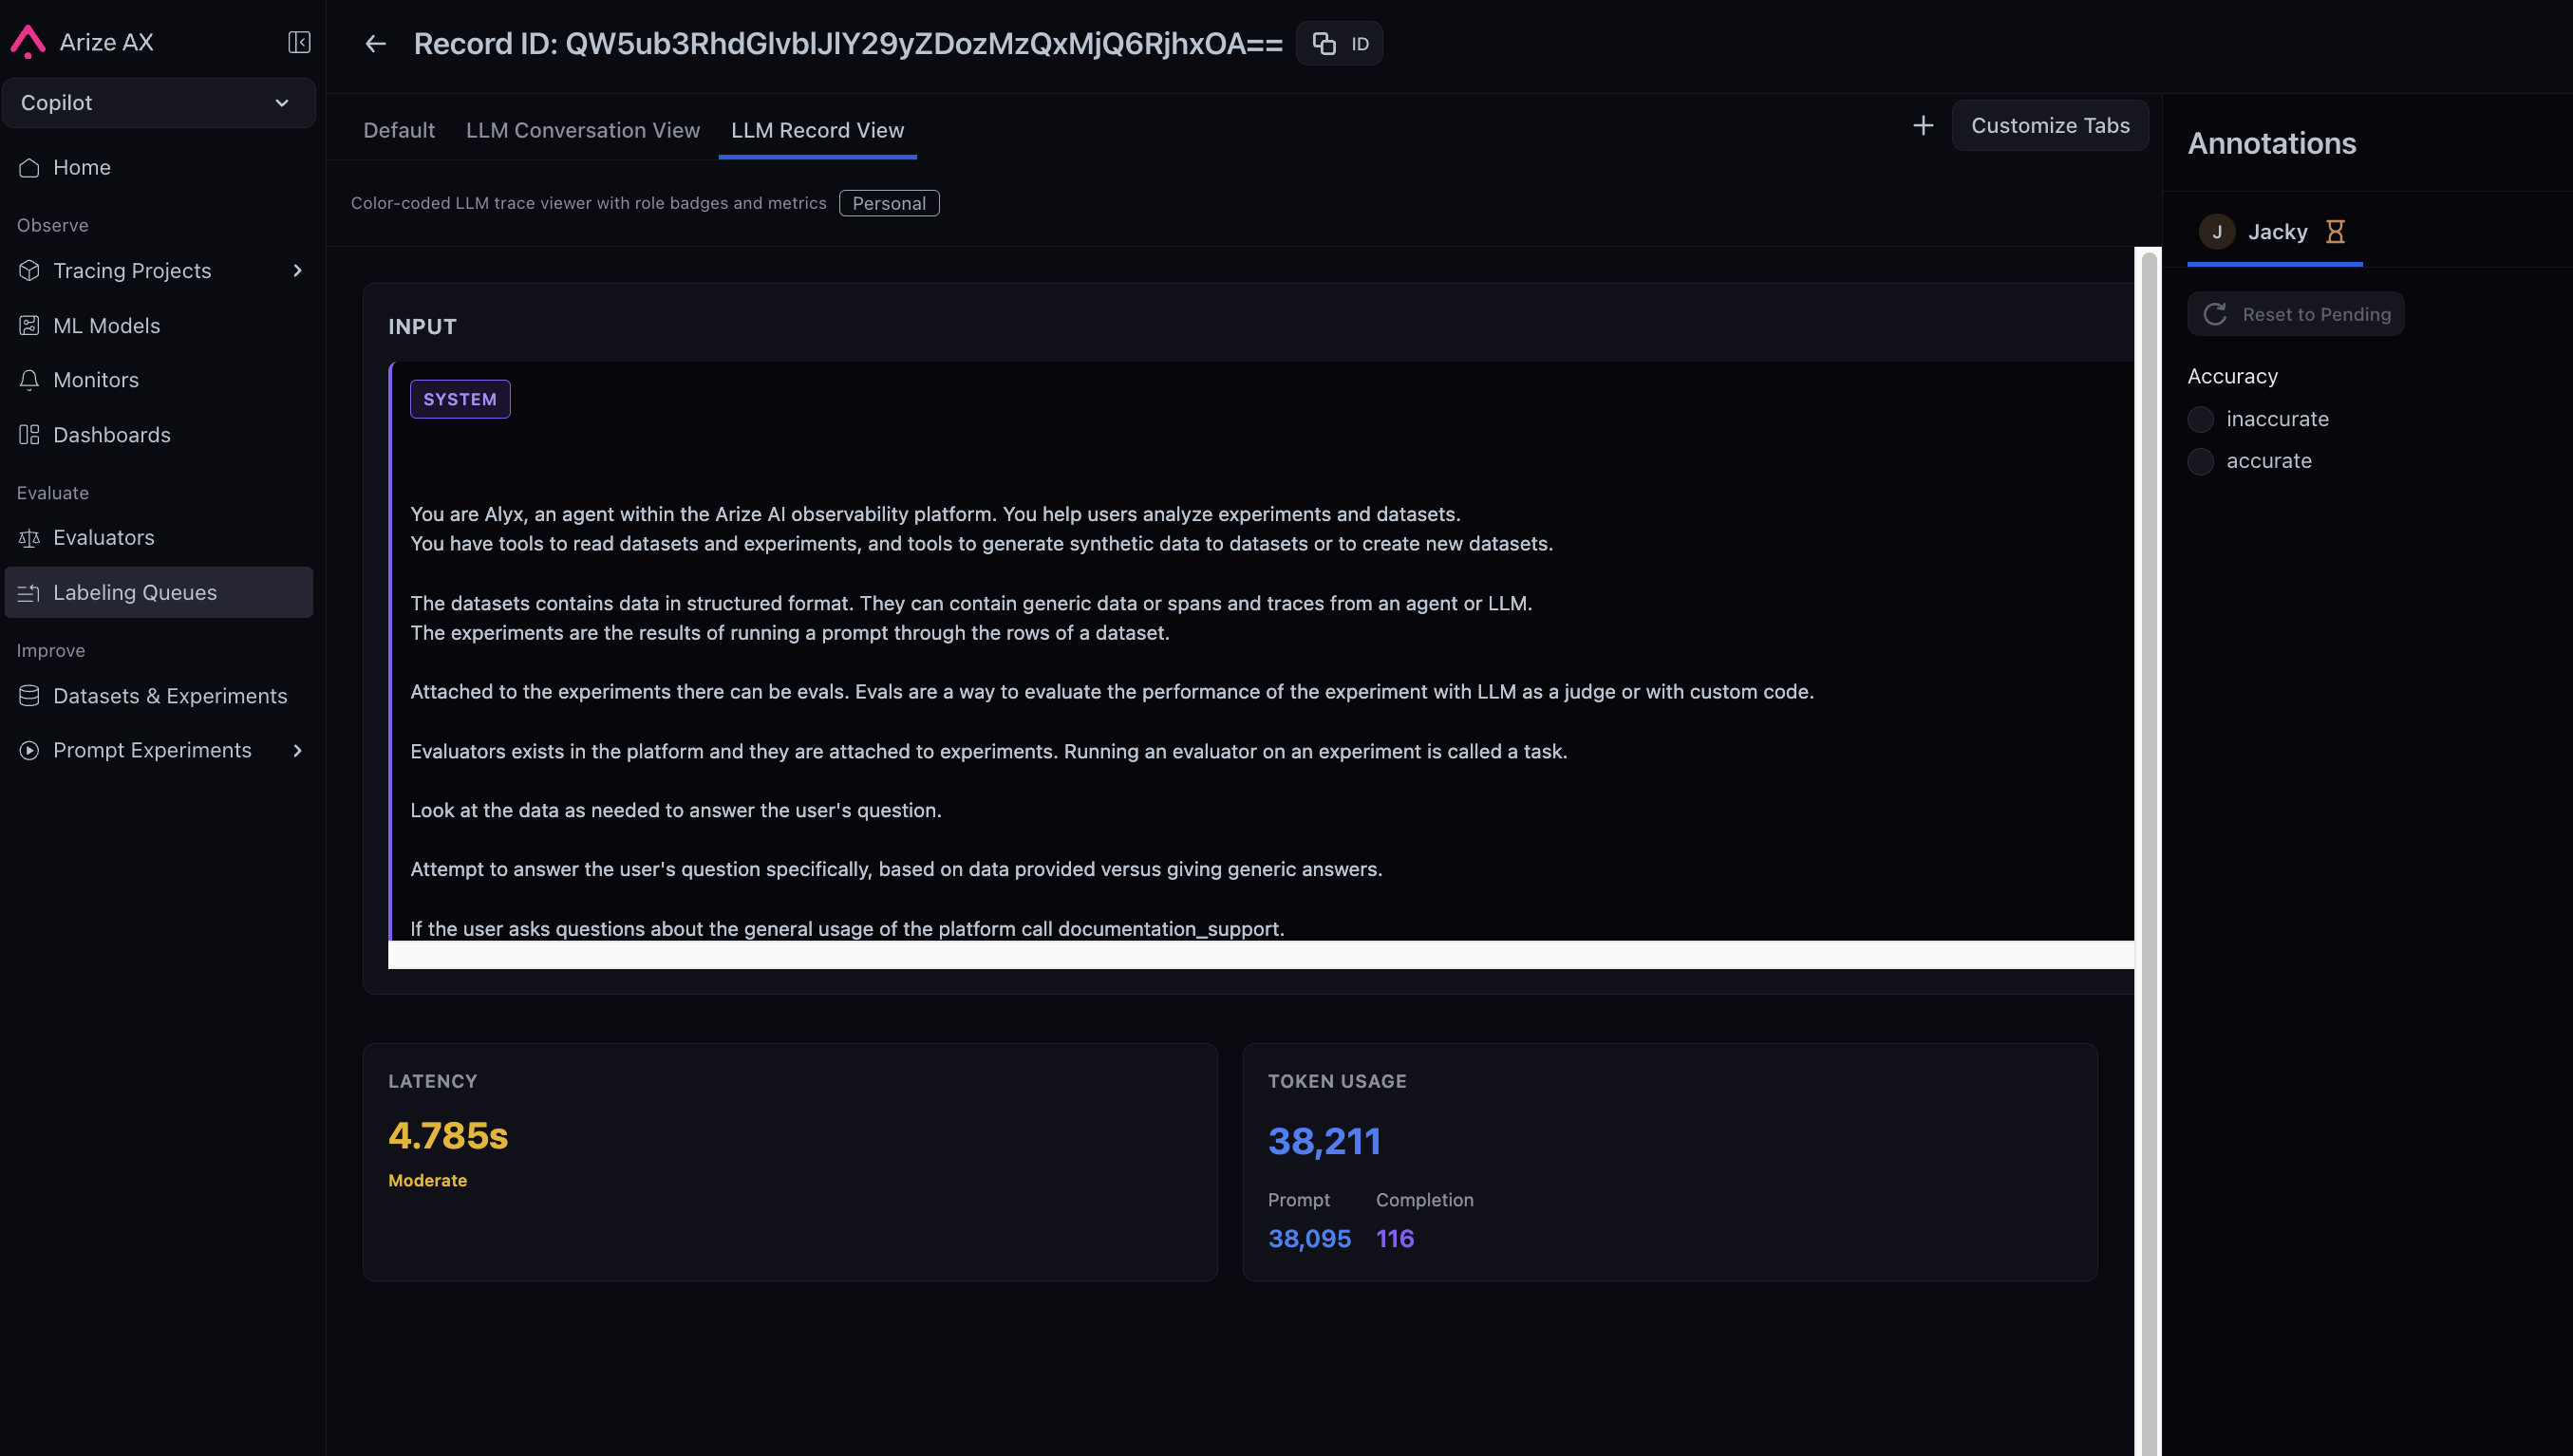
Monitor org-wide traces, costs, and evals at a glance
June 5, 2026Improvement Dashboards and VisualizationsYou can now monitor traces, errors, latency, cost, and eval scores across your entire organization from a single dashboard, with six new widgets, a logical two-column layout, and a customization panel that autosaves your changes.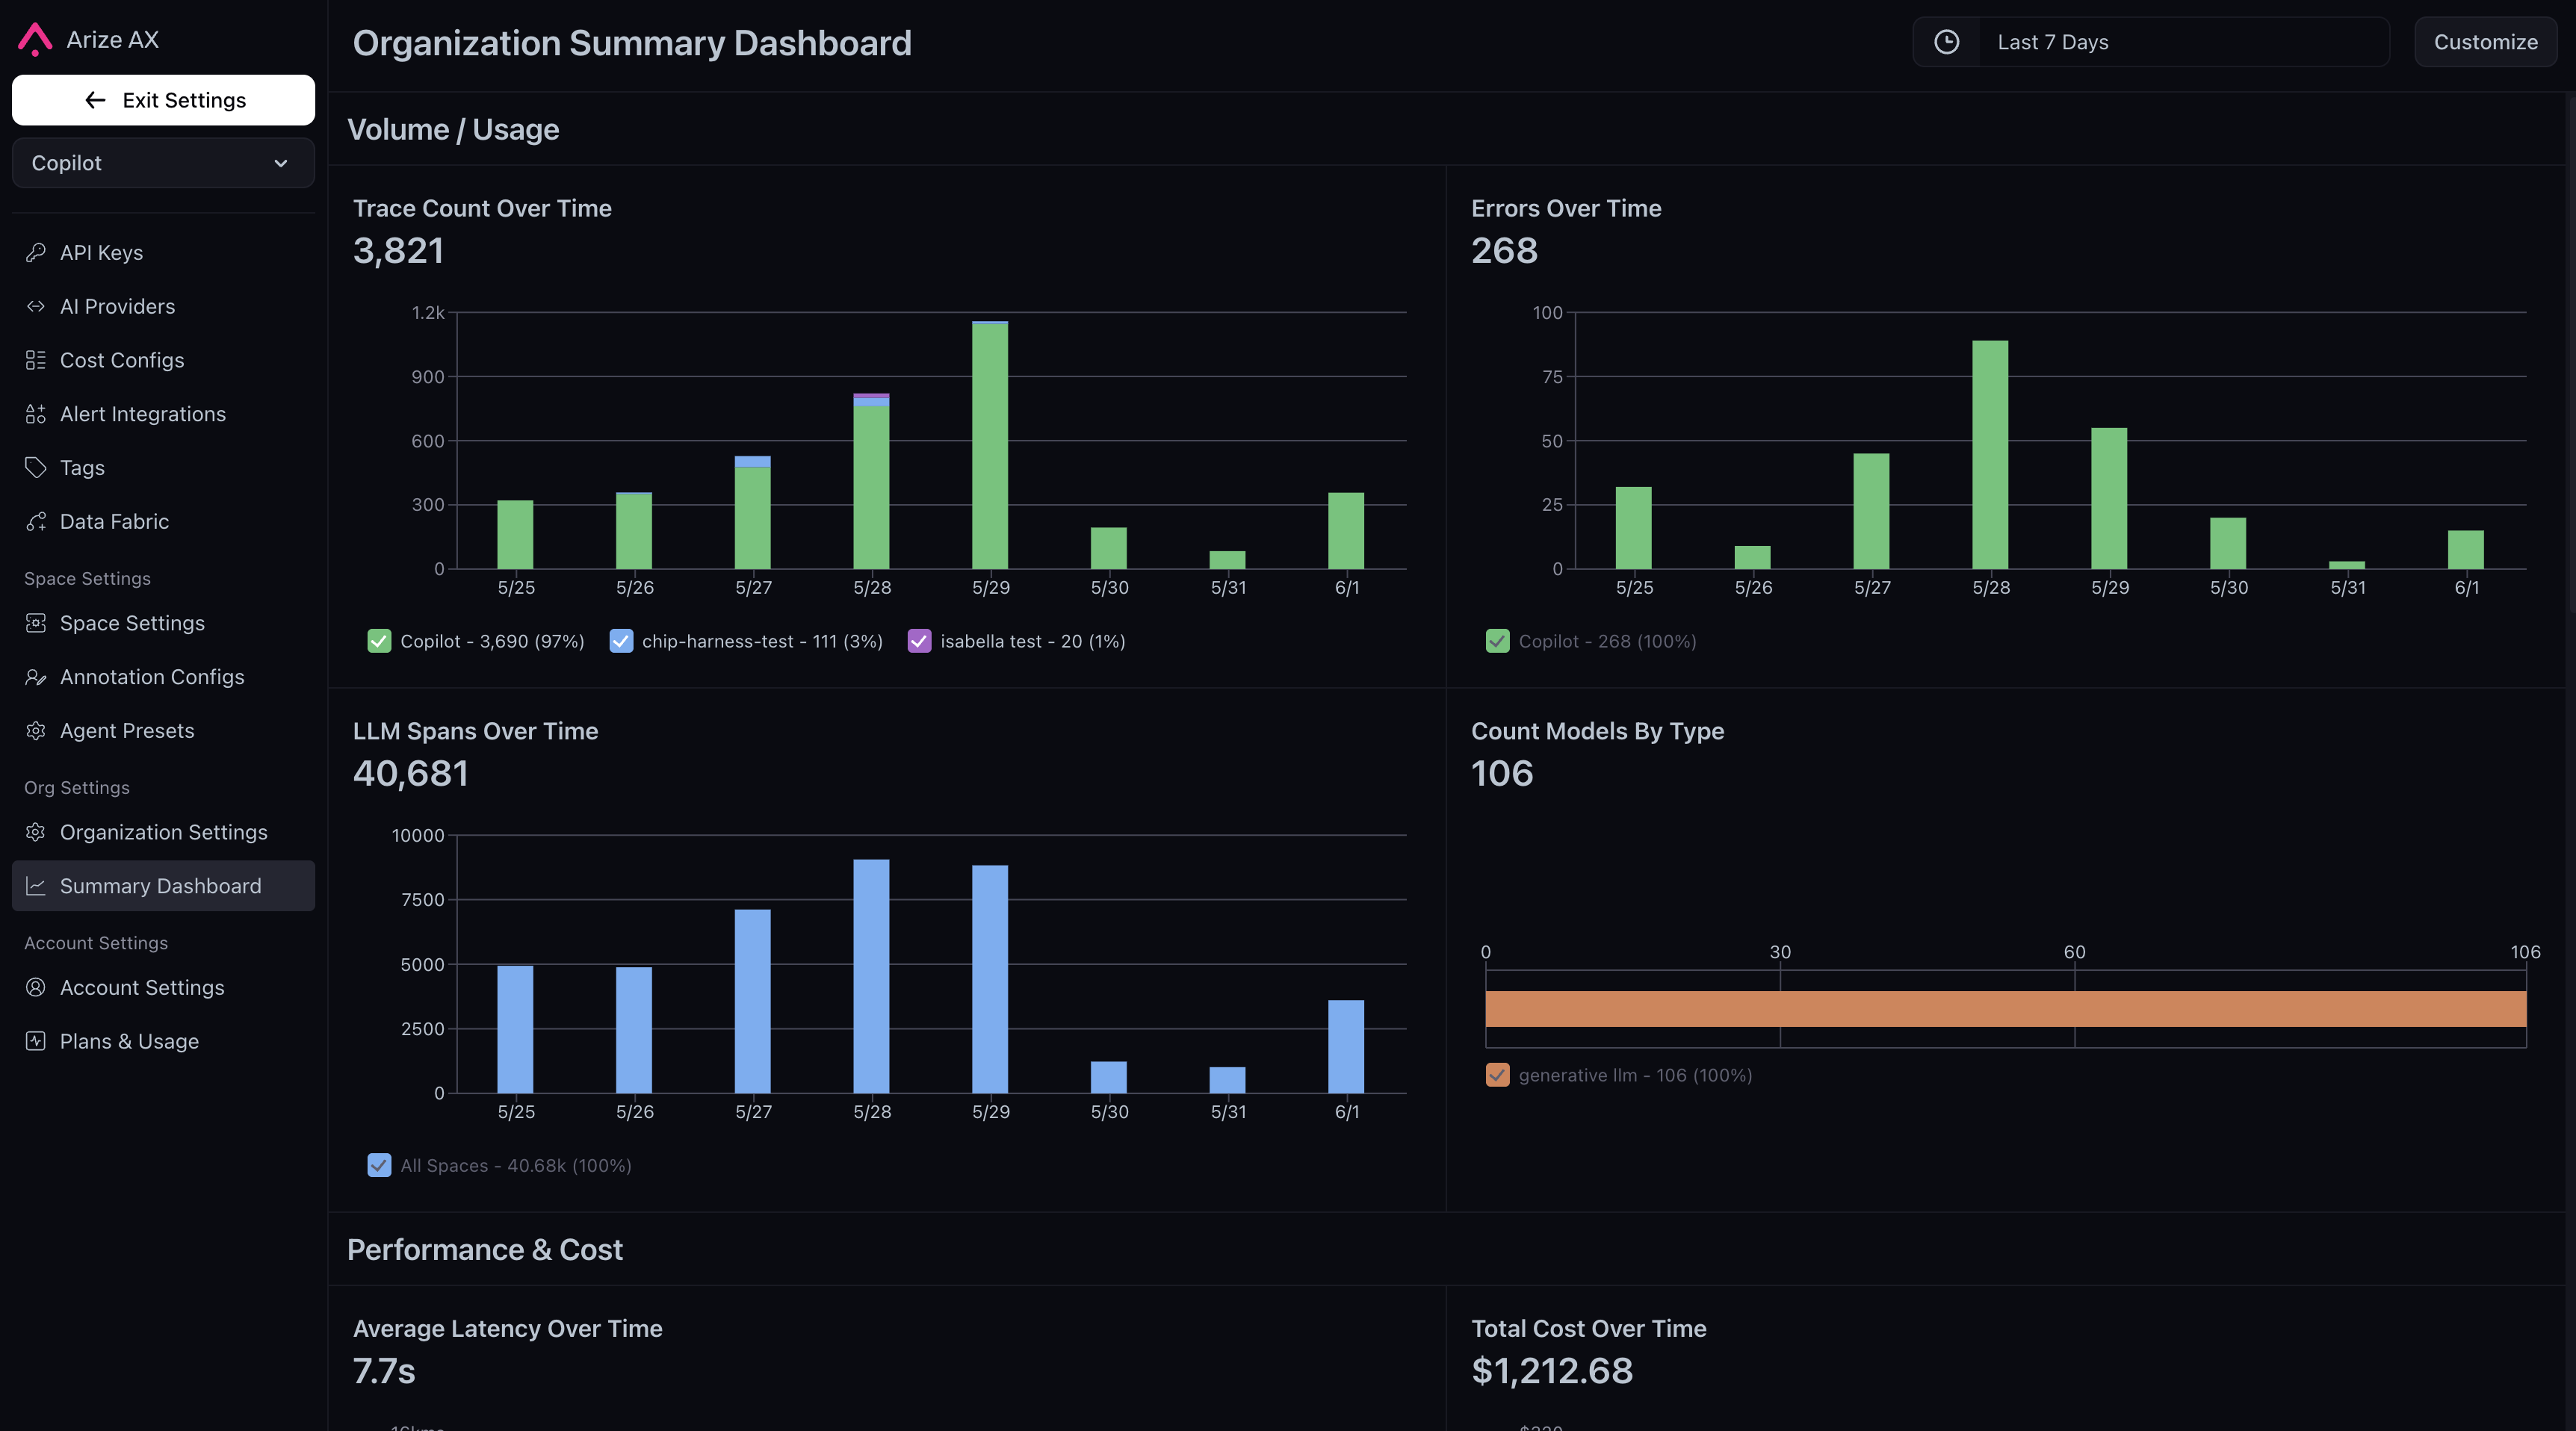
- Trace Count Over Time: stacked bar chart of root span volume across spaces, with per-day top-project tooltip drilldowns
- Errors Over Time: stacked bar chart of spans with
status_code=ERROR, broken down by space and top contributing projects - Average Latency Over Time: line chart of average latency by space with per-project tooltip drilldowns
- Total Cost Over Time: stacked bar chart of daily cost aggregates by space
- Average Eval Score Over Time: line chart with an org-level eval picker across all LLM projects
- Distribution of Eval Labels: bar chart of eval label distributions with eval and scope selection
Keep your Alyx conversation thread as you move across the platform
June 5, 2026Improvement AlyxAlyx now persists as a single assistant across the entire platform, following you as you navigate between pages and switch tasks. Alyx dynamically loads skills, instructions, and tools on demand, resulting in 40–80% smaller prompts and approximately 45% fewer tools loaded upfront.Previously, navigating between pages disrupted Alyx’s context and message history. With One Alyx, you can move across surfaces without losing your conversation thread, while the leaner prompt architecture delivers faster, more coherent responses as capabilities continue to expand.Check out the Alyx documentation to learn more.Automatically revoke API key access with expiration dates
May 27, 2026New SDKs and REST APIsUser API keys and service keys now support an optional expiration date set at creation time. The expiration date appears in the API key tables in the UI, and expired keys are rejected at authentication. Access stops automatically when the key is no longer valid.Short-lived keys are now easier to rotate and align with security policies for contractors, CI jobs, and integrations you plan to retire. Once a key expires, it simply stops working; you no longer need to remember to delete it manually.Visit the API and Service Keys documentation to learn more.Rearrange trace columns to fit your workflows
May 27, 2026New Tracing and SessionsTraces and spans tables now support column reordering. You can now drag column headers or use the column menu (move left, move right, hide, or sort) to arrange columns in any order. Your column layout is saved in the browser and persists across sessions. Existing sorting, filtering, resizing, and row selection are unaffected.This feature allows you to arrange the traces and spans tables to match how you actually debug, without reconfiguring it each time you open a project.Visit the view and manage traces documentation to learn more.Reliable prompt retrieval and CLI output with Python SDK updates
May 27, 2026Fix SDKs and REST APIsThree patch releases following 8.28.0 address reliability issues in prompt retrieval, CLI output, and OpenAPI schema generation:If you are already on 8.28.0, upgrading to 8.28.3 is recommended, especially for prompt hub scripts, CLI workflows, and automation that lists users or resolves spaces by name.The code example below uses
prompts.get() to retrieve a prompt version by label, including versions that have invocation parameters set:Visit the Prompts documentation to learn more.Evaluate dataset examples with LLM and code evaluators
May 20, 2026New Datasets and ExperimentsYou can now run LLM-as-a-Judge and code evaluators directly on a dataset’s examples. Each run evaluates rows as they currently exist in the dataset and writes results back, joining them to their respective rows.This is useful when iterating on an evaluator against a fixed set of examples, maintaining a golden or reference dataset with up-to-date scores, or running regression checks on curated rows.Visit the evaluations on datasets documentation to learn more.See operational and evaluation metrics in one place with the new Evals & Metrics tab
May 20, 2026New Tracing and SessionsLLM project tracing now includes an Evals & Metrics tab that combines operational charts (traffic, latency, tokens, and cost) with evaluation metrics and counts. The four operational charts can be pinned to the tracing overview or kept on the tab, with your layout saved per project.Every tracing project gets this layout automatically, no need to build a custom view to see operational and evaluation data together. Keep a lean overview for day-to-day monitoring and open a single tab for trends and eval scores, without splitting system health and evaluation performance across unrelated views.Visit the tracing documentation to learn more.Generate custom trace views with Alyx
May 20, 2026New AlyxAlyx can now generate custom trace views from a short natural-language description. Alyx produces a sandboxed React visualization that renders against the trace and span data you already have open; inputs, outputs, metadata, evaluations, and span relationships. You can accept the view, refine it in chat, then save it, rename it, pin it as a tab, and share it with your team.This feature allows you to tailor layouts for your unique debugging needs, whether you need agent turns, tool calls, eval scores side by side, or a compact summary for incidents. You can easily create layouts with Alyx instead of exporting data or building one-off UIs, and saved views become reusable lenses on traces for you and your team.Visit the Alyx documentation to learn more.Access platform and observability APIs with the new Go SDK v2
May 20, 2026New SDKs and REST APIsThe Go SDK v2 is now available — the Go client for the Arize REST API. It covers platform and observability APIs including organizations, projects, API keys, spans, annotations, role bindings, and more. You can reference resources by name and ID, create service-scoped API keys, manage organization membership, annotate spans, and use a consistent API surface across subclients, with runnable examples in the repo.The code example below shows how to initialize the Go SDK v2 client:Annotate spans, manage users, and update datasets with Python SDK updates
May 20, 2026New SDKs and REST APIsThree releases extend the v8ArizeClient for eval workflows, span annotations, user and API key admin, and dataset management:Visit the Python SDK documentation to learn more.
Automatically Add Spans to Labeling Queues
May 13, 2026New AnnotationsYou can now configure a labeling queue to automatically pull in spans matching optional filter criteria, so you can build review pipelines without manual curation.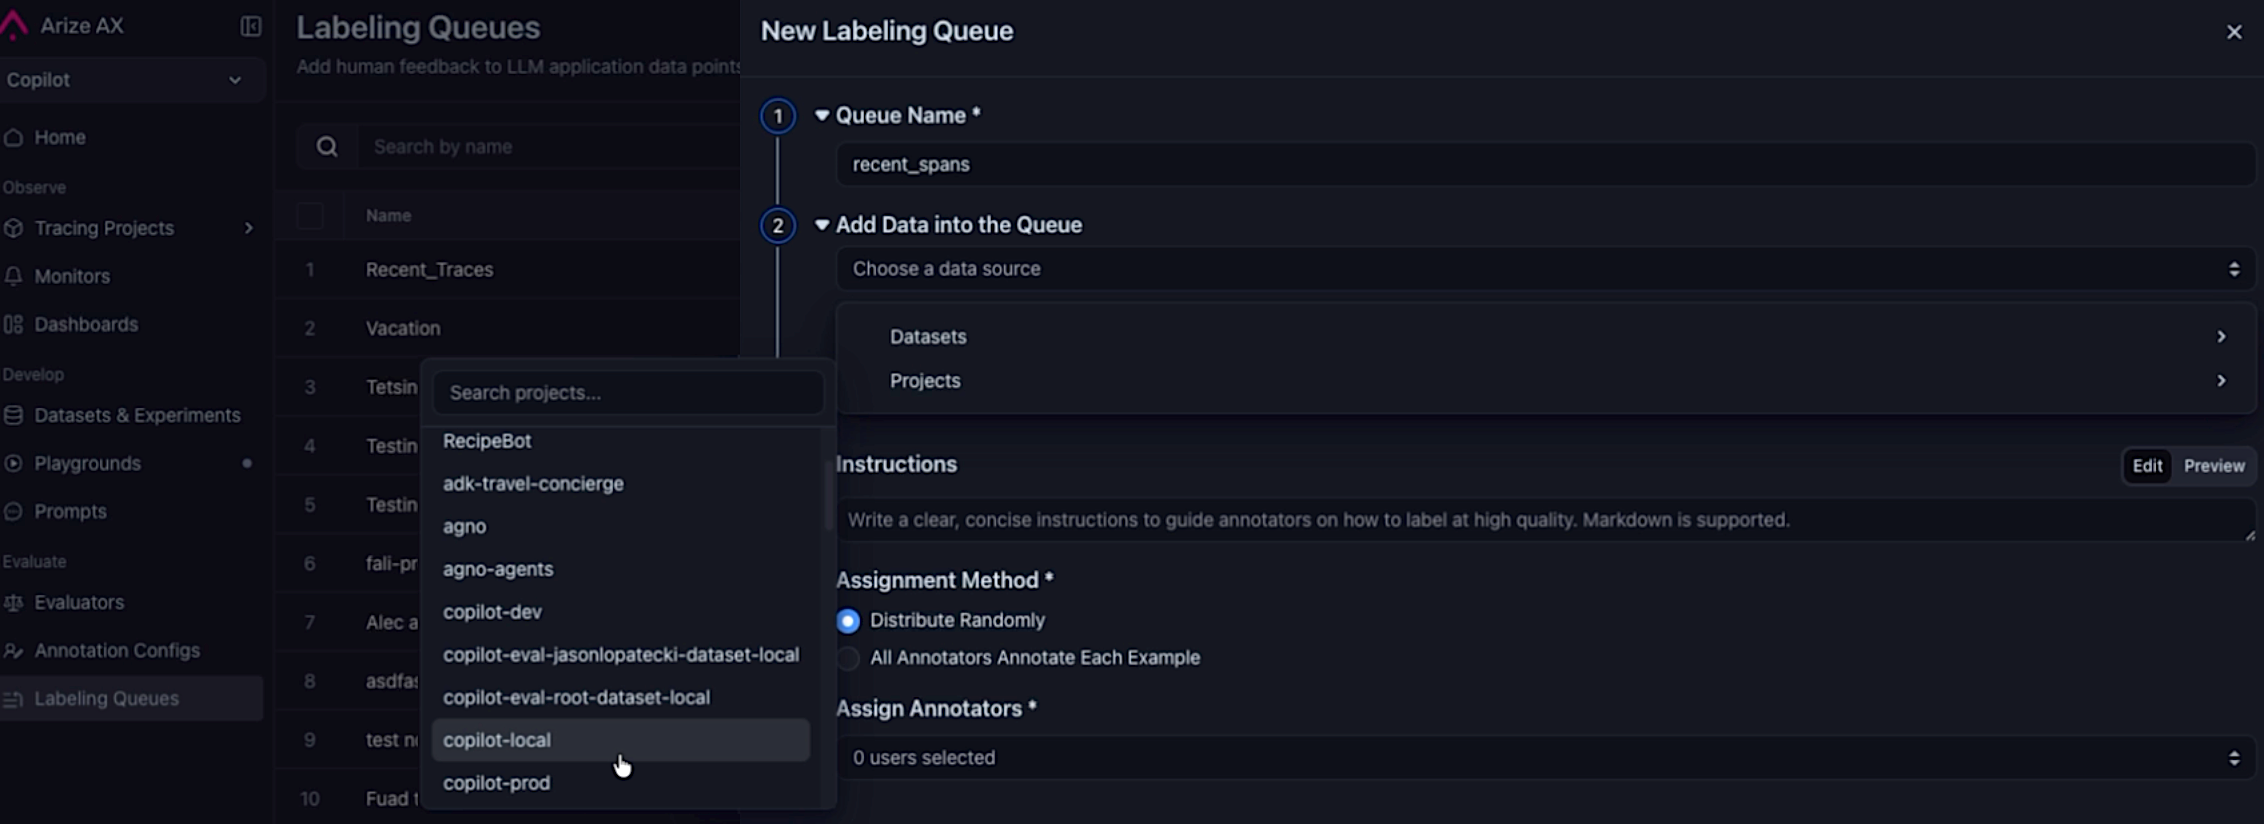 Selecting a project as the datasource when creating a queue to automatically pull in spans.
- Project datasource — Select a project as the data source when creating a queue.
- Query filter — Optionally scope which spans are routed for labeling (for example,
attributes.openinference.span.kind = 'LLM'). - Sampling rate — Route a representative slice of traffic when matching span volume exceeds annotation bandwidth.
- Continuous and backfill modes — Enable continuous ingestion to keep pace with new traffic, backfill to seed the queue from existing spans, or both.
- Queue cap — Set an optional cap to prevent unbounded growth and keep the queue manageable.
Easily run Evaluators on Selected Experiments
May 13, 2026Improvement Datasets and ExperimentsPick experiments in the Experiments table, click Run Evaluator, and the evaluator creation dialog opens with those experiments already pre-populated—no need to re-select them by hand.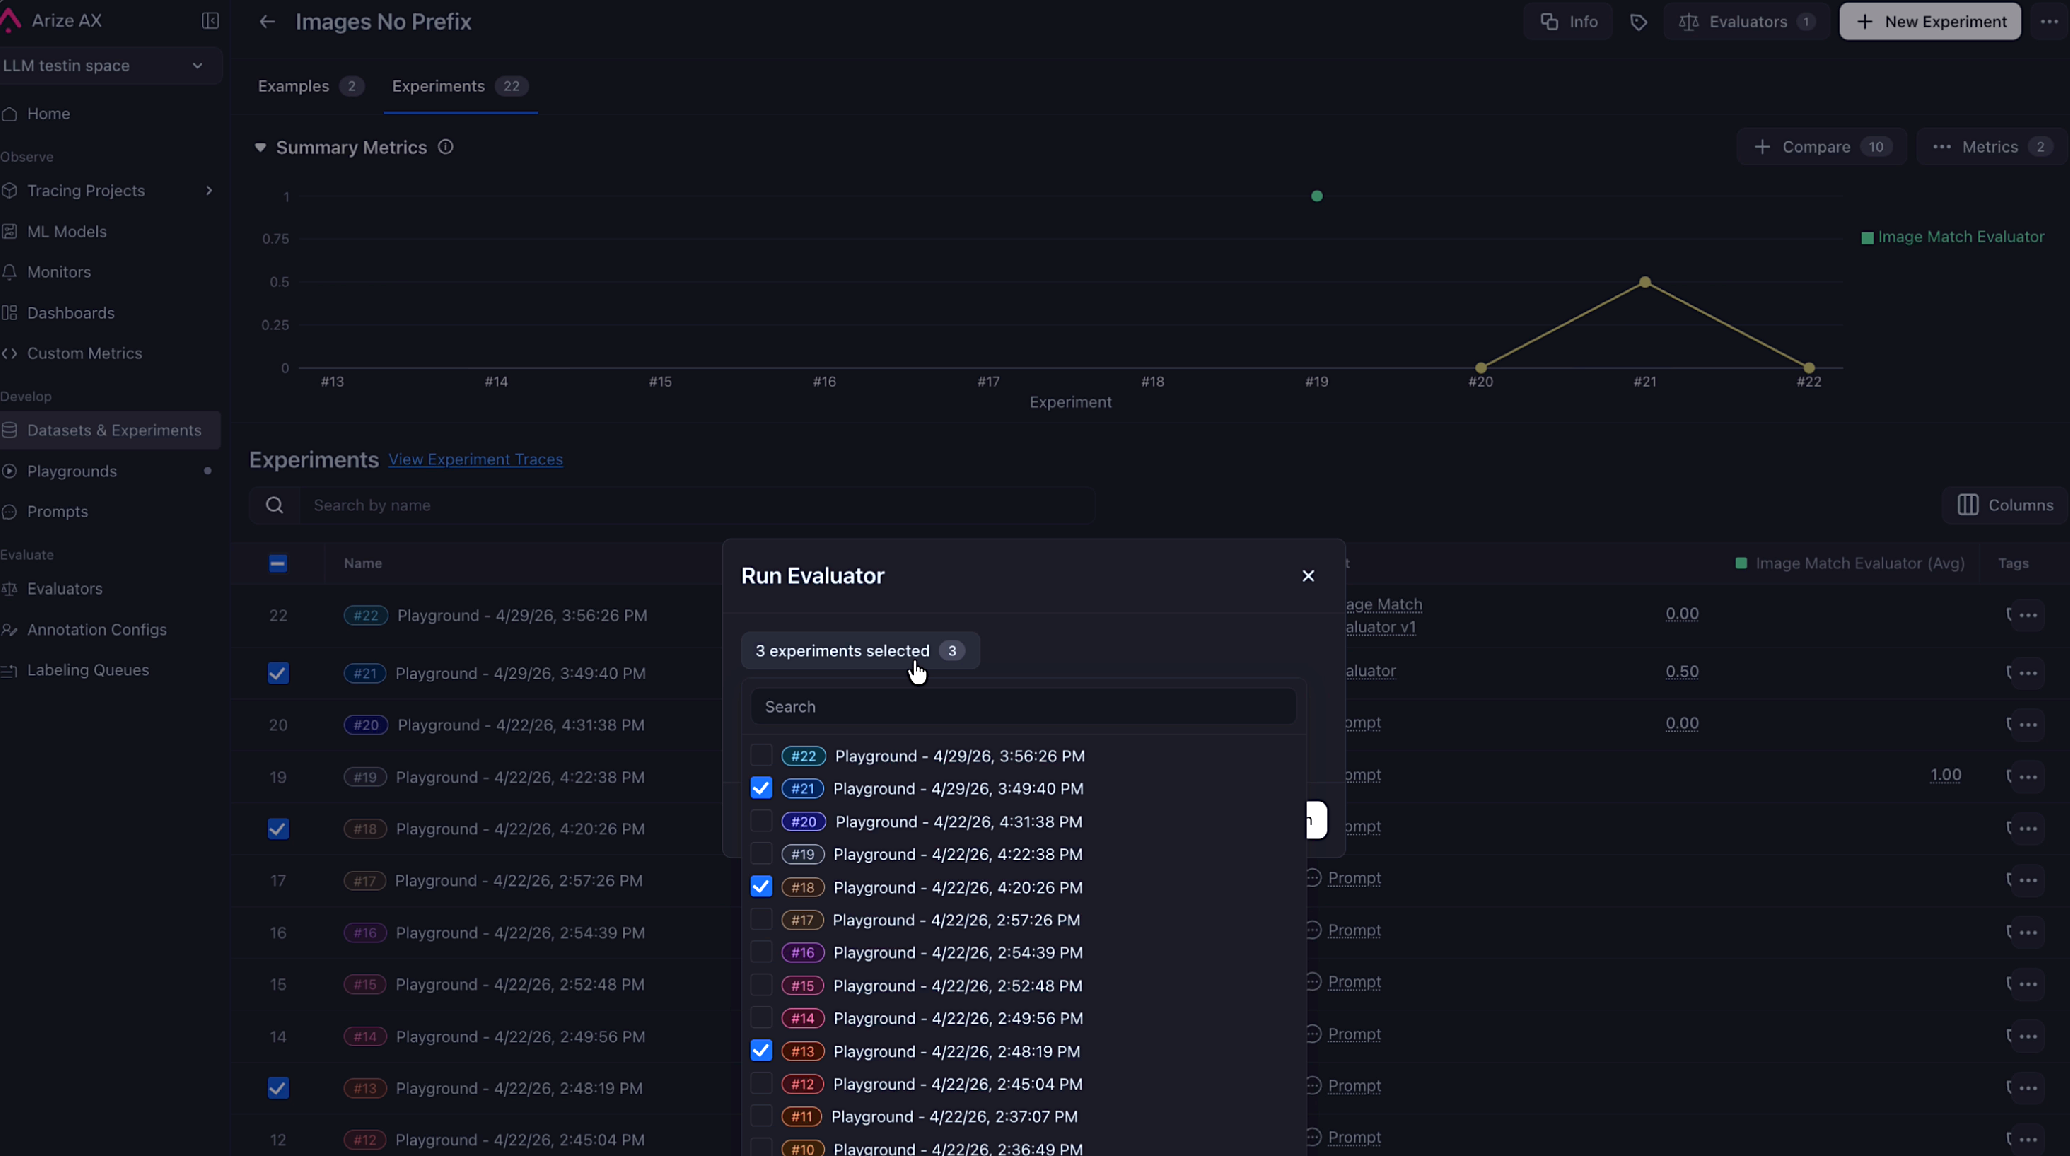 Selected experiments are now pre-populated in the evaluator dialog.For more information, refer to the run offline evals on experiments documentation.
Manage Users, Roles, and Invitations from the Python SDK
May 12, 2026New SDKs and REST APIsarize-python-sdk v8.24.0 adds full CRUD support for the /v2/users endpoints so you can manage your account’s user base programmatically instead of clicking through the UI.- Lifecycle operations —
users.list(),get(),create(),update(), anddelete(). - Invitation and password flows —
users.resend_invitation()andusers.reset_password()automate the most common admin chores. - Typed domain models — User, organization, and space roles return as Pydantic models, so
ax users listproduces cleanto_dfoutput instead of crashing on raw API types.
Fixes and Improvements
May 7–13, 2026Custom Metrics- Improvement
PROJECTis now accepted as an alias forMODELin custom metric SQL, so you can writeFROM projectto match how tracing projects are named elsewhere in the platform. ExistingFROM modelqueries are unaffected.
- Improvement The Alyx home agent can now list traces directly, so you can ask for recent traces without having to switch surfaces first.
- Fix Editing a Prompt Playground prompt through Alyx no longer fails when the model returns the prompt as a JSON-encoded string—Alyx parses it automatically.
- Fix The Alyx
read_prompttool validates prompt IDs before calling, eliminating a class of failed reads. - Fix Re-opening an Alyx chat with a
custom_trace_viewwidget no longer renders a fresh Accept button, so users can’t accidentally create duplicate views.
- Improvement A new background job soft-deletes annotation queue records that have been annotated or sat untouched for a year, keeping queue tables from growing unbounded.
- Fix Creating an annotation queue via
POST /v2/annotation-queuesno longer returns 500 errors for accounts whose user names aren’t"admin".
- Fix Toggling Enable Tracing on an existing template-eval online task now persists on save. Previously the field was silently dropped when patching legacy (pre–Eval Hub) tasks.
- Improvement The integration setup flow now shows tooltips on each field, so it’s easier to understand what each value should be before submitting.
- Fix
POST /v2/experimentsnow returns400 Bad Requestfor schema mismatches such as aneval.*.scoretype mismatch, instead of a generic500.
- Fix Switching to pretty JSON formatting in the trace view no longer causes UI issues on large payloads.
Visualize Evaluator Score Distributions Across Spans and Experiments
May 6, 2026New Dashboards and VisualizationsEval score charts are now available to all users. Visualize how your evaluator scores distribute across spans and experiments directly from the model overview and tracing pages—no configuration required.Review and Confirm Alyx Proposals Before They Take Effect
May 6, 2026Improvement AlyxThree Alyx operations that previously applied changes silently now route through a visible confirmation drawer before taking effect. You can review, edit, and accept or skip each proposal.- Eval Form Proposals: Alyx surfaces an editable drawer with the proposed evaluator name, display name, template, and classification choices before saving.
- Task Creation: A review drawer shows the full task configuration—target, evaluator, run mode, sampling rate—before the task is created.
- Task Configuration: Configuring task parameters through Alyx now always requires confirmation, regardless of which page you’re on.
Wire Experiment Runs into Automated Pipelines with the run_experiment REST API
May 6, 2026New SDKs and REST APIsThe v2 REST API now supports experiment run tasks. Create, update, and triggerrun_experiment tasks programmatically to wire experiment runs into automated pipelines.Assign Multiple Annotation Queue Records to a Reviewer in Bulk
May 6, 2026New AnnotationsAssign multiple annotation queue records to a reviewer in a single operation from the queue UI.Control Annotation Queue Capacity with Per-Queue Record Limits
May 6, 2026Improvement AnnotationsSet and clear a custommax_records cap on individual annotation queues from the queue settings UI, overriding the global account default.Fixes and Improvements
May 1–6, 2026- Fix Models and Integrations Azure OpenAI o-family models (o1, o3-mini, o4-mini) now work correctly in Prompt Playground and evals—the default API version is updated to
2025-04-01-previewso you no longer need to enter it manually. - Fix Datasets and Experiments The “View Experiment Traces” button now returns correct results for experiments run via the Arize Python SDK, which uses
experiment_idrather thandataset_id. - Fix Evaluators Eval result columns in
eval.<name>.<field>format generated by AX experiment evals are no longer dropped before the output is returned. - Fix Evaluators “View Task Logs” from an eval feedback tooltip now opens the exact task run instead of an approximate lookup that failed for renamed evaluators and older runs.
RBAC (GA)
April 13, 2026Role-Based Access Control is now generally available on Arize AX. Define custom roles, scope permissions to spaces and resources, and manage who can create, read, update, and delete platform resources from a single, auditable surface.- Resource Restrictions & Role Bindings: Restrict access to specific resources and bind roles to users or service accounts as the building blocks of fine-grained access control.
- API Key Permissions: New
USER_KEY_CREATE,SERVICE_KEY_READ, andSERVICE_KEY_UPDATEpermissions, plus developer permission checks on API key mutations, give admins precise control over who can mint and rotate keys. - User Creation Hardening: GraphQL API key creation has been removed in favor of REST flows, and a permissions toggle on user creation makes default access explicit at onboarding time.
Alyx Improvements
April 4–30, 2026- Floating Alyx Button: A persistent Alyx launcher follows you across the platform, with a pulse indicator that highlights when context-relevant suggestions are available.
- Alyx History Menu: Pick up where you left off—recent Alyx conversations are now grouped in a dedicated history menu so you can resume threads without losing context.
- Ask Question Tool: Alyx can now ask clarifying questions mid-task to confirm intent before taking action, reducing wrong turns on multi-step requests.
- Alyx Writes Code Evaluators: Describe what you want to measure and Alyx drafts the code evaluator, wires up parameters, and previews results before saving.
- Auto-Fix Variable Mappings on Eval & Task Forms: A new Alyx button on evaluator and task creation pages auto-detects and fixes broken variable mappings using actual column data—Alyx can also be auto-triggered to repair mappings without leaving the form.
- Variable Mapping Subagent in Playground: The same auto-mapping subagent is now available inside Prompt Playground, with user-defined columns accepted as hints to speed up resolution.
- Run Experiments from Datasets: Trigger experiment runs through Alyx directly from the dataset page—no need to navigate to the experiments surface.
- Unify Query Filters with Alyx: Translate natural language into structured query filters across tracing, sessions, and evaluations from one consistent Alyx flow.
- Eval Hub Alyx: Alyx is now embedded throughout Eval Hub, including a dedicated assistant on the evaluator detail page and a “Start with Alyx” prompt on empty states.
- Datasets Empty State: New Alyx entry point on the datasets page guides you through creating your first dataset and configuring evaluations.
- Skills on Home Page: The home-page Alyx now exposes surface-specific skills, making it easier to discover what Alyx can do in your current context.
- Materialized Column Awareness: Alyx is now aware of materialized input and output columns when filtering, returning more accurate results on projects that use derived attributes.
- Integrations Slideover: AI integrations now surface in a slideover within Alyx chat so you can view connection details without leaving the conversation.
- Claude Models in Canada: Anthropic Claude models are now enabled for Alyx in the Canada region for customers in that data residency.
Evaluator Improvements
April 4–30, 2026- Combined Eval & Task Form: Creating an evaluator and its task is now a single, streamlined form—configure the evaluator, define the task, and save in one pass instead of two.
- Release Evals in Playground: Promote evaluators from draft to released directly in Prompt Playground and reuse them across experiments and online tasks.
- Test Code Eval on Example: A new “Test on example” button runs your code evaluator against a single example so you can validate logic before scoring at scale.
- All Variables in Eval Template: Evaluator templates now accept all available variables, removing prior caps on the number of inputs you can wire into a prompt.
- Optimization Direction “None”: Add a
noneoption to evaluator optimization direction for evaluators where higher or lower scores aren’t inherently better. - Save Evaluator Version on Run: Running an experiment now records the exact evaluator version used, making historical comparisons reproducible.
- Eval Metadata in Tracing Details: Evaluator metadata—name, version, score, explanation—is now surfaced inline in trace span details for at-a-glance triage.
- Streamlined Eval Task Menu: The evaluator tasks menu has been reorganized for faster access to common operations.
- List Evals in Tracing Tasks Button: The tracing toolbar now shows the active evaluators on a project, so you can confirm what’s scoring before drilling in.
Custom Metrics
April 4–30, 2026- Space-Scoped Custom Metrics: Custom metrics are now scoped to spaces instead of individual models, so you can define a metric once and reuse it across every model and dashboard in the space. A migration moves existing metrics to space scope automatically.
Annotation Queues
April 4–30, 2026- Records-Per-Queue Caps: Set a cap on the number of records a single annotation queue can hold, preventing unbounded growth and runaway labeling costs.
- Duplicate & Capacity Surfacing: When adding records to a queue, the UI now surfaces the count of duplicates skipped and any capacity restrictions hit, so reviewers know exactly what landed.
- Manual Annotation Submission: Reviewers can now submit annotations manually from the queue without going through the full assignment flow.
- CSV / JSONL Download: Export annotation queue records to CSV or JSONL for offline review or downstream pipelines.
- User-ID-to-Email Rename: Annotation column names that previously used opaque user IDs are now rendered with email addresses for readability.
- Buffered Annotation Updates: User annotation updates are now buffered through the existing ingestion path for more reliable persistence under load.
- Preselected Configs from Annotation Columns: When configuring annotations on a dataset, the UI now preselects configs based on existing annotation columns to avoid redundant setup.
Datasets & Experiments
April 4–30, 2026- Sortable Example Columns: Sort by any column on the dataset examples table, including custom annotation columns and metrics.
- Span Dataset Metrics Bar: Span dataset versions now show a metrics stats bar at the top for instant visibility into volume, scores, and drift.
- Expand & Collapse Dataset Rows: Long dataset rows can now be expanded inline to inspect full input/output payloads without leaving the table.
- Image Hover Preview: Image cells in experiment slideovers now load a larger preview on hover, making it easier to spot visual regressions across runs.
- Nested JSON Preview: Nested JSON values in dataset cells render with collapsible structure instead of a flat string blob.
- CSV Integer Support: CSV uploads now correctly preserve integer types instead of coercing them to floats or strings.
- Avg. Latency on Experiments: Experiments now show average latency alongside score and cost columns, with consistent eval-experiment formatting across the table.
Tracing & Sessions
April 4–30, 2026- Project Source Mapping Configs: Define source mapping configurations per project to standardize how raw span attributes map to canonical input, output, and metadata columns. A new Save button replaces blur-based auto-save in the source mapping editor, and source mapping is now supported on on-prem deployments.
- Materialized Input & Output Columns: Project source mappings can now materialize input and output columns up front, accelerating filters and downstream evals on high-volume projects.
- Multi-Span Admission Path: Span/trace/session evaluation tasks can now ingest and score multi-span queries through a unified admission path, with continuous grouping and sizing for higher throughput.
- Sessions Columns & Expansion: The sessions tab now supports custom columns and per-row expand/collapse for quick session-level triage.
- Allow Double Quotes in Auto-Add Filter: Auto-add filters now accept double-quoted values, fixing a class of “no results” bugs on string filters.
- Auto Granularity in Monitor Charts: Monitor metric charts default to a granularity that returns data, eliminating empty time-series on first load.
Dashboards & Visualization
April 4–30, 2026- Charting on Project Home: Project home pages now include charting widgets so you can see traffic, evaluation scores, and latency trends without opening a dedicated dashboard.
- Bar & Distribution Charts: Dashboards now support bar charts and distribution charts, with click-through links to the underlying logs and tasks.
Webhooks & Events
April 4–30, 2026- Webhooks UI: Configure, test, and manage webhooks from a dedicated UI with payload previews and delivery history.
- Test Webhooks Button: Send a synthetic event to your webhook endpoint with a single click to verify auth and payload shape before going live.
- ES-Powered Events Page: The Webhooks panel has been replaced with an Events page backed by Elasticsearch, supporting full-text search, structured filters, and faster lookups across delivery history.
Playground
April 4–30, 2026- Prompt Switcher: Switch between prompts in the playground without losing your current context, making side-by-side comparison faster.
- Postprocessing Query Validation: Validation now runs on postprocessing queries in the UI, catching syntax and reference errors before you run the prompt.
- PNG Image Display: PNG image inputs now render directly in the playground without requiring a data-URI prefix.
- Reset Last-Used LLM: The “last used LLM” is no longer pinned in local storage, so a fresh playground always defaults to your space’s preferred model.
- Default Integration per Space: Set a default AI integration per space from Evals or Playground via a new modal, so prompts run against the right provider out of the box.
Data Fabric
April 4–30, 2026- Azure Blob Storage: Data Fabric now supports Azure Blob Storage as a source, alongside existing GCS and S3 support.
- Delta Lake Format: Specify Delta Lake as both an input format and an output destination for Data Fabric jobs.
- Azure Data Fabric UI: Refreshed UI for configuring Azure data sources, including a dedicated table format column for clarity on input shape.
Models & Integrations
April 4–30, 2026- Anthropic Opus 4.7: Claude Opus 4.7 is now available across Alyx, Playground, and evaluators.
- OpenAI o3 & o4-mini: OpenAI’s o3 and o4-mini reasoning models are now selectable for prompts and evaluations.
- GPT-5.4 Family: Added
gpt-5.4-nano-2026-03-17,gpt-5.4-mini, andgpt-5.4-mini-2026-03-17to the OpenAI provider. - GPT-5.5 & GPT-5.5-Pro: Latest OpenAI flagship and pro variants are now supported.
SDKs & REST APIs
April 4–30, 2026New endpoints and SDK clients for managing platform resources programmatically:- Organizations API (REST v2 + Python & JS SDKs): Full lifecycle for organizations—list, get, create, update, and delete—through the REST API and both Python and JavaScript SDKs, including a top-level
deleteOrganizationon the AX client. - Spaces Delete: Delete spaces programmatically through the REST API and SDKs, completing the space management surface.
- Tasks Update & Delete: Update and delete evaluation tasks through the REST API and both SDKs, plus matching
ax tasks updateandax tasks deleteCLI commands. - Batch Annotation Endpoints: New batch annotation endpoints for datasets and experiments let you submit annotations across many examples or runs in a single request.
- Annotate Examples & Runs (SDKs): Python and JavaScript SDKs gain
annotate_examples/annotateDatasetExamplesandannotate_runs/annotateExperimentRunsfor ergonomic batch annotation flows. - Resource Restrictions & Role Bindings: New
ResourceRestrictionsClientandRoleBindingsClientsubclients in Python and JS expose the GA RBAC surface, withrestrictResource,unrestrictResource, and role binding operations. - Custom Code Evaluator Configs: The evaluators API now accepts code-evaluator-specific configuration fields, enabling programmatic creation of code evals with parameters.
- Partial Success on Spans Delete: Spans Delete responses now report partial success with per-span outcomes, so bulk deletes surface exactly which spans were affected.
- DatasetWithExampleIds Response: Dataset example endpoints now return a
DatasetWithExampleIdsresponse variant, exposing example IDs alongside dataset metadata. - Public SDK Type Aliases: Both Python and JavaScript SDKs now re-export public type aliases for all subdomains, eliminating the need to import from
_generated. - Prompts v2 API Audit Improvements: The Prompts v2 API has improved audit logging on create, update, and label operations for clearer change history.
CLI Commands
April 4–30, 2026New command groups and capabilities for theax CLI:ax organizations: Full CRUD for organizations from the terminal—list, get, create, update, and delete.ax resource-restrictions&ax role-bindings: Manage RBAC resource restrictions and role bindings from the CLI to script access provisioning.ax tasks update&ax tasks delete: Update task configurations or remove tasks directly from the terminal.ax spaces delete: Delete spaces with a confirmation prompt to prevent accidental removal.- Profile API Key Hint:
ax profile createnow shows a hint about expected API key format, reducing setup errors on first use. - Name/ID Resolution on
api_keys.create(): Pass either a space name or ID when creating API keys—the CLI resolves names automatically via API lookup. - Background Update Check & Upgrade Command: The CLI now checks for new versions in the background and exposes an
upgradecommand to pull the latest release without leaving the terminal. - Single-Host Flags for On-Prem: New
--single-hostand--single-portflags streamline on-prem deployments where all services share a single hostname.
Alyx Improvements
March 20–April 3, 2026- Trace Aggregations: Alyx can now aggregate numeric values from child spans in traces, grouped by attributes in the root span. Ask questions like “compute average token usage by router type” or “calculate total cost by user email” and get instant results.
- Auto-Fix Column Mappings: Alyx automatically detects and fixes broken evaluator column mappings using actual column data. It discovers eval-task pairs needing fixes, verifies data coverage, previews sample values for semantic fit, and applies full mapping updates while preserving correct mappings.
- Auto-Select Preview Spans: After fixing evaluator variable mappings, the preview panel now automatically selects the relevant span with data for each mapped column—no manual selection needed.
- Playground Onboarding: New “Start with Alyx” action on the Playgrounds list opens a new playground and guides you through setting up a customer support bot with datasets, prompts, evaluations, and experiments.
- Custom Metrics Creation: Ask Alyx to create custom metrics using natural language. Alyx generates the query, shows a confirmation drawer for you to review and approve the name and query, and applies it automatically.
- Improved Error Messages: Alyx now shows clear, user-facing error messages when internal model provider errors occur, instead of generic failure states.
Evaluator Improvements
March 23–April 3, 2026- Code Evals in Eval Hub: Code evaluators are now first-class citizens in Eval Hub—create code evaluators (template or custom), version them, and reuse across tasks and experiments. Update an evaluator to save a new version, just like template evaluators.
- Custom Code Evals, Revamped: Live validation surfaces issues in your code block before you submit. Custom evals now support parameters (
self.param_name) and evaluate params, bringing them to parity with template evaluators. - Column Mapping Preview: The same preview panel from template evaluators is now available for code evals, with clear warnings for missing mappings, unresolved columns, and valid state.
- Code Evals in Playground: Select code evaluators from Eval Hub directly in Prompt Playground to score experiment runs.
- Optimization Direction: Evaluators now support optimization direction configuration, letting you specify whether higher or lower scores are better for your evaluation criteria.
- Manual Mode Access: Evaluators are now accessible from the home page in both onboarding and normal views in manual mode.
- Playground Eval Config: Configure evaluators directly in the playground with classification choices and custom scores, explanation toggles, and save configurations to the Eval Hub with version history.
- Task from Span: Create evaluator tasks directly from trace spans in the slideover, keeping the UI in sync with in-flight and newly created evaluators.
- Hide Null Outputs: New toggle in experiments to hide rows where all experiment outputs are null, defaulting to on. State persists via URL.
SDKs & REST APIs
March 20–April 3, 2026New SDK clients and REST API endpoints for managing platform resources programmatically:- Annotation Queues (Python & JavaScript SDKs): Complete annotation queue management in both SDKs with queue CRUD operations, record management, annotation submission, and record assignment. Supports both ALL and RANDOM assignment methods.
- Tasks API (Python & JavaScript SDKs): Comprehensive evaluation tasks support in both SDKs with task CRUD operations, task run management including trigger, list, get, and cancel. Python SDK includes a wait helper with configurable polling and timeout.
- Spans API with Annotations: The Spans API now returns annotations and evaluations in structured form, including user email lookup for user annotations.
- List Spans (JavaScript SDK): The JavaScript SDK now supports listing spans with filtering and pagination capabilities.
CLI Commands
March 20–April 2, 2026New command groups and capabilities for the ax CLI:- New Command Groups: Six new command groups added—ax evaluators for evaluator and version management, ax tasks for evaluation task operations including wait-for-run, ax api-keys for API key lifecycle management, ax ai-integrations for managing OpenAI, Azure, Bedrock, Vertex AI, Anthropic, and custom providers, ax prompts for full prompt lifecycle with versions and labels, and ax roles for role management.
- Name Filters: Added —name / -n option to all list commands that support it, including ai-integrations, annotation-configs, datasets, evaluators, projects, prompts, and tasks. Filter by case-insensitive substring.
- Classification Config: Configure classification evaluators from the terminal with —classification-choices for label-to-score mappings, —direction for optimization direction, and —data-granularity for evaluation scope.
- Agent Skills Install: Interactively install agent skills through the CLI with both interactive and non-interactive options.
Tracing Improvements
March 20–April 2, 2026- Sessions Metrics Bar: New metrics bar for sessions provides at-a-glance visibility into key session statistics and performance indicators.
- Linkable Trace Views: Share specific trace views with colleagues using direct links. Each trace view now has a unique URL for easy collaboration and reference.
Dashboard & Visualization
March 20–April 2, 2026- Cost Formatting: Dashboard charts and pivot tables automatically detect LLM cost dimensions and apply currency formatting with dollar-prefixed values on axes, full precision in tooltips, and auto-defaulting Y-axis labels to “Cost ($)”.
- Pivot Table Cardinality: Non-numeric dimensions in pivot tables now show cardinality and count metrics, making it easier to analyze categorical data distribution.
- Preview Variables: Navigate to latest data and select columns directly in the preview variables panel for faster workflow.
Model & Integration Updates
March 20–27, 2026- Gemini 3.1 Models: Added Gemini 3.1 Pro Preview and Flash Lite Preview to the Vertex AI provider.
- OTLP JSON Support: The OTLP HTTP endpoint now accepts application/json content type in addition to protobuf, making it easier to test with curl and integrate with languages that lack strong protobuf support.
Annotation Improvements
March 25–31, 2026- Queue Record Deletion: Delete annotation queue records individually or in bulk with new management capabilities.
- Accessibility Enhancements: Visual accessibility improvements for annotation queues including zebra striping with alternating background colors, bold titles, and increased spacing between configs.
Saved Views on Tracing
March 13–19, 2026Save filters, columns, sort, and time range on Tracing and reuse them anytime. Use the Views dropdown in the Tracing toolbar to switch views, set a personal default per project, or start from built-in Arize Default and Errors views—without reapplying the same setup each session.See Saved views on Tracing.Note: Sort order in saved views applies to timestamp and latency on Tracing today. Support for sorting on additional columns is planned; when available, that sort state will be included in saved views as well.Dashboard export options
March 13–19, 2026- Full dashboard PDF: Download a PDF of the entire dashboard.
- Single-widget PDF: Download a PDF of one widget.
- Widget CSV: Download CSV data for a widget.
SDKs & REST APIs
March 13–19, 2026New SDK clients and REST API endpoints for managing platform resources programmatically:- Evaluators (Python & JavaScript SDKs): Create, manage, and version evaluators programmatically through Python and JavaScript SDKs. Full create, read, update, and delete operations for evaluators, plus list, create, and retrieve for evaluator versions. Enables automated evaluator lifecycle management and integration of evaluation workflows into existing development processes.
- Prompts (Python & JavaScript SDKs): Manage prompts and prompt versions through Python and JavaScript SDKs with full create, read, update, and delete operations across all prompt and version endpoints. Includes label management for organizing and retrieving specific versions. Set labels like “production” on any version for easy resolution, and labels automatically move when reassigned.
- AI Integrations (Python SDK): Connect Arize AX with AI frameworks programmatically through the Python SDK. List, create, update, and delete integrations to automate the setup of instrumentation and monitoring across your AI applications.
- Roles Management: Create, read, update, and delete custom roles through the API, enabling programmatic role management and automated access control workflows across your organization.
- Name-Based Search: Find resources faster with case-insensitive name search across all major list endpoints including projects, prompts, datasets, experiments, spaces, annotation configs, and annotation queues. Flexible substring matching enables quick resource location without remembering exact names.
- Space Deletion: Manage the full space lifecycle through the API with the ability to delete spaces programmatically, completing the set of space management operations.
Evaluator Improvements
March 13–19, 2026- Evaluator preview: The evaluator preview has been updated and the creation flow is streamlined so you can move from setup to validation with fewer steps.
- Online Task Resources Configuration: Configure CPU and memory resources for online task evaluators to optimize performance and cost based on workload requirements. Provides more granular control over how evaluations run at scale.
Annotation Improvements
March 13–19, 2026- Queue Records Management: Add and delete records from annotation queues with new record operations. Assignee and status filters now persist in the URL for easy sharing and bookmarking, with an empty state UI for guidance when no filters are applied.
- Session Slideover Annotations: The annotate button has moved from individual messages to the trace level in session conversations for clearer context. A trace number subtitle now appears in the annotation panel, making it clear which trace is being annotated.
- View Source Data: Clicking “View Source Data” in annotation queues now opens the full span dialog instead of a limited preview, providing complete trace context for more informed annotation decisions.
Alyx Improvements
March 13–18, 2026- Multi-Span Support: Alyx can now analyze and work with multiple spans simultaneously, enabling more powerful conversational debugging and analysis workflows across traces without switching context.
- Dataset Page Context: Alyx now has richer awareness on dataset pages, including selected experiments, latest available experiments, and active evaluators. Provides more relevant, context-specific assistance when working with datasets and experiments.
- Auto-Trigger on Destination Pages: When the home page Alyx links to another page, it can now auto-open the destination page’s Alyx with context pre-loaded, providing seamless continued help across navigation.
CLI Commands
March 13–17, 2026New CLI commands for managing spaces and profiles:- Spaces Management: Create, list, get, and update spaces directly from the command line with formatted table output. The Spaces API has been promoted to stable, providing reliable programmatic access to space management.
- Profile Recovery: The CLI now gracefully handles invalid or extra configuration fields instead of crashing. A new profile fix command helps diagnose and repair broken profile configurations, enabling quick recovery from configuration issues without manual file editing.
Bedrock Integration Updates
March 16–17, 2026- Bearer Token Authentication: Added support for AWS Bedrock integrations using bearer token authentication, providing a simpler alternative to IAM-based credential management for teams that prefer token-based auth workflows.
- Inference Profile Support: AWS Bedrock inference profiles are now fully supported without requiring model IDs to be in a predefined allowlist. Unknown inference profile identifiers pass through directly to Bedrock for native error handling, enabling immediate use of custom or newly released profiles.
Dataset Summary Columns
March 17, 2026Dataset pages now display summary evaluation scores and annotation counts with token usage metrics in dedicated columns. Quickly assess dataset quality and annotation progress at a glance without opening individual records, streamlining your data review workflow.REST APIs
March 6–11, 2026New REST API endpoints for managing core platform resources programmatically:- Prompt Version & Label Management: Create, retrieve, and manage prompt versions with labels like “production” for easy resolution. List all versions of a prompt, create new versions with commit messages, and set/replace labels on versions. Labels automatically move when reassigned, ensuring the correct version is always referenced.
- API Keys Management (Python & JavaScript SDKs): Create, list, and delete API keys programmatically through Python and JavaScript SDKs. Two types of keys available: user keys that inherit individual user permissions and can be created in multiples, and service keys tied to bot users for organizational continuity. Enables secure automation and integration with external systems while ensuring service accounts remain functional even when team members leave.
- AI Integrations: List, create, update, and delete integrations with cursor-based pagination and space filtering. Connect Arize AX with various AI frameworks like OpenAI Agents, LangGraph, and Autogen for automatic instrumentation and monitoring with just a few lines of code, dramatically simplifying observability infrastructure.
- Evaluators: List evaluators programmatically with cursor-based pagination and space filtering. Each evaluator includes ID, name, description, space ID, task type, tags, current version, and timestamps. Transform subjective AI outputs into measurable, trackable metrics that enable teams to confidently iterate on applications and ensure consistent quality at scale.
- Annotation Queue Records: Retrieve annotation queue records via REST API with pagination support. View annotations, assigned users with status, source data, and evaluations for each record. Streamlines the annotation workflow by providing programmatic access to centralized data labeling processes, ensuring organized and consistent annotation tracking across teams.
Alyx Improvements
March 6–9, 2026- Home Chat: Interactive chat interface on the home page with revolving Alyx title changes. Get context-aware assistance for AI engineering tasks including troubleshooting traces, optimizing prompts, building evaluations, and analyzing experiments. Alyx provides relevant, surface-specific skills and can translate natural language into queries, offering intelligent analysis to streamline workflows.
- Bedrock Integration: Use AWS Bedrock integrations as the model powering Alyx. Pass provider parameters (region, anthropic_version, etc.) through the full stack from UI to generative services. A warning icon appears when a Bedrock integration is selected without a configured region, opening a dialog to persist parameters to localStorage for automatic message retry.
- Session Reading: Alyx can now read and analyze sessions with two new tools: get session table preview for an overview of the sessions table, and get session data to see all traces within a session. Regardless of selected time range, tools that fetch assets by ID now look in a minimum 60-day window. Improved large JSON compression logic maintains valid JSON structure and adds pagination indicators.
Saved Views for Playground
March 11, 2026Save complete snapshots of your prompt experimentation sessions including model configurations, parameters, prompts, inputs, and results. This makes AI prompt development reproducible and collaborative—preserve your work, return to previous experiments without recreating setups from scratch, share exact configurations with teammates, and track how prompts evolve over time with version control.Evaluators in Playground
March 11, 2026Test and measure LLM system performance in real-time before deploying evaluations. Run evaluators directly in the Prompt Playground to assess how well your prompts, agents, or retrieval systems perform on specific tasks by creating custom metrics. Validate and optimize your LLM applications through immediate feedback, ensuring better performance before full implementation.Trace Views
March 10, 2026Query, filter, and inspect captured traces to analyze specific system behaviors and identify issues in your LLM applications or agents. Construct queries using various operators and filters (including AI-assisted search) to narrow down traces by attributes, time ranges, or complex multi-span patterns. Efficiently navigate large volumes of trace data and pinpoint exactly where your AI systems need improvement.CLI Commands
March 9, 2026New CLI commands for managing annotation configs and exporting data:- Annotation Configs CRUD: Create, list, and delete annotation configs through the CLI. Reusable schemas define how to structure human feedback and evaluations across your workspace with consistent rubrics (categorical labels, continuous scores, or freeform text). Consistent annotations enable better error analysis, help build high-quality training datasets, and provide reliable ground truth data for improving prompts and model fine-tuning.
- Dataset, Experiment, and Span Export: Export datasets, experiments, and spans using new CLI commands. Download all examples from datasets, all runs from experiments, or spans filtered by trace/span/session ID. Append examples to existing datasets from inline JSON or files (CSV, JSON, JSONL, Parquet) with client-side structural validation and server-side field-level validation.
Projects in Navigation
March 9, 2026Access your tracing projects directly from the navigation menu with a hover menu displaying your top 5 projects. This dedicated workspace organizes all related traces, evaluations, and sessions for a specific use case or model in one place, allowing you to isolate different products or models and visualize agent execution patterns to identify bottlenecks and understand agent reasoning.Gemini Provider Support
March 6, 2026Connect your Google API key to access Gemini and Gemma models directly within the Arize AX platform. Use Gemini models for prompt playground experimentation, model evaluation, and function calling with structured outputs. Gemini models support function calling and structured output; Gemma models do not support these features but are available for general tasks.Code Evaluator in New Evaluator Dropdown
March 5, 2026Create code evaluators directly from the New Evaluator dropdown menu. The evaluator-first creation experience includes an inline data source selector for projects and datasets. Code evaluators provide fast, consistent, and efficient evaluation for objective criteria like keyword checks, URL validation, or compliance rules without the variability of LLM-based judgments.Test LLM Evaluator While Creating
March 5, 2026Test evaluators with a single-shot evaluation against the currently selected datasource row and see results (label/score/explanation) inline while creating or editing. The “Test Evaluator” button in the preview variables panel allows validation of evaluation criteria, input variables, and expected outputs before running full evaluations, saving time and ensuring accurate quality assessments.February 24, 2026
What’s new with Alyx
Alyx is your AI-powered agent across Arize AX—Alyx can use Arize for you, so you get context-aware help wherever you’re working. We’ve built a top-tier agent that’s actually useful: your best friend for building, debugging, and improving AI. This release highlights new skills, model options, and integrations.Alyx by surface
Alyx adapts to where you are in the platform and exposes the right skills:- Trace slideover — Trace troubleshooting, span analysis, annotations, build evals
- Prompt Playground — Optimize prompts, build evals, run experiments
- Eval Builder / Task Builder — Build custom evals, configure tasks
- Traces table (AI Search) — Natural language to filter syntax in the traces table
- Traces page — Multi-trace analysis, pattern discovery, categorization
- Datasets & Experiments — Analyze experiments, manage datasets, synthetic data
Cross-cutting skills
- ArizeQL Generator — Turn natural language or existing code (SQL, Python) into AQL for custom metrics
- Optimize Prompts — Improve prompt quality or target specific issues
Use your own integrations
Use OpenAI or Anthropic (via AWS Bedrock and Vertex AI) with Alyx. Add and manage integrations in Settings → Account Settings → Integrations. More providers coming soon.Default model
Claude Sonnet 4.5 is now the default model for Alyx, giving you a strong balance of speed and capability out of the box. You can change the model in Alyx settings or via your configured integrations.February 17, 2026
Enhanced Scheduled Task Management
Edit scheduled automation tasks directly from the table with full control over:- Target execution date modification using a date/time picker
- Arguments editing via comma-separated text fields
- Input JSON payload updates with built-in validation
- Real-time status validation ensuring only scheduled tasks can be modified
Claude Opus 4.6 on AWS Bedrock
Access Anthropic’s most advanced AI model through AWS Bedrock, featuring:- State-of-the-art performance for coding, agentic workflows, and complex enterprise tasks
- Extended context windows supporting up to 1 million tokens
- Enterprise-grade deployment through AWS infrastructure
Tracing Monitors Unification
Streamlined monitor creation experience with a unified flow for all LLM and tracing monitors:- Single creation path through the Tracing Project Monitor flow
- Improved model selection with paginated ComboBox and model type filtering
- Prefilled attributes from empty-state action cards for faster setup
- Type column in ML monitors table for better organization
Annotation Config REST API
New REST API endpointGET /v2/annotation-configs provides programmatic access to annotation configurations with:- Paginated listing of all accessible annotation configs
- Complete metadata including type, optimization direction, labels, and score ranges
- RBAC enforcement ensuring users only see configs they have permission to access
Prompt Version Persistence in Playground
LLM integration selection is now preserved when saving and loading prompts, ensuring:- Correct model integration restored when loading saved prompts
- Consistent behavior across UI saves and Alyx-initiated saves
- Version continuity maintaining integration settings across prompt iterations
Enhanced Dashboard Templates
Improved dashboard creation experience with:- Updated empty state showing action cards for Token Tracking, Latency templates, and blank dashboards
- Pre-filled dashboard names for faster setup
- Streamlined modals with automatic model version detection for LLM projects
Prompts in Experiments Table
The experiments table now displays prompt information directly with:- Prompt name and version shown in a dedicated column
- Template preview on hover showing system and user messages
- Full prompt slideover with detailed message inspection
- Direct playground navigation opening experiments with their original prompts loaded
Enhanced Annotation Queue Filtering
Improved annotation queue management with flexible filtering options:- Status-based filtering to view records by completion state
- User assignment filtering to see records assigned to specific annotators
- Combined filters supporting status and user criteria simultaneously
Improved Evaluator Preview Panel
Enhanced span preview in evaluator configuration with:- Smart column sorting showing columns with values first
- Alphabetical organization within value/no-value groups
- Better usability when working with projects containing many columns
RBAC Full Lineage Support
Comprehensive role-based access control with complete resource lineage:- Fine-grained permissions for prompts, evaluators, and annotation configs
- Hierarchical authorization following space and account relationships
- Consistent enforcement across mutations, resolvers, and shields
Text Annotation Updates via SDK
The annotations API now supports updating freeform text annotations programmatically, enabling:- Bulk annotation updates through the SDK
- Automated annotation workflows for text feedback
- Complete annotation lifecycle management via API
Eval Traces in Playground Experiments
Direct trace links from playground experiment results with:- Clickable trace links in experiment comparison views
- Span-level visibility for evaluations kicked off via playground
- Seamless debugging from experiment results to detailed trace data
Invocation Parameters for Online Tasks
Online task LLM configuration now supports full invocation parameter customization:- Provider-specific parameters for each LLM provider
- Flexible model configuration separating client setup from invocation settings
- Consistent interface across different LLM providers
Delete Projects and Models from Tables
Delete projects and models directly from the table view with improved safety controls:- Action column in tables - access delete functionality without navigating to individual project pages
- Type-to-confirm deletion - must enter the exact project or model name to prevent accidental deletions
- Streamlined workflow - manage your workspace organization more efficiently
Create and Manage Prompts via API
New REST API endpoints enable programmatic prompt management:- Create prompts - POST
/v2/promptsto save prompts with model parameters, tools, and response formats - List prompts - GET
/v2/promptswith filtering by space, cursor-based pagination, and sort by last updated - Get prompt details - GET
/v2/prompts/{prompt_id}to retrieve specific prompt configurations - Delete prompts - DELETE
/v2/prompts/{prompt_id}to remove prompts programmatically - Version control - systematically manage prompt variations across environments and track changes over time
Query Spans with Powerful Filters
New/v2/spans endpoint enables sophisticated trace data analysis:- Complex filtering - query spans by status code, time range, and custom attributes
- Pagination support - efficiently retrieve large result sets with cursor-based navigation
- Project-scoped access - filter spans within specific projects with proper RBAC enforcement
- Programmatic debugging - quickly identify errors, performance bottlenecks, and behavioral patterns without manual searching
Escaped Curly Braces in Eval Templates
Include literal JSON examples in evaluation prompts without triggering template variable errors:- Backslash escape syntax - use
\{...\}to include curly braces as literal text - JSON examples support - safely include code snippets like
\{"component":"chat-response"\}in prompts - Cross-stack compatibility - works consistently across frontend, backend TypeScript, Python, and Go services
- Template flexibility - combine template variables
{variable}with escaped literals\{literal\}in the same prompt
Trace Links in Playground Experiments
Navigate directly from experiment results to full trace details:- Clickable trace links - view complete execution details for each playground run
- Available in multiple views - access traces from dataset pages, experiment comparison views, and the playground
- Bridge experimentation and observability - understand both output quality and execution behavior (latency, costs, tool calls) for every experimental run
Internal Playground Tracing
All playground interactions are now automatically traced for debugging and analysis:- Automatic capture - playground experiments generate traces without manual instrumentation
- Full observability - view latency, token counts, and execution details for every playground run
- Debugging capabilities - troubleshoot issues by examining complete execution paths
- Performance metrics - track and optimize playground interactions with detailed span data
Enhanced Experiment Metadata
Comprehensive tracing metadata makes it easier to connect experiments to their evaluation results:- Run and evaluator tracking -
runIdandevaluatorIdlink traces to specific experiment executions - Parent task relationships -
parentTaskIdandparentTaskRunIdconnect chained evaluations - Row identifiers -
spanIdfor tracing data andexampleIdfor dataset evaluations - Prompt templates - capture template strings and variables for reproducibility
Select All Spans Moved to Floating Panel
Improved trace table UI with better multi-select controls:- Floating action panel - “Select All Spans” button relocated to the floating panel for easier access
- Cleaner table view - removed dedicated row for select-all, reducing visual clutter
- Streamlined selection - manage span selections more efficiently with grouped controls
Annotation Queue Progress Tracking
Better visibility into annotation workload distribution:- Total assigned records - see how many records are assigned to annotators in each data cluster
- Workload balancing - monitor task distribution across annotation teams to ensure balanced allocation
ax-client SDK Published
The official Arize AX client SDK is now available for TypeScript/JavaScript projects:- Datasets API - create, list, update, and delete datasets programmatically
- Experiments API - manage experiment runs and retrieve results
- Examples API - append and update examples in datasets
- Type-safe imports - full TypeScript support with generated types
- Environment variable configuration - simple setup with API keys
Clickable Span Table Rows
Navigate directly to span details by clicking anywhere in the row:- Full row clickable - entire table row is now interactive for easier navigation
- Faster debugging - quickly jump to span details without precise clicking on specific cells
- Improved UX - more intuitive interaction pattern consistent with modern data tables
Dataset Examples Sorting
Organize dataset examples with flexible sorting options:- Sort by creation date - see newest or oldest examples first
- Sort by update date - identify recently modified examples
- Sort by ID - consistent ordering for reproducible views
Pivot Table Dashboard Widgets
Create custom analysis views with configurable pivot tables:- Group by dimensions - organize data by categorical fields
- Configurable metrics - select numeric columns with aggregation functions (sum, average, count)
- Ad-hoc analysis - explore data patterns without predefined reports
- Dashboard integration - save pivot configurations as reusable dashboard widgets
Authentication Type for LLM Integrations
Database support for different authentication methods with LLM providers:- Auth type column - stores authentication method for each LLM integration
- Multiple auth strategies - prepares platform for API keys, OAuth, and service accounts
- Provider flexibility - manage credentials differently for various LLM providers
Phoenix Import Dedicated Tab
Simplified migration experience for Phoenix users:- Dedicated import tab - separate “Import From Phoenix” tab in project creation
- Traces-only focus - streamlined UI showing only trace connection form
- Cleaner onboarding - removed Phoenix card from LLM tracing setup to reduce confusion
- Feature flag control - controlled rollout with
enablePhoenixMigrationflag
Claude Opus 4.6 on Vertex AI
Access Anthropic’s most advanced model through Google Cloud:- Vertex AI integration - Claude Opus 4.6 now available in playground and online tasks
- 1M token context window - handle extensive documents and conversations
- Enhanced reasoning - state-of-the-art performance on coding and complex workflows
- Enterprise deployment - leverage Google Cloud infrastructure for Claude models
External HTTPS Access to Clusters
Simplified network access for external integrations:- Port 443 ingress - external HTTPS traffic now allowed to cluster endpoints
- Secure external access - properly configured TLS/SSL for organization-wide availability
- Integration support - enables webhooks, API callbacks, and external monitoring tools
Deployment Activity Heatmap
Visualize deployment patterns over time with a GitHub-style contribution graph:- 52-week view - see deployment activity for the past year at a glance
- Color-coded frequency - darker cells indicate more deployments on that day
- Interactive tooltips - hover to see date, deployment count, and services deployed
- Summary statistics - total deployments and max-per-day metrics
- Filter compatibility - heatmap updates based on service filters
AI Features Timeline Improvements
Better organization of AI features with date-based filtering:- Recent activity focus - main tab shows only features from the last 7 days
- Full history tab - new “History” tab provides access to all past features
- View full history link - easily navigate between recent and historical views
- Direct URL support -
?tab=historyparameter for bookmarking and sharing
Improved Feature Generation Reliability
More robust AI feature generation with better error handling:- Exponential backoff - automatic retries for rate limits and transient errors
- Branch diff context - includes current changes in prompts for better iteration
- Operation tracking -
operationUuidfield tracks async generation jobs - Collapsible logs UI - view generation logs with auto-scroll and syntax highlighting
GKE Infrastructure Upgrades
Enhanced Kubernetes infrastructure for improved performance and cost efficiency:- GKE 1.33.5 - updated cluster and node pool versions
- Spot node pools - 60-91% cost savings for fault-tolerant workloads
- Extended IAM permissions - SecuritySMTP role updated with required access tokens
- DevOps logging access -
roles/logging.viewergranted for improved debugging
Enhanced Usage Monitoring
New comprehensive usage tracking and reporting features for better resource management:- Datasource-level breakdowns for granular usage visibility
- Account-based tracking with improved join keys for accurate reporting
- 10-minute update intervals for near real-time usage insights
- Automated cleanup of expired data for accurate retention calculations
Enhanced Platform Stability
January 2026Numerous improvements to platform reliability and performance:- Configuration drift resolution in GCP Terraform
- Enhanced error handling across services
- Improved logging and monitoring for faster troubleshooting
- Database migration optimizations for schema updates
- Better resource management for high-volume workloads
Improved Onboarding Experience
Streamlined onboarding with enhanced user flows:- Redesigned onboarding cards with clearer visual hierarchy
- “My First Playground” experience for hands-on experimentation
- Role collection during signup for personalized setup
- Custom hover states matching each card’s accent color
Real-Time Evaluations
Run evaluations immediately on incoming data with real-time ingestion:- Instant evaluation of production traces without delays
- Latent evaluation support for updating earlier spans
- Seamless cutover between batch and real-time processing
- Available across all Arize AX tiers by default
AWS Bedrock Custom Endpoints
Enhanced AWS Bedrock integration for enterprise deployments:- Custom base URL support for private endpoints
- Inference profile ARNs for multi-region routing
- Custom model configurations for specialized deployments
- Simplified regional management with unified tracking
Wildcard Array Path Variables
Access array data more flexibly in templates and experiments:- Wildcard (
*) patterns to reference all array elements - Last-index (
-1) access for the most recent item - Automatic generation of wildcard variants for convenience
- Support in task variables and experiment columns
Improved Queue Management
Better user experience when managing annotation queues:- Duplicate detection with clear error messages
- Added and skipped record counts after bulk operations
- Actionable feedback when attempting to add existing records
Enhanced RBAC System
Fine-grained access control with the new RBAC system:- Custom roles with specific permissions
- Space-level role bindings for granular access management
- Coexistence with legacy roles during migration
- UI support for role assignment across all user management pages
- Automatic fallback to legacy roles when custom roles are deleted
Custom Metrics with LIKE Operator
More powerful filtering in custom metrics:- LIKE and ILIKE operators for pattern matching
- Wildcard support with
%syntax - Case-insensitive matching with ILIKE
- Optimized query execution for performance
Dashboard Template Filtering
Cleaner dashboard creation experience:- LLM-only space filtering shows only relevant templates
- Context-aware templates based on project types
- Reduced clutter in template selection
- Consistent experience across spaces and projects
Pivot Table Widget Schema
Foundation for advanced tabular data visualization:- Grouped categorical dimensions for organized views
- Configurable numeric columns with aggregations
- Flexible filtering and time range support
- Dashboard integration ready
Evaluator Hub: Reusable Evaluators
We’re excited to introduce the Evaluator Hub - a centralized place to create, version, and reuse evaluators across all your evaluation tasks.Why Reusable Evaluators?
Previously, evaluators were defined inline each time you created a task. This led to duplicated configurations, inconsistent evaluation criteria, and extra setup overhead. With the Evaluator Hub, you define an evaluator once and use it everywhere - ensuring consistent, reliable evaluations across your organization.Key benefits:- Consistency: The same evaluator definition is used across tasks, eliminating drift in evaluation criteria
- Reliability: LLM configuration (model, provider, parameters) is set at the evaluator level, ensuring the evaluator is tested and validated with a specific model before being deployed to production tasks
- Version Control: Track changes to evaluators over time with commit messages, making it easy to audit and roll back if needed
- Flexibility: Column mappings let you reuse the same evaluator across datasets with different schemas by mapping template variables to your data columns
What’s New
- Evaluator Hub tab: Browse, search, and manage all your evaluators in one place
- Running Tasks tab: View and manage your active evaluation tasks
- “Use Evaluator” action: Quickly create a task with any evaluator pre-selected
- Column Mappings: Map evaluator template variables to your datasource columns when adding an evaluator to a task
- Evaluator Versioning: Create new versions of evaluators with commit messages to track changes
Getting Started
- Navigate to Evaluators in the left sidebar
- Click New Evaluator to create your first reusable evaluator
- Choose from pre-built templates or create a custom evaluation from scratch
- Use your evaluator in tasks by clicking Use Evaluator or selecting it when creating a new task
Session Evaluations with Conversation Context
Evaluate entire conversation flows with new virtual attributes:{conversation}template variable for session-level evaluations- Chronologically ordered input/output pairs
- Automatic aggregation of multi-turn dialogues
- Root span filtering for accurate session context
Tracing Configuration for Evaluation Tasks
Enable detailed debugging for evaluation tasks:- Toggle tracing on/off in Advanced Options
- Automatic trace generation for monitoring and debugging
- Persistent settings saved with your tasks
- Production-ready visibility into evaluation execution
Improved Error Handling for Exceptions
Better filtering and debugging capabilities:- Filter by
exception.typeandexception.messagein the UI - OpenInference semantic convention support for exceptions
- Consistent data structure across datasources
- Faster troubleshooting of error patterns
SAML Role Mapping Search
Navigate large role mapping configurations easily:- Client-side search across attributes, spaces, roles, and organizations
- Visual highlighting of search matches
- Keyboard navigation through results
- Improved usability for enterprise customers
Enhanced Dashboard Time Persistence
Your dashboard preferences now persist automatically:- Auto-save time range, time zone, and granularity selections
- Instant restoration when returning to dashboards
- Per-dashboard settings for customized views
- Seamless experience across sessions
Resizable Trace Slideover
Customize your viewing experience:- Draggable slideover width for optimal layout
- Persistent sizing preferences across sessions
- Better content visibility for long traces
Trace Table Performance Improvements
Faster loading times for the tracing table:- 30-50% faster initial load times
- String truncation for large content
- Lazy loading of full values in tooltips
- Minimal impact on user experience
Scatter Plot Widgets
Explore relationships between variables with scatter plots:- Correlation analysis for two numeric dimensions
- Interactive data points for detailed investigation
- Dashboard integration for visual analytics
- Customizable axes and filtering
Enhanced Session Slideover
Better conversation visualization and navigation:- Trace labels with links to detailed views
- Visual separators between traces
- Hover highlighting synchronized between list and conversation
- Improved readability for multi-turn interactions
Experiment Task Timeout Configuration
Accommodate long-running evaluations:- Configurable timeout parameter beyond 120 seconds
- Function-level control in run_experiment and evaluate_experiment
- Backward compatibility with default values
- Support for complex evaluators requiring extended processing
Configurable Experiment Timeout
Handle complex evaluation scenarios:- Custom timeout values for long-running tasks
- Per-experiment configuration for flexibility
- Backward compatible defaults for existing code
Expandable Trace Hierarchy
View trace structure directly in the table:- Expand traces to see child spans inline
- Hierarchical visualization without opening slideouts
- Faster navigation through complex traces
- Contextual understanding of request flow
Custom Prompt Release Labels
Organize and track prompt versions with custom labels:- Tag prompt versions with meaningful identifiers
- Environment markers like “staging” or “production”
- Dynamic label suggestions from existing prompts
- Easy retrieval of specific prompt releases
Eval Hub Enhancements
Improved evaluation management and visibility:- Model information in evaluator listings with provider icons
- Evaluator counts in running tasks with hover details
- Automatic save when creating or editing evaluators
- Streamlined task flow for faster evaluation setup
Todo List Management Improvements
More reliable task tracking in Alyx conversations:- Visual status indicators for all todo states
- Dynamic reminders with exact update calls needed
- Plan preservation across human-in-the-loop pauses
- Clearer instructions positioned near the plan
Span-to-Queue Workflow
Add spans and dataset examples to annotation queues seamlessly:- Multiple entry points from spans table, trace slideover, and queue records
- New or existing queue selection
- Batch operations for efficient queue population
- Dataclusters integration for reliable processing
Atlantis Terraform Automation
Streamlined infrastructure-as-code workflows:- Pull request integration for Terraform plans
- Automated plan posting as PR comments
- DevOps team permissions for webhook debugging
- Structured review process before applying changes
Java SDK Space ID Support
Modern authentication for Java applications:- Space ID authentication (space keys deprecated)
- Backward compatibility maintained with existing constructors
- Updated documentation and examples
- Test coverage for new authentication method
Enhanced Space Model Schema
More control over data retention and lookback:- Space-level schema lookback overrides for custom retention
- Model-specific configurations for unique requirements
- Flexible data management across different use cases
Exact Match Code Evaluator
New built-in evaluator for validation:- String equality checks for exact matches
- Expected vs actual comparisons for testing
- Multi-field access with dataset row support
- Alphabetically sorted evaluator list in UI
Enhanced Annotation Configs
More powerful annotation workflows with improved configs:- Color-coded categories based on optimization direction
- Read-only view for reviewing existing configs
- Optimization direction control (maximize, minimize, or none)
- Clear label guidance for consistent evaluations
Batch Annotation Updates
Efficiently annotate large volumes of data:- Optimization direction support in annotation configs
- Category-based labeling for issue detection
- Best practice guidance for naming and structure
- Streamlined categorization workflows
Stacked Bar Chart Widgets
Visualize multi-dimensional data with new chart types:- Stacked bar charts for comparing categories over time
- Optimized queries for fast rendering
- Customizable groupings and dimensions
- Dashboard integration for comprehensive monitoring
Enhanced Eval Hub Empty States
Better guidance for getting started:- Improved empty state design with clear next steps
- Documentation links for learning resources
- Actionable cards for common workflows
Google Analytics 4 BigQuery Sync
Automated analytics data export:- Daily GA4 to BigQuery transfers via Terraform
- Raw event data access for advanced analysis
- Overcome GA4 limitations like sampling and retention
- Custom reporting capabilities with full data access
Vertex AI Migration
Updated integration with Google Cloud AI:- Seamless Vertex AI connectivity for LLM applications
- Enhanced observability for Google Cloud deployments
- Modernized instrumentation for better tracing
Generative Service Monitoring
Comprehensive monitoring for evaluation infrastructure:- Uptime and health alerts with paging
- CPU and memory monitoring with warnings
- Dedicated Grafana dashboard for visibility
- Runbook documentation for incident response
Custom Model Migrations
Expanded support for custom integrations:- Custom model endpoint support in evaluations
- Higher traffic model optimization for performance
- Flexible integration options for enterprise deployments
Prompt Optimization on Experiments
Run prompt optimization directly on experiment results:- Experiment selector in optimization task creation
- Dynamic column resolution for experiment data
- Enhanced iteration on proven prompts
- Seamless workflow from experiments to optimization
Labeling Queue Annotations
More flexible annotation management:- Clear annotations (reset to null) anywhere
- Support across spans, queues, and experiments for consistent workflows
- Improved annotation lifecycle management
Multi-Span Filters
Filter traces using multiple span conditions with:- AND, OR, NOT operators for combining conditions
- Indirectly Calls (->) and Directly Calls (=>) relationship filters
- Up to 5 filters to find complex patterns like “spans where A calls B, but not C” or “traces containing both X and Y”
- Parentheses to build complex queries and pinpoint the traces that matter
Support for Opus & Haiku 4.5
Expanded LLM model support to include Opus & Haiku 4.5 models in the playground and online tasks.Support for GPT-5.2 and GPT-5.2 Pro
Expanded LLM model support to include GPT-5.2 models in the playground and online tasks.Improved Playground Views
The Prompt Playground page is now Playgrounds, where you can use your Playground Views! This change allows you to easily navigate to a configuration of the prompt playground you’ve saved. A playground view saves a complete snapshot of your current prompt playground session, allowing you to preserve your work, share configurations with teammates, or return to previous experiments. Here’s what’s saved in a view:- LLM Config (provider, model selection, model params, custom endpoint settings)
- Prompt Setup (messages, roles, message content, tool and function calls)
- Generated Results (when setup with datasets)
- Connected Datasource (dataset or span)
Realtime Ingestion for all new Arize AX Spaces
Any spaces created on or after 12/5/25 will use realtime ingestion by default! This eliminates the delay between sending traces and seeing them in the platform, giving you instant visibility into your production workloads.Structured Outputs Support for Playground
Session Annotations
- Input/Output Level: Attach insights to specific output messages, automatically linked to the root span of the trace.
- Span Level: Dive deeper into a trace and annotate individual spans for precise, context-rich feedback.
Integrations Revamp

OpenInference TypeScript 2.0
- Added easy manual instrumentation with the same decorators, wrappers, and attribute helpers found in the Python
openinference-instrumentationpackage. - Introduced function tracing utilities that automatically create spans for sync/async function execution, including specialized wrappers for chains, agents, and tools.
- Added decorator-based method tracing, enabling automatic span creation on class methods via the
@observedecorator. - Expanded attribute helper utilities for standardized OpenTelemetry metadata creation, including helpers for inputs/outputs, LLM operations, embeddings, retrievers, and tool definitions.
- Overall, tracing workflows, agent behavior, and external tool calls is now significantly simpler and more consistent across languages.
API-Driven Monitors

Automatic Threshold Ranges for Monitors
You can now set upper and lower bounds using our new Auto Threshold options!Arize AX can automatically determine the right threshold for your alerts based on your historical data. This is ideal for most users who want to start monitoring without manually tuning thresholds.Data Fabric

New Timeline Tab for Traces

Tags

- Describe source (
from-prod,EHR-record) - Encode purpose (
ab-test,regression-test) - Indicate readiness (
golden,deprecated) - Group by config (
threshold-0.85,cohort_5)
Space level, under Space Settings. They can be reused across entities that belong to that space (Datasets, Experiments, and more). More on Tags.Sort Datasets and Experiment Listing Table

Support for Tool Call IDs in OpenInference Messages
This update introduces full support fortool_call_id and tool_call.id in OpenInference message semantics. These identifiers are now stored alongside input and output messages. Tool call IDs now appear in the trace slideover’s input/output and attributes tabs.Add Data Region to Login Page

Add Auth Failures to Tracing
This release adds tracing for authentication failures, enabling better visibility and debugging of auth-related issues across systems.Total Traces on Stats Bar

Support for GPT OSS Models on Bedrock

Expanded LLM Support
Expanded LLM model support to include Claude models on Bedrock and Vertex, Titan Text Premiere, Amazon Nova Premiere, Gemini 2.5 Flash/Pro, and new GPT OSS and DeepSeek models —offering broader coverage across top providers.Dashboard Widget Time Setting

Autocomplete for Annotations on Datasets

See more
2026
2025
2024