This guide shows you how to instrument a multi-agent application with the Python SDK and send traces to Arize AX. You’ll configure the SDK, build a financial research agent, and view the complete execution flow in the form of traces. While this example uses CrewAI, Arize AX supports many agent frameworks and LLM providers. Browse the complete list of integrations on our Integrations Page.

Why Trace with the Arize AX Python SDK?

Traditional logging and monitoring tools weren’t built for LLM applications. When your agent makes multiple LLM calls, tool invocations, and complex decision paths, you need visibility into:
  • What actually happened during execution
  • Where time was spent across your workflow
  • Which agents and tools were invoked and in what order
  • The full context of inputs, outputs, and intermediate steps

Prerequisites

To follow along, you’ll need: This example uses OpenAI for LLM calls and Serper for web search capabilities in our financial research agent.

Follow along with code

This guide has a companion notebook with runnable code examples. Find it in this notebook.

Step 1: Set Up Your Arize AX Account

Before we can send traces anywhere, we need Arize AX configured. In this step, we’ll create an Arize account and get the credentials we need. If you already have an account, you can skip to the next step.

Get Your Credentials

  1. Sign up for a free Arize AX account.
  2. From the dashboard, create or select a Space.
  3. Navigate to SettingsAPI Keys to create and save an API key.
  4. Note your Space ID — you’ll find this in the URL or in your space settings.
These credentials are what connect your application to Arize AX so traces can be sent and stored.

Step 2: Install and Configure the SDK

Now that you have Arize credentials, we need to connect your application to send traces. Here, we’ll install the necessary packages and configure the SDK to send traces to Arize AX. After setup, each time you run your application, traces will automatically appear in a project within the Arize AX dashboard.

Install Your Packages

The Python SDK uses a modular approach—you install the base package plus any extras you need.
pip install "arize[otel]"
We’ll also install the packages needed for automatic tracing, CrewAI, OpenAI, and evaluations (which we’ll use in a later part of the tutorial):
pip install crewai crewai-tools openinference-instrumentation-crewai openai openinference-instrumentation-openai arize-phoenix-evals

Set Your API Keys

import os

os.environ["ARIZE_API_KEY"] = "<ENTER YOUR ARIZE API KEY>"
os.environ["ARIZE_SPACE_ID"] = "<ENTER YOUR ARIZE SPACE ID>"
os.environ["SERPER_API_KEY"] = "<ENTER YOUR SERPER API KEY>"
os.environ["OPENAI_API_KEY"] = "<ENTER YOUR OPENAI API KEY>"

Register Your Project in Arize

Next, we’ll register a tracer provider linked to a project in Arize. This project is where your traces will show up in the UI. The arize-otel package handles the setup automatically.
from arize.otel import register

tracer_provider = register(
    space_id=os.getenv("ARIZE_SPACE_ID"),
    api_key=os.getenv("ARIZE_API_KEY"),
    project_name="arize-sdk-quickstart",
)
At this point, your application is configured to send traces to Arize AX!

Step 3: Instrument Your Application

Next, we need to enable automatic instrumentation for our framework (CrewAI) and LLM Provider (OpenAI). We’ll use OpenInference instrumentors to automatically trace LLM calls and agent execution. This means you get comprehensive tracing without manually adding instrumentation code throughout your application.
from openinference.instrumentation.openai import OpenAIInstrumentor
from openinference.instrumentation.crewai import CrewAIInstrumentor

# Finish automatic instrumentation
OpenAIInstrumentor().instrument(tracer_provider=tracer_provider)
CrewAIInstrumentor().instrument(tracer_provider=tracer_provider)
With these instrumentors in place, every LLM call and agent action will automatically create spans in Arize. You don’t need to modify your application code—the instrumentation happens transparently.

Step 4: Create Your Agent

With tracing configured, let’s build the agent application that will generate traces we can analyze in Arize AX. We’ll build a Financial Analysis and Research agent with CrewAI. While this example focuses on CrewAI, you can use any of the supported frameworks that integrate automatically with Arize AX. This agent is made up of:
  • Two sub-agents: a Research agent and a Writer agent
  • Two tasks: one for financial research and one for generating a summary report
  • One tool: SerperDevTool for real-time web search

View Full Agent Implementation

For the complete agent implementation with all code examples, see the notebook.

Create and Run the Crew

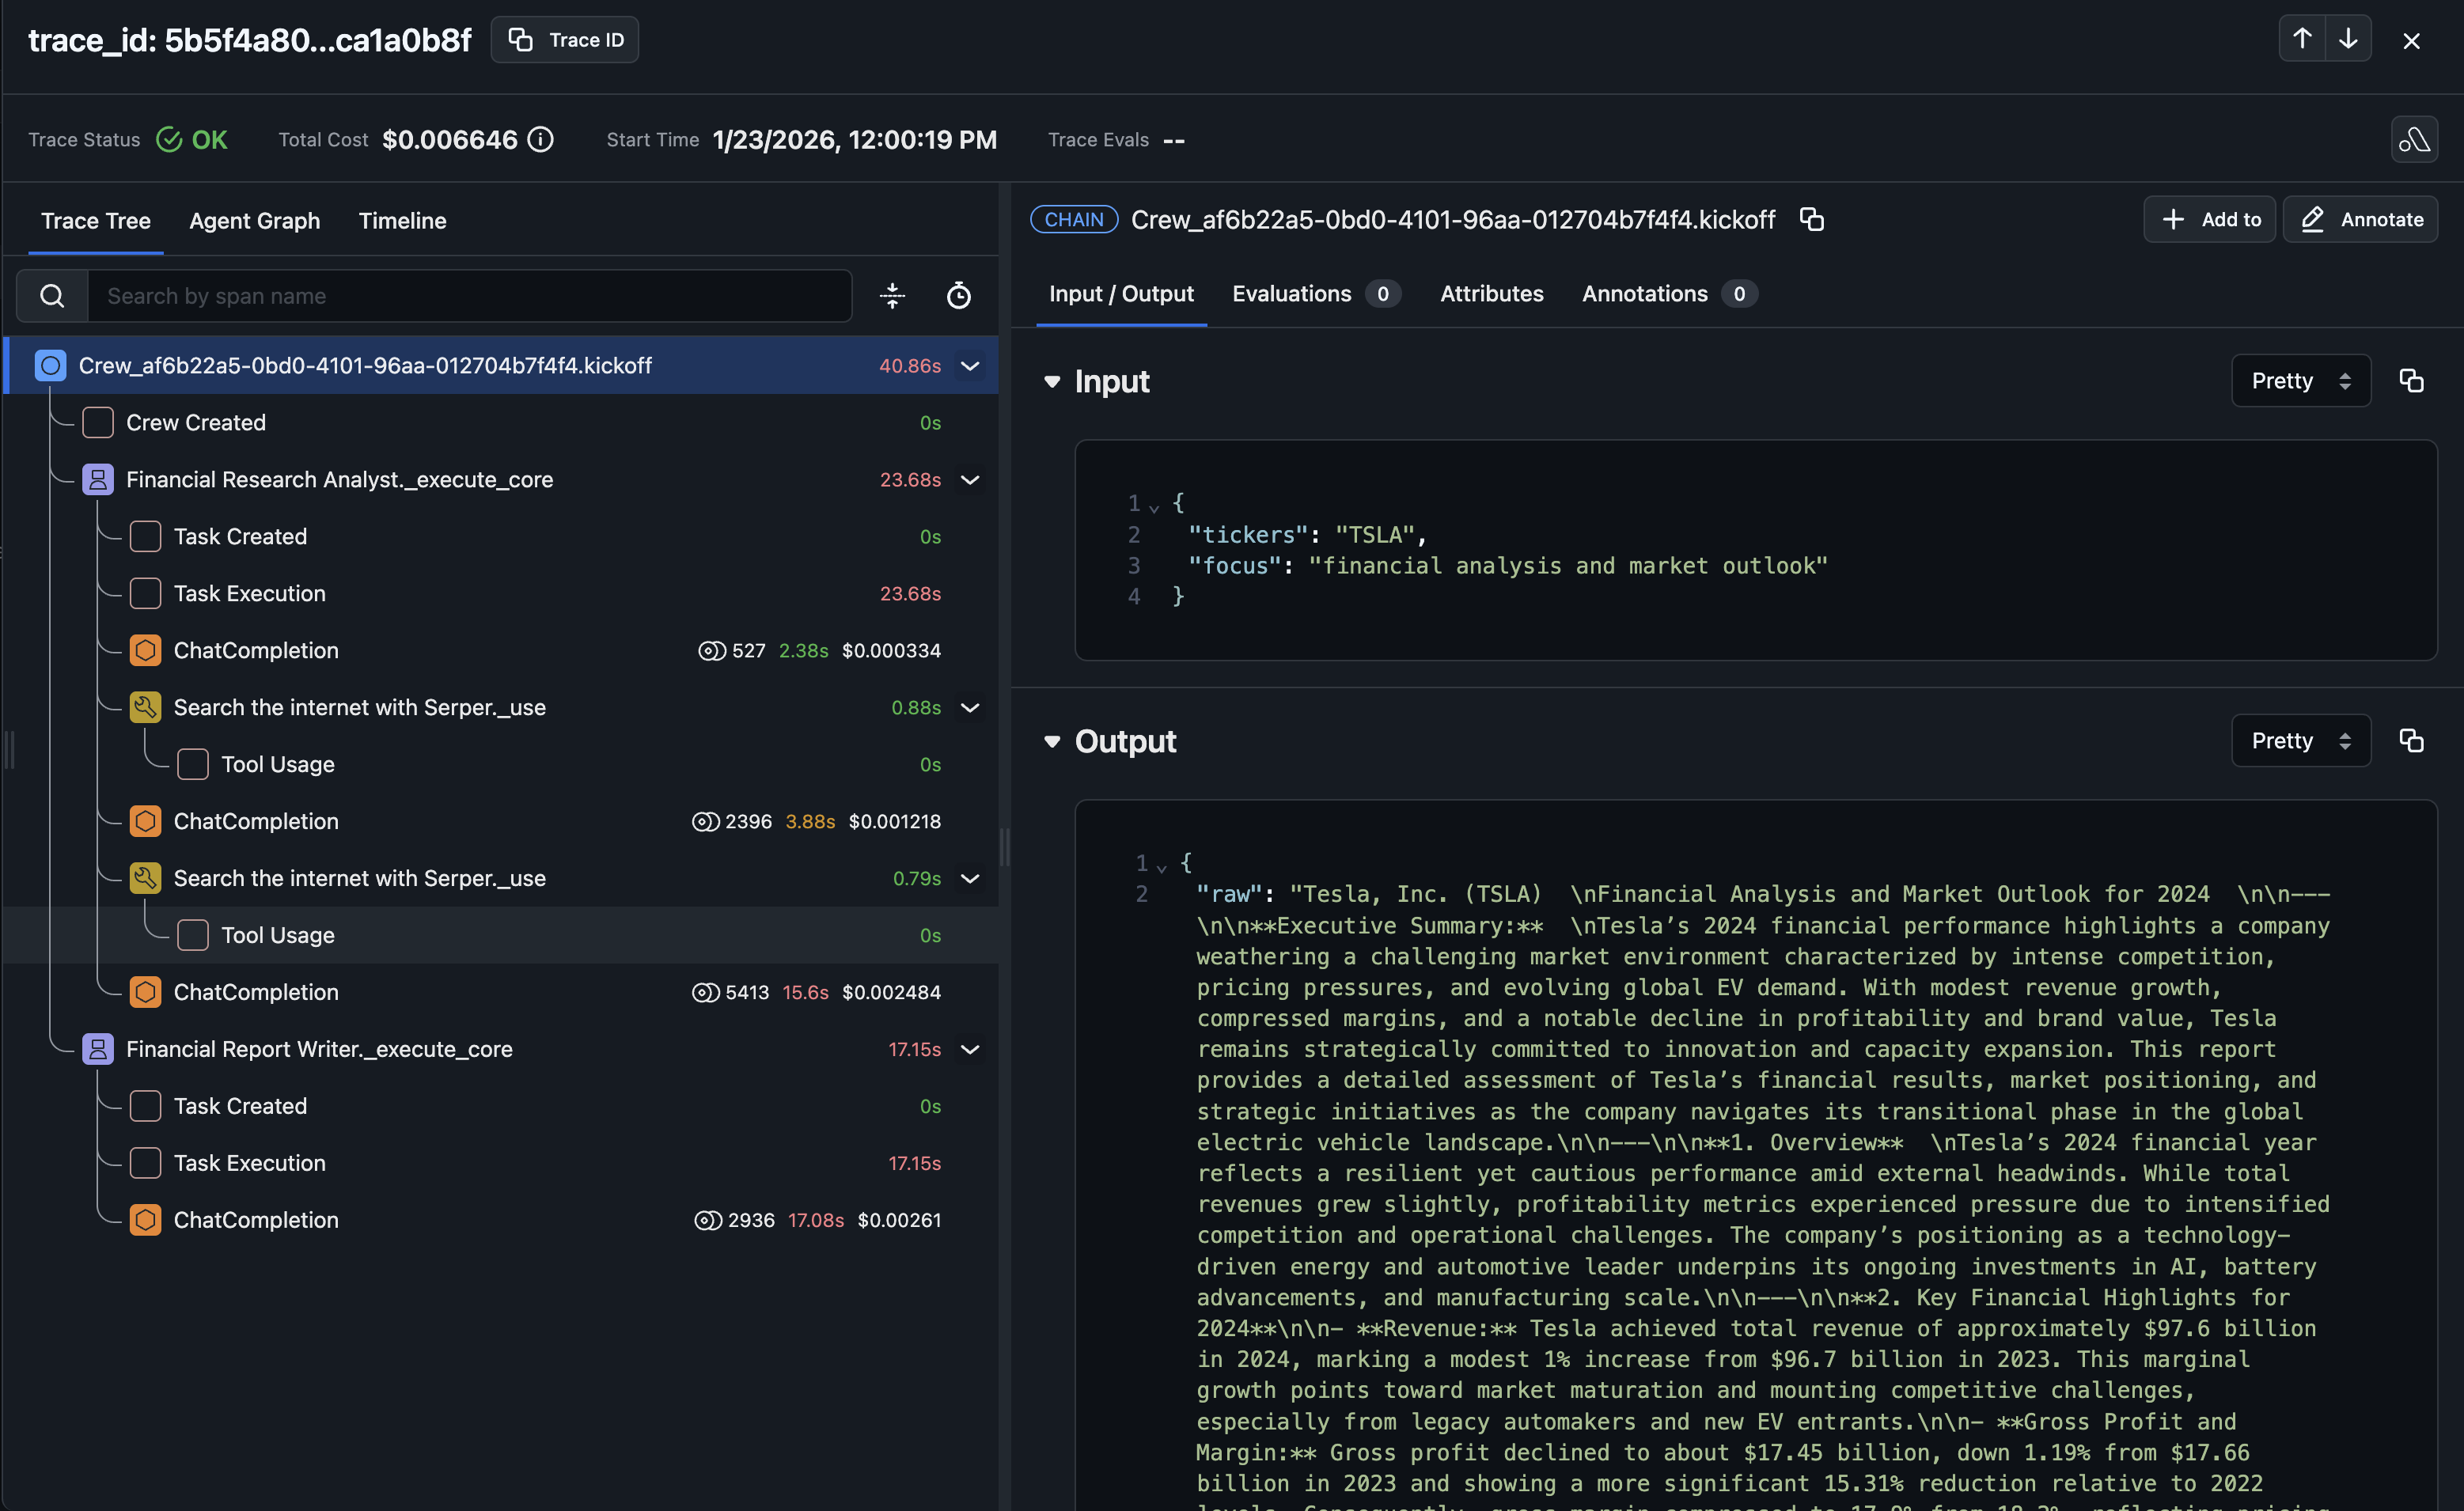
We’ll wire the agents and tasks together and run them.
crew = Crew(
    agents=[researcher, writer],
    tasks=[task1, task2],
    verbose=1,
    process=Process.sequential,
)
Your CrewAI agent is now ready with multiple agents, tasks, and a search tool configured.

Step 5: Look at the Trace in Arize

Ready to see tracing in action? Run the agent and watch as Arize AX captures the full execution flow. To run the agent, execute the following:
user_inputs = {"tickers": "TSLA", "focus": "financial analysis and market outlook"}

result = crew.kickoff(inputs=user_inputs)
Once the run completes, head back to Arize and navigate to the Tracing view. You should see a new trace corresponding to this run. Click into it to explore how the agents and tasks are executed. The entire agent execution is now visible as a single trace in Arize AX, showing the complete workflow from start to finish. More importantly, you can now see how your application actually ran:
  • Which tools were invoked and in what order
  • How tasks flowed from one step to the next
  • Where time was spent across the workflow
  • The full context of each LLM call, including prompts and responses
Trace view in Arize AX
Congratulations! You’ve sent your first trace to Arize AX.

Step 6: Export and Analyze Traces with the SDK

One of the powerful features of the Python SDK is the ability to programmatically work with your trace data. Instead of only viewing traces in the UI, you can export them, analyze them, and use them for evaluation and experimentation. Let’s export the traces we just created:
from arize import ArizeClient
from datetime import datetime, timedelta

client = ArizeClient(api_key=os.getenv("ARIZE_API_KEY"))

# Export spans from the last hour (adjust time range as needed)
end_time = datetime.now()
start_time = end_time - timedelta(hours=1)

df = client.spans.export_to_df(
    space_id=os.getenv("ARIZE_SPACE_ID"),
    project_name="arize-sdk-quickstart",
    start_time=start_time,
    end_time=end_time,
)
Now you have your trace data as a pandas DataFrame, ready for analysis, evaluation, or experimentation. This is the foundation for the next steps: running evaluations and experiments.

Learn More About Tracing

Ready to measure your application’s performance? Run evaluations on your traces to identify what’s working well and what needs improvement. The Evaluations Guide shows you how to score outputs.