Looking for how to read the agent graph and path views? See Agent Insights for a guide on what each visualization tells you and how to use them.
Implementing Agent Visualization for Arize
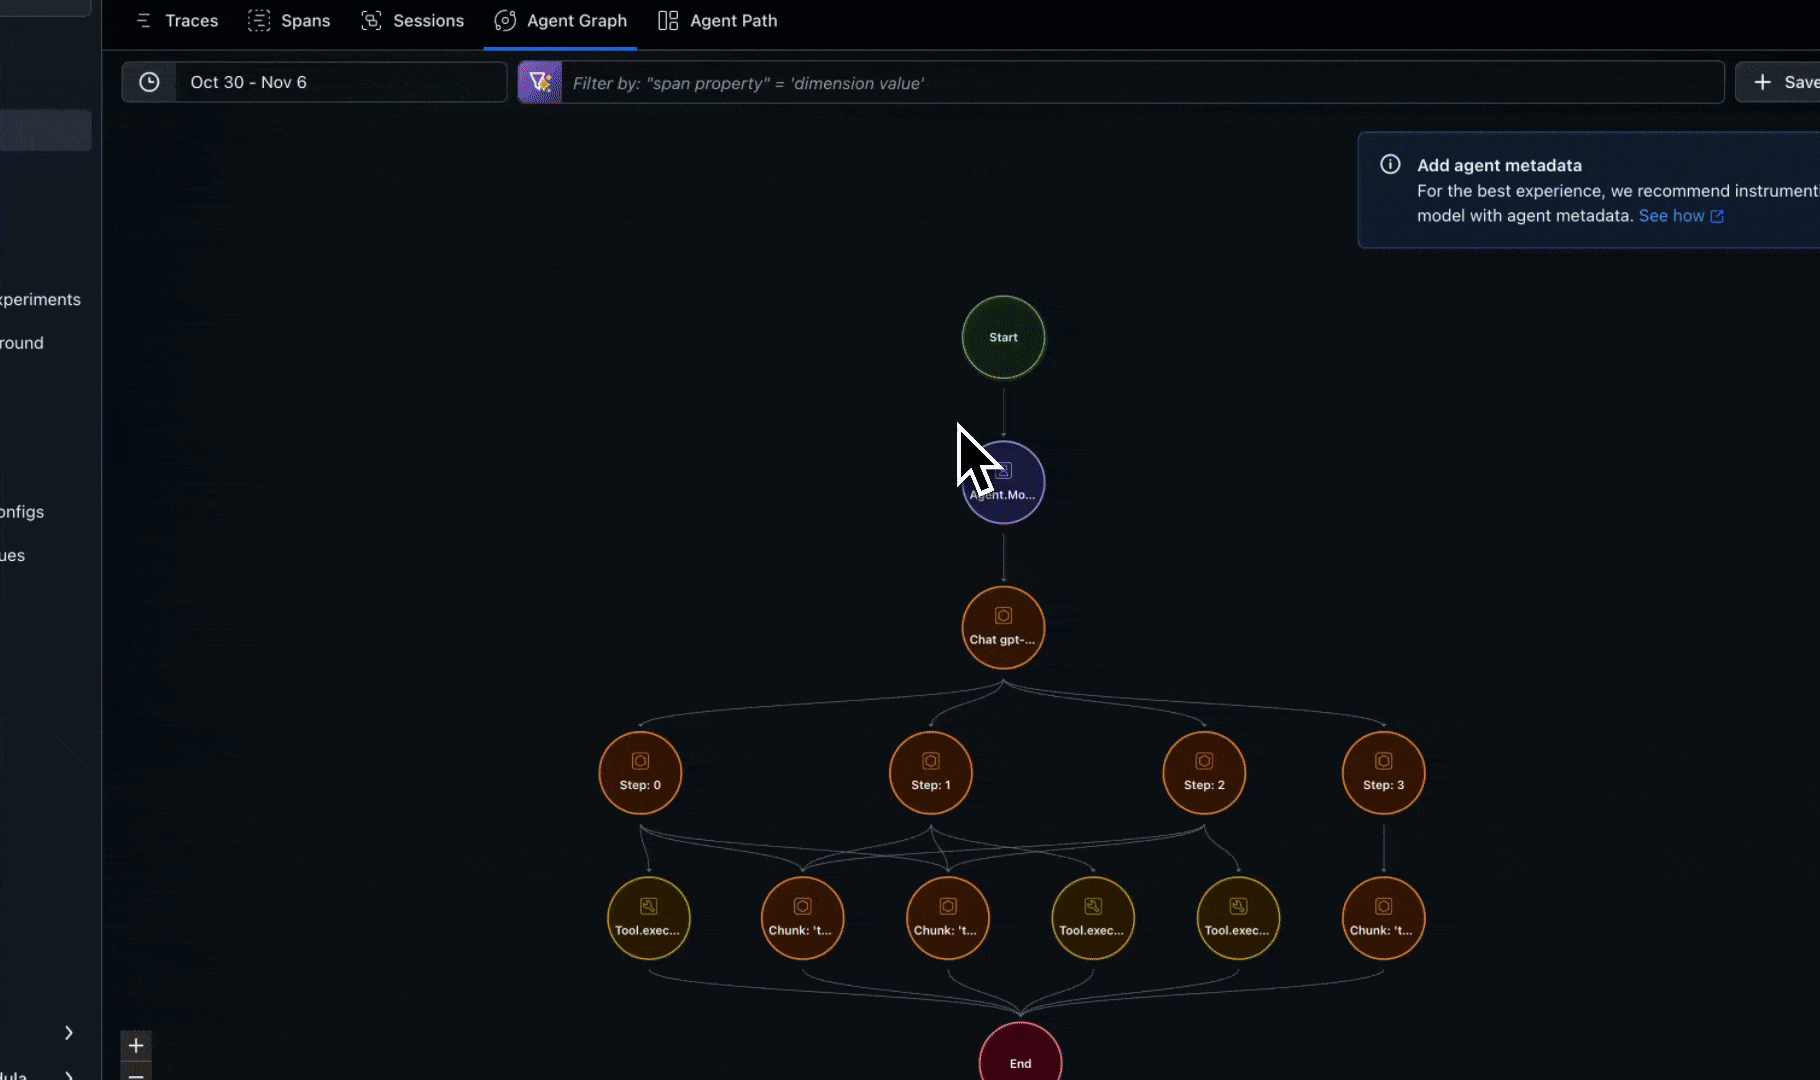
Agent and node visualization is designed to track high-level workflow components and their relationships, not every individual operation. Think of it as a “logical flow map” rather than a detailed trace view. This is powered by span metadata that identifies agents and defines the transitions between them. We automatically track these attributes for popular frameworks, so no additional implementation is needed. For other frameworks, custom agents, or hybrid systems, you can use custom implementation.- Frameworks Supported: LangGraph, AutoGen, CrewAI, OpenAI Agents, Agno
- Custom Implementation Guide
Frameworks with Built-In Support
The following frameworks have built-in support for agent metadata through their auto-instrumentors:LangGraph
LangGraph
- Automatically tracks agent nodes and graph transitions
- Uses native
metadata.langgraph_nodeandmetadata.langgraph_step - Handles agent metadata and state transitions
- No additional implementation needed
AutoGen
AutoGen
- Automatically tracks
graph.node.idandgraph.node.parent_id - Handles agent handoffs through
_handoffstracking - No additional implementation needed
CrewAI
CrewAI
- Automatically tracks agent roles and task relationships
- Includes agent metadata in spans
- No additional implementation needed
OpenAI Agents
OpenAI Agents
- Handles agent metadata via
OpenInferenceTracingProcessor - Tracks handoffs between agents
- No additional implementation needed
Agno
Agno
- Tracks agent names and team relationships
- Includes agent metadata in spans
- No additional implementation needed
Custom Implementation
When Custom Implementation Is Needed
Custom agent metadata tracking is required when:- Using frameworks without built-in support:
- Vanilla OpenAI / Anthropic calls
- Custom agent implementations
- LangChain without agent components
- Other unsupported frameworks
- Using hybrid instrumentation:
- Mixing auto-instrumented frameworks with custom code
- Building custom agents that interact with instrumented frameworks
Required Metadata Attributes
To enable agent and node visualization, include the following metadata:| Attribute | Description | Required |
|---|---|---|
graph.node.id | Unique name for the agent/node | ✅ |
graph.node.parent_id | ID of the parent node (if applicable) | Optional, but recommended. We will infer the graph using the relationship of the spans within the trace if this is not included |
Example Hierarchy
The example creates this structure: