


- Traces
- Spans
- Sessions
The Traces tab
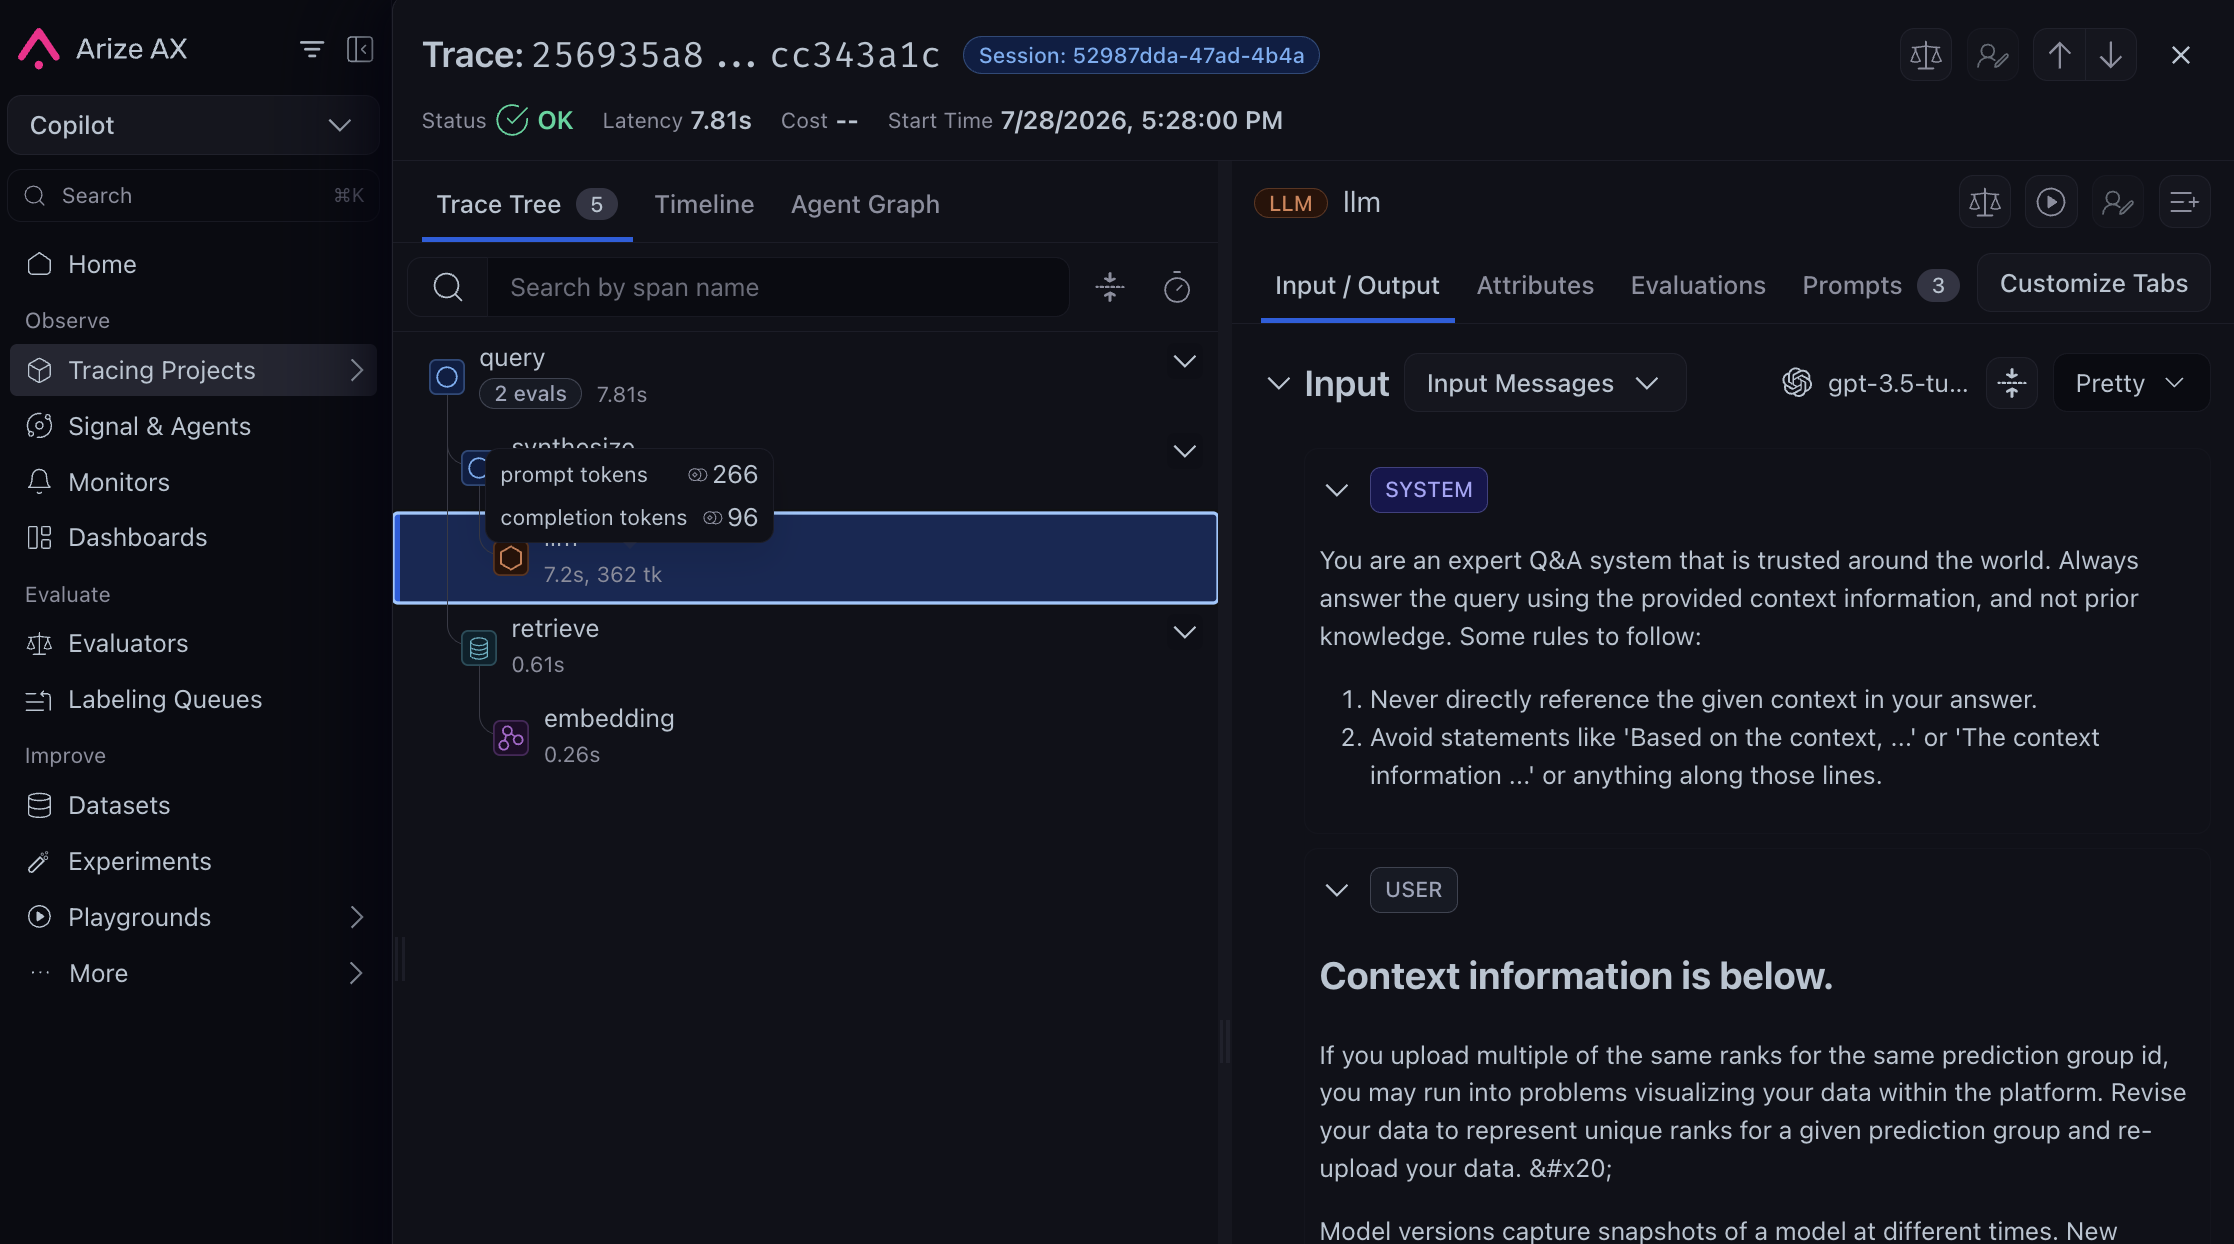
This is where most investigations start. The Traces tab shows every request your app has handled. Click any trace to expand its span tree and see exactly what happened: which components were called, what inputs and outputs flowed through, how long each step took, and where things went wrong.


Token counts
Token usage directly impacts cost. Arize AX automatically computes token counts for LLM spans using thellm.token_count.prompt, llm.token_count.completion, and model name attributes, and aggregates them up to the trace level.
In the span tree, each span shows its total token count. Hover over the number to see a breakdown of prompt tokens and completion tokens, along with how they were computed (user-provided, tiktoken, or character estimate).
Querying and filters
Once you know what you’re looking for, use filters to narrow down. Click the filter bar to start querying — you can type, select from suggestions, or use AI Search to generate filters from natural language.
Query Syntax
Query Syntax
- Format:
"dimension name" = 'value' - Operators:
=,!=,<,>,IN,contains - Null checks:
"attributes.input.value" = nulloris null - Combine with
AND/OR - Example:
"attributes.openinference.span.kind" = 'LLM' AND "status_code" = 'ERROR'
- Multi-span filters
- Time filters
Multi-span filters
Need to find traces based on complex patterns — like traces where an LLM call follows a retrieval, or traces with errors but no tool calls? Create multiple span queries and define relationships between them.
- Define your first Span Query
- Click Add Span Query (up to 5)
- Use Find Traces Matching to combine them with operators:
AND,OR,NOT,->(temporal),=>(parent-child)
Multi-Span Operator Details
Multi-Span Operator Details
- AND — traces with spans matching both A and B
- OR — traces with spans matching A or B
- NOT — traces without spans matching the query
- -> (Indirectly Calls) — A starts before B
- => (Directly Calls) — A is the direct parent of B
- Combine with parentheses:
(A AND B) OR C,A AND NOT(B -> C)

Saved Views
Found a useful filter + column setup? Save it so you don’t have to rebuild it every time. Saved Views preserve your exact Tracing table configuration — filters, columns, sort order, and time range — so you and your team always come back to the same starting point.
status_code = 'ERROR'). You can’t overwrite them, but you can fork them with Save as new view.
To create a view: set up the table how you want it (filters, columns, sort, time range). A Save button (disk icon) appears in the toolbar when you have unsaved changes. Click it and choose Save as new view. Views are shared per project. Each user can set their own personal default via the view’s actions menu.
Columns
Not every column is relevant to every investigation. Customize which columns are visible using the Columns button in the table toolbar. Columns are organized into groups:
- Span columns — TraceID, SpanID, Input, Output, Start/End Timestamp, Total Tokens, Status
- Span Evaluations — scores and labels from your span-level evals
- Session Evaluations — scores and labels from your session-level evals
- Annotations — human labels and scores from your team
Source mapping
Every framework stores user input and model output in different span attributes. Source mapping tells Arize AX which fields to treat as Input and Output for a project, so the Tracing table, filters, exports, and evaluators all read from the same place. Open your project → Config → Source Mapping. For each field, enter a dot-notation path into the span’s attribute tree, or leave it blank to use Arize’s defaults.
Paths are relative to OpenInference attributes; omit the
attributes. prefix. Use . between segments; use numeric indices for arrays (0, -1 for last element).
What changes after you save
- New spans get human-readable Input and Output columns derived from your paths
- You can filter with
input/outputinstead of long attribute names (input contains 'refund') - Evaluator tasks can map
{input}and{output}directly
Export traces
Need the data outside Arize? Export trace data for evaluations, fine-tuning, or further analysis.
- Export to Notebook — generates a prefilled Python snippet using the Arize SDK to export your data to a DataFrame. Copy it into a Jupyter notebook to start analyzing.
- Export as CSV — downloads the top 10,000 rows currently displayed. Customize columns before exporting.
- Configure Export via Agent (Skills) — opens the Arize Skills setup for exporting via your coding agent.
- Configure Export via Code — shows CLI, Python SDK, and REST API snippets for programmatic export.
Fetch a trace by trace ID
A trace is the set of all spans that share the samecontext.trace_id. To fetch a single trace programmatically, query spans with a trace ID filter using the CLI, the Python SDK, or the REST API.
context.trace_id. All spans in the response share that trace ID.
Analyze traces for error modes
You can explore individual traces and see what happened in a single request. But any non-trivial LLM app (agent, RAG, or chatbot) can fail in many different ways on the same input. When something goes wrong, the problem could be anywhere in the chain. A single failing trace is a data point. It can surface a pattern you actually want to fix. Three approaches get you from failures to labeled error modes: Arize Skills in your coding agent, Alyx in the product, or manual annotation. Skills and Alyx use AI to produce categories directly; the manual approach walks through annotation and clustering step by step.
- Arize Skills
- Alyx
- Manually
Run the Set up authenticationAsk your agentOther prompts to try: “find me traces that have long latency, and summarize what they have in common”, “why are these traces failing”, “group last night’s errors by root cause”. The skill runs 
arize-trace skill in your AI coding agent (Claude Code, Cursor, Codex, Windsurf, and 40+ others) to export traces and analyze them locally.Install skillax traces export under the hood; your agent reads the output and reports patterns.What you get back: a written summary of common patterns across the exported traces. Fast to run. Best for quickly spotting what is going wrong before you commit to deeper analysis. Works with Cursor, Claude Code, Codex, and more.
Skills and Alyx are the fastest way to do a first pass across large volumes of traces. Manual annotation takes longer but typically produces sharper, more reliable categories. Use it on the error modes that matter most.
Fix the error mode
If you used Skills or Alyx, pick the most impactful pattern from the output and give it a name (e.g.,invalid_hotel_id). Then validate a fix before shipping:
- Save failing traces to a dataset: those traces become your regression suite for future prompt tweaks, retrieval updates, tool changes, or any other fix.
- Run an experiment: compare the old vs new version against the dataset; ship the fix only if the experiment shows improvement without regressions on other examples.