

Trace Codex CLI agent turns and tool calls in Phoenix for full observability.Trace your Codex CLI sessions in Phoenix with the coding-harness-tracing toolkit — every turn shows up as a trace with the model call, each tool it runs, and token usage, grouped into its session. No application code changes required: the toolkit hooks into Codex’s
notify events and streams OpenInference spans to Phoenix.
Launch Phoenix
The fastest way to get started with Phoenix is by signing up for a free Phoenix Cloud account. If you prefer, you can also run Phoenix in a notebook, self-host it, or use it directly from your terminal. Go to the settings page in your Phoenix instance to find your endpoint and API key. A self-hosted Phoenix defaults tohttp://localhost:6006; the API key is only required when auth is enabled.
Install
The curl installer is the simplest — it runs a short wizard that saves your Phoenix credentials for you. Use a local clone if you’d rather run the installer from a checkout of the source.Curl installer (recommended)
macOS / Linux:Local clone
Configuration
Credentials live in~/.arize/harness/config.json. To override per category, set environment variables in ~/.codex/arize-env.sh — the notify hook sources this file automatically. Env values take precedence over config.json.
PHOENIX_PROJECT (or PHOENIX_PROJECT_NAME); ARIZE_PROJECT_NAME is Arize-only and ignored here. ARIZE_TRACE_ENABLED is a backend-agnostic harness setting and keeps the ARIZE_ prefix regardless of destination.
Redaction controls
EachARIZE_LOG_* flag accepts "true" or "false" and defaults to "true". Set to "false" to opt out per category:
Observe
Once tracing is enabled, Codex activity is streamed to Phoenix. You’ll see:- Turn traces — each agent turn (user prompt to assistant response) as a parent LLM span
- Tool call spans — one per tool decision and result pair
- Session grouping — all turns from the same session grouped by
session.id - Model and token usage — model name plus prompt, completion, and total token counts on every turn span
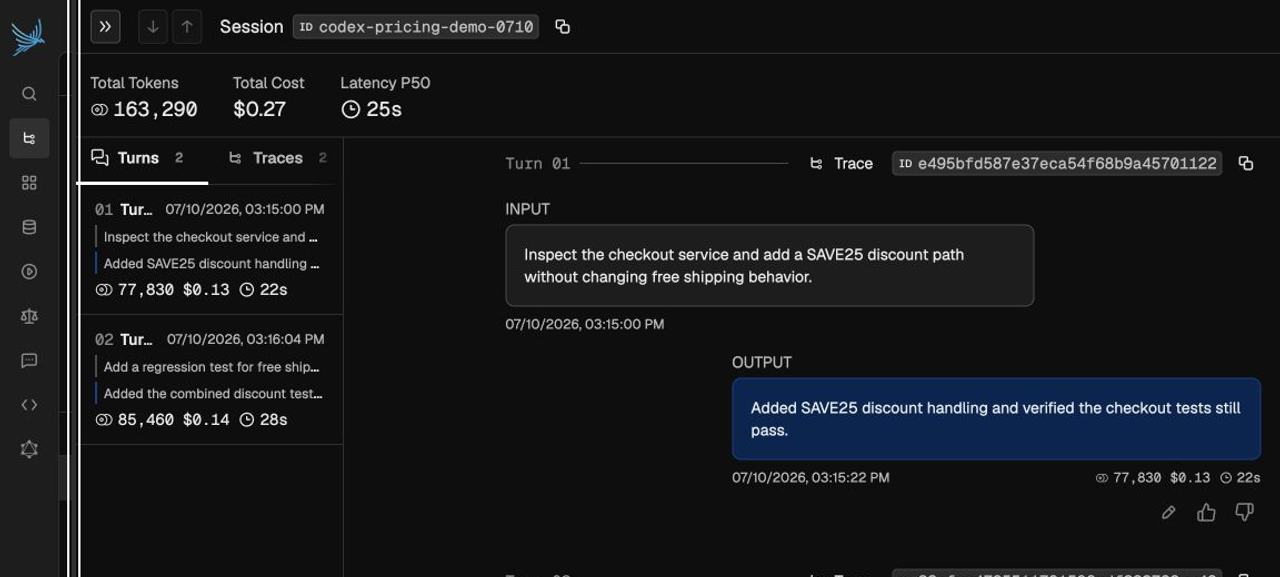
Codex turns grouped together in a single session view
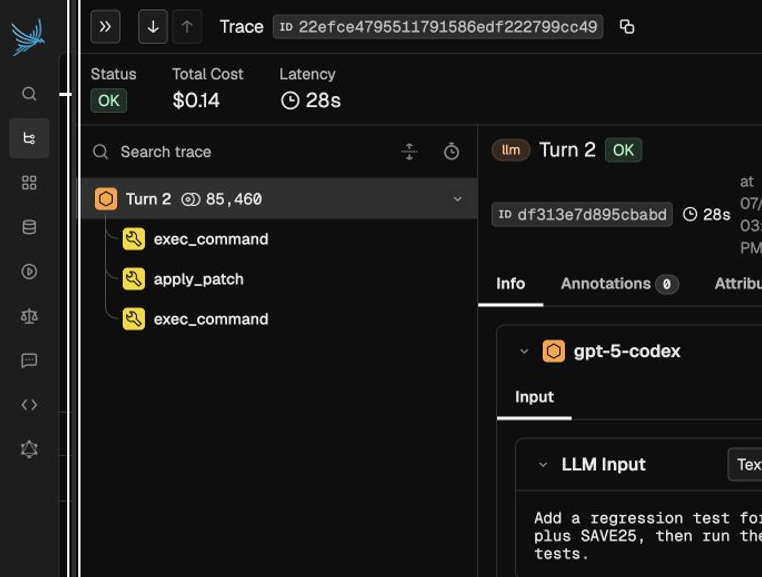
Detailed trace view for a Codex turn