

Co-Authored by Chris Cooning, Head of Product Marketing & Sally-Ann DeLucia, Director, Product & Priyan Jindal, AI Engineer & Jack Zhou, Staff Software Engineer.
For the past two and a half years, we’ve been building Alyx with a singular goal: create the Cursor experience for AI engineers. Alyx is an agent that helps teams make their agents better. Being AI engineers building Alyx ourselves gives us a unique advantage—we’re building the tools we actually want and need, not just features that demo well.
Every day, we use Alyx to build Alyx. Alyx helps us analyze, debug, evaluate, and iterate on Alyx at a much faster rate.
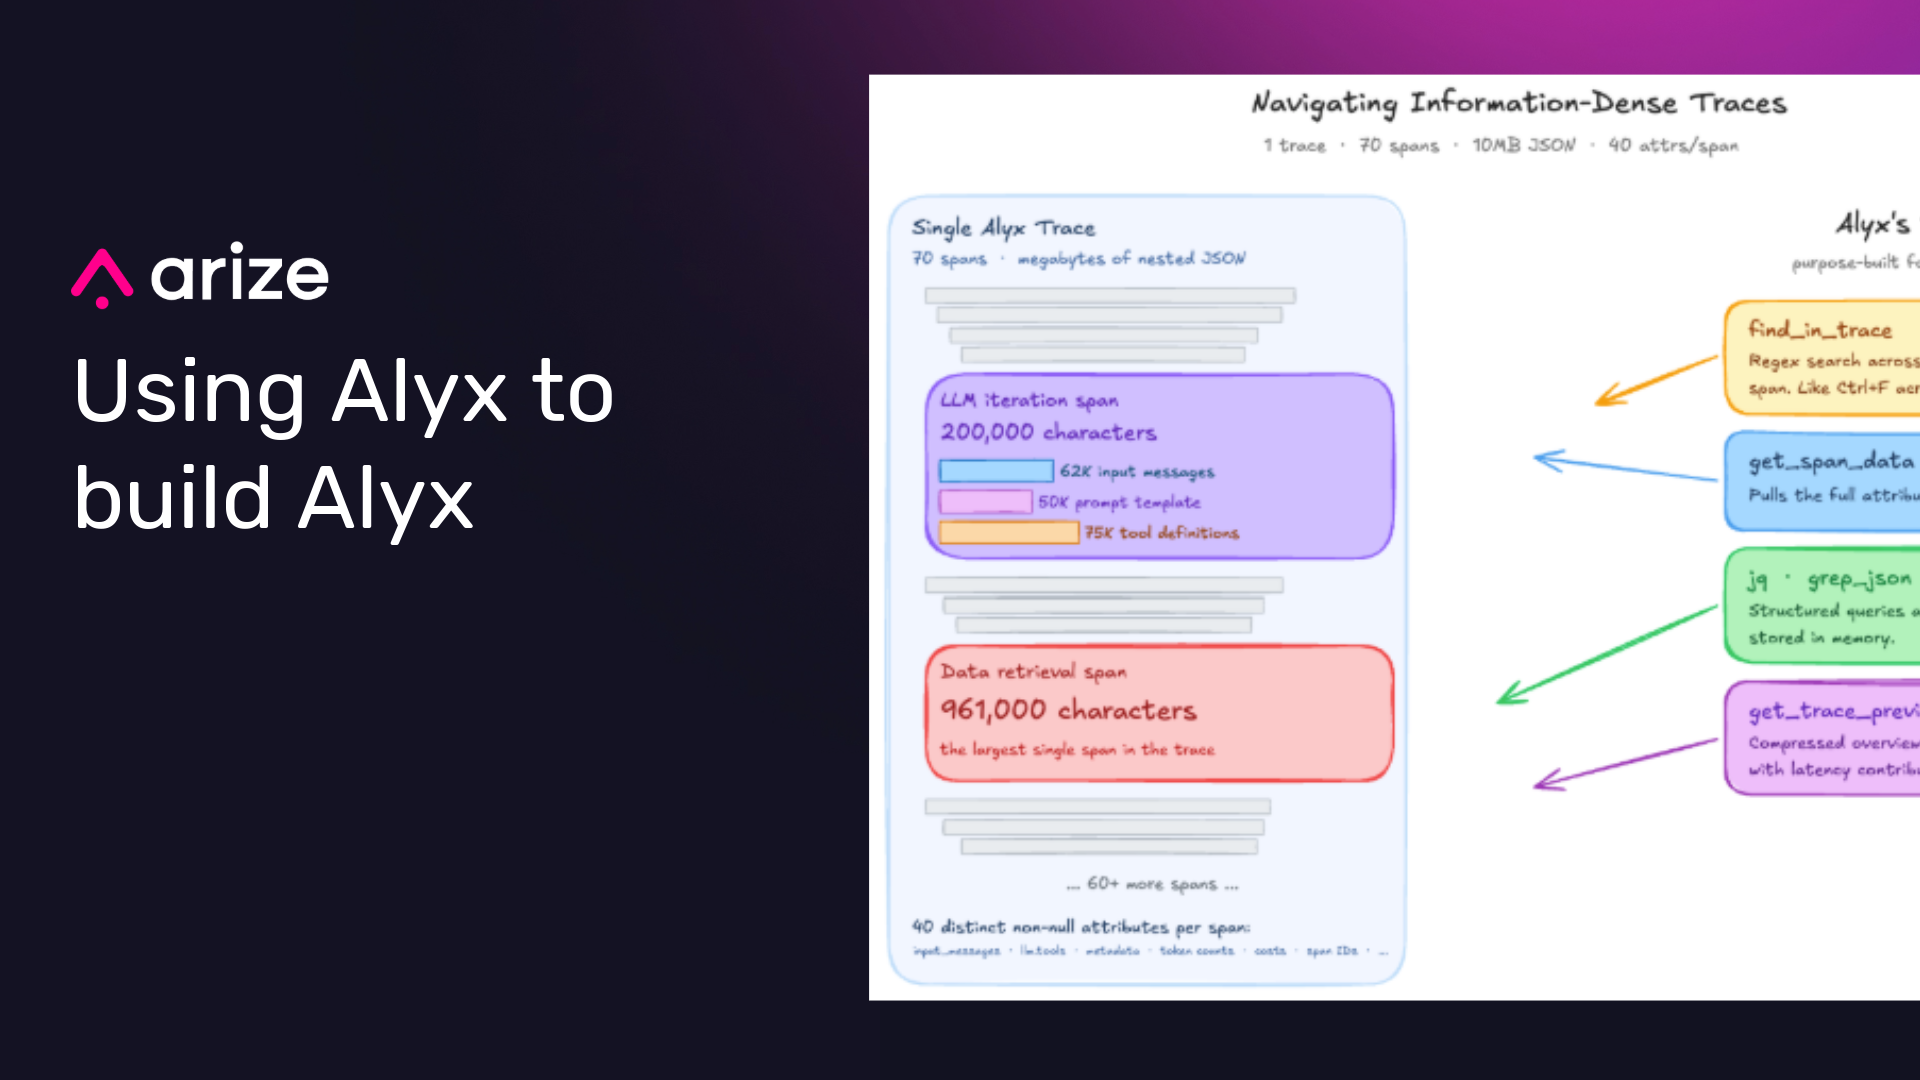
More of a visual learner? We have you covered. 👇
Why manual trace debugging breaks down
When you’re developing an AI agent, your workflow typically looks something like this: you have your agent UI on one screen and your traces on another. When something goes wrong, you dive into the trace to understand what happened.
The problem with debugging traces manually comes from the same thing that makes traces so powerful: how information dense they are. While the traces we showed in our demo might look intricate, they’re actually on the simpler side. Some of our customers have traces with hundreds of spans, with hundreds of JSON entries per span. Expecting anyone to manually comb through that data to diagnose an issue is unrealistic.
That’s exactly why we built the lyx Trace Debugger.
Workflow 1: Search across dense traces
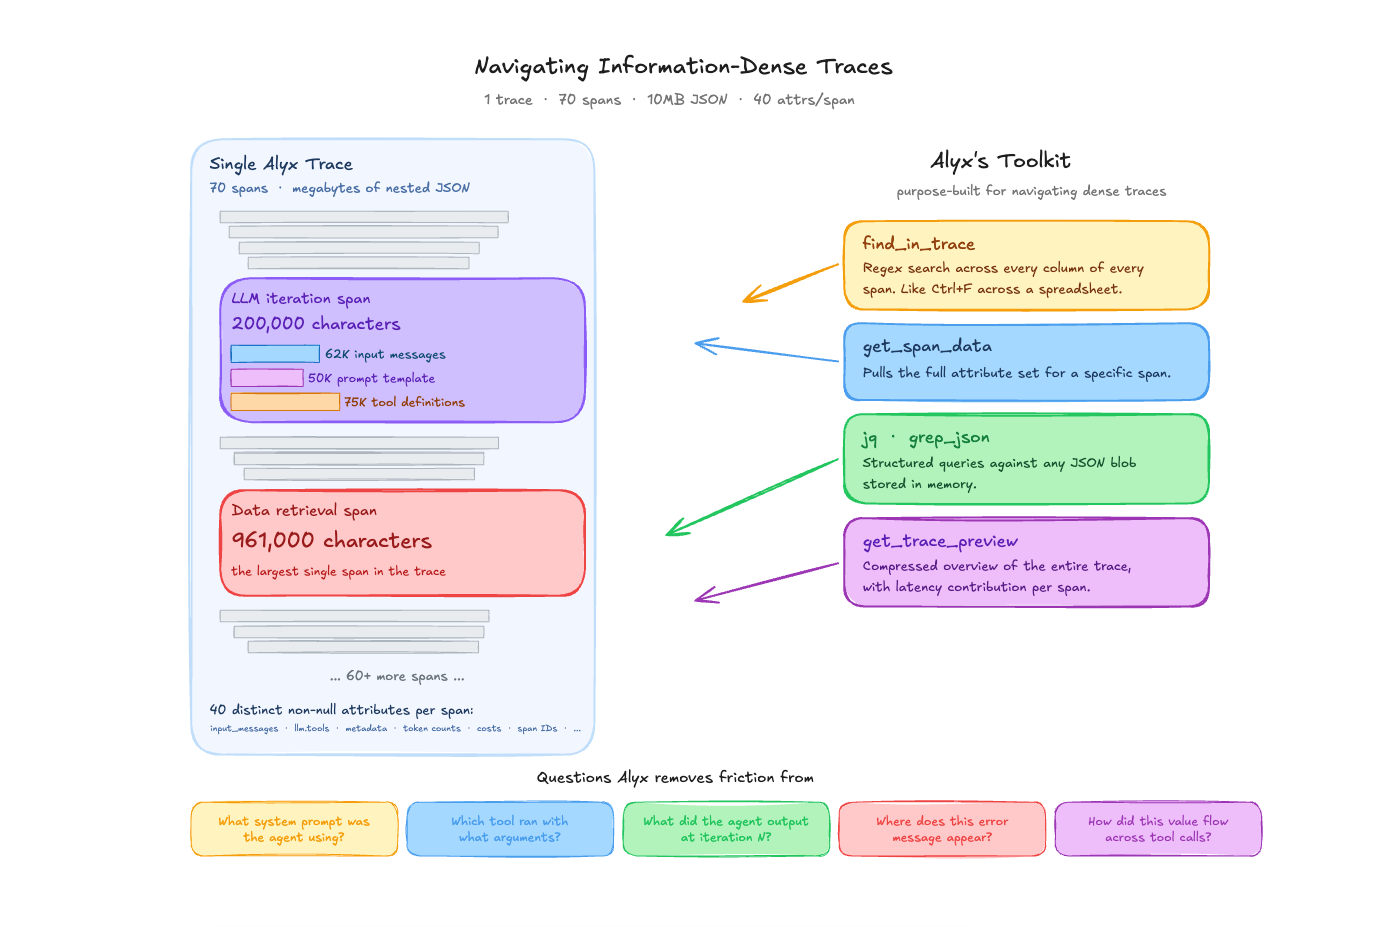
A single trace from one of our Alyx sessions contains 70 spans and weighs in at over 10MB of JSON. One LLM span alone — a single orchestrator iteration — is 200,000 characters: 62,000 characters of input messages, 50,000 characters of prompt template, and 75,000 characters of tool definitions. The largest span in that trace, a data retrieval call, is 961,000 characters by itself. Across all 70 spans, there are 40 distinct non-null attributes per span — things like attributes.llm.input_messages, attributes.llm.tools, attributes.metadata, eval.arnav-tool-calling-task-.explanation, token counts, cost breakdowns, graph node IDs, session IDs, and more.
This is what “information dense” actually means in practice. It is not an abstract complaint. A developer staring at this trace in a UI is looking at megabytes of nested JSON. Even with a good tree view, finding the thing you care about requires knowing where to look.
The Alyx traces agent has tools designed specifically for this: find_in_trace performs a regex search across every column of every span in a trace and returns matching cells with their span IDs and column names — like Ctrl+F across a spreadsheet. get_span_data pulls the full attribute set for a specific span. jq and grep_json run structured queries against any JSON blob stored in memory. And get_trace_preview gives a compressed overview of the entire trace with latency contributions calculated for each span.
The kinds of questions this handles:
- “What system prompt was this agent using?” In a trace with 22 LLM iterations, the system prompt is embedded inside the
attributes.llm.input_messagesof each LLM span. That prompt is 50,000 characters long. Alyx can use find_in_trace with a search term — say, the name of a specific instruction or a known phrase — and pinpoint the exact span and offset where it appears. Without this, you are manually expanding each LLM span and scrolling through the messages array. - “Which tool was called with what arguments?” In the 70-span trace, there are 47 tool spans. Alyx ran
jqqueries like[.spans[] | select(.["attributes.openinference.span.kind"] == "TOOL") | .name] | uniqueto extract the distinct tool names (home_page_agent,documentation_search,link_to_page,finish) across multiple traces. Getting this by hand means opening each tool span individually. - “What did the agent output at iteration N?” When debugging multi-turn agent behavior, you often need to see what the agent said or did at a specific step. Alyx can query specific iteration spans to extract text content, tool calls, and their arguments — all without navigating a deep span tree manually.
- “Where does this specific error message appear?”
find_in_tracesearches all columns, includingevent.attributes(which contains exception tracebacks),attributes.output.value, andattributes.error.message. If you know a fragment of an error string, Alyx will return every span and column where it shows up. - “How did a value propagate across tool calls?” In agent traces, the output of one tool often becomes the input to the next. Tracing how a specific value — a span ID, a filter string, a dataset name — moves through the execution graph normally requires cross-referencing multiple spans. Alyx can search for that value across all spans and show you the chain.
The point is not that these questions are impossible to answer manually. They are not. The point is that when a single span is 200K characters and there are 70 of them, the time cost of manually navigating that data is high enough that you often just don’t bother asking the question. Alyx removes that friction.
(Side note: we used Alyx itself to find the specific traces referenced in this blog post. We asked it to search for interesting traces with high span counts and diverse tool usage, and it returned the ones we used as examples here. That is the kind of retrieval task where the time savings compound.)
Workflow 2: Trace aggregation and multi-level analysis
Single-trace inspection is useful when you know which trace has the problem. But most of the time, you have a time range, a vague sense that something is off, and a need to figure out where to look.
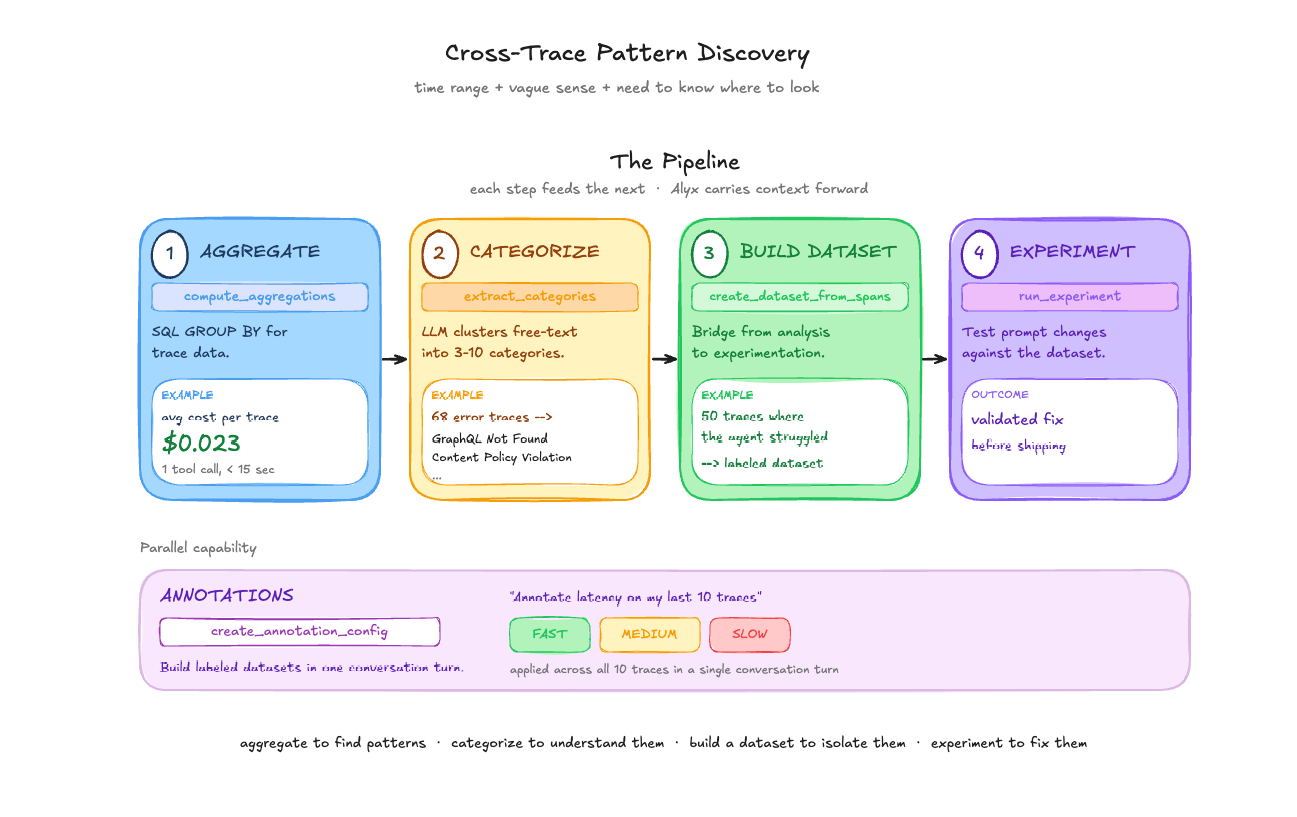
Aggregation and grouping. Alyx’s compute_aggregations tool works like a SQL GROUP BY over trace data. In one session, we asked: “what is the average cost of my traces in the last month?” Result: $0.023 per trace. One tool call, under 15 seconds. The real value shows up with grouping — “average latency by model name,” “error count by span kind,” “token usage by agent type.” In the home page agent analysis, Alyx ran three consecutive aggregations: root spans by status_code (38 OK, 1 UNSET), child tool spans by name and status_code (all 988 child spans UNSET), then error spans by name. The pattern discovery that took 5 minutes of automated analysis would have taken much longer scrolling through a table.
Semantic categorization. Not all fields are low-cardinality strings you can GROUP BY. Error messages and user inputs are free text. extract_categories samples text from a column and uses an LLM to identify 3-10 mutually exclusive categories. assign_categories then classifies every span into those categories via batched LLM calls. This is what powers error triage: 68 error traces with verbose exception strings get clustered into actionable categories like “GraphQL Object Not Found” and “Content Policy Violation” with counts for each.
Building datasets from traces. Once you’ve identified an interesting subset of traces, create_dataset_from_spans moves them into a dataset — the bridge between trace analysis and experimentation. You find 50 traces where the agent handled a query type poorly, create a dataset from them, then test prompt changes with run_experiment.
Annotations. We asked Alyx to “create an annotation config for speed/latency and annotate my last 10 traces.” It created a categorical config with Fast/Medium/Slow labels, examined the latency values, and applied annotations to each trace — all in a single conversation turn. Useful for building labeled datasets for evaluation or flagging traces that need human review.
The pipeline. These tools compose: aggregate to find patterns, categorize to understand them, build a dataset to isolate them, experiment to fix them. Each step feeds naturally into the next, and Alyx holds the context of what it found at each step to carry forward.
Workflow 3: Triage dogfooding failures from trace IDs
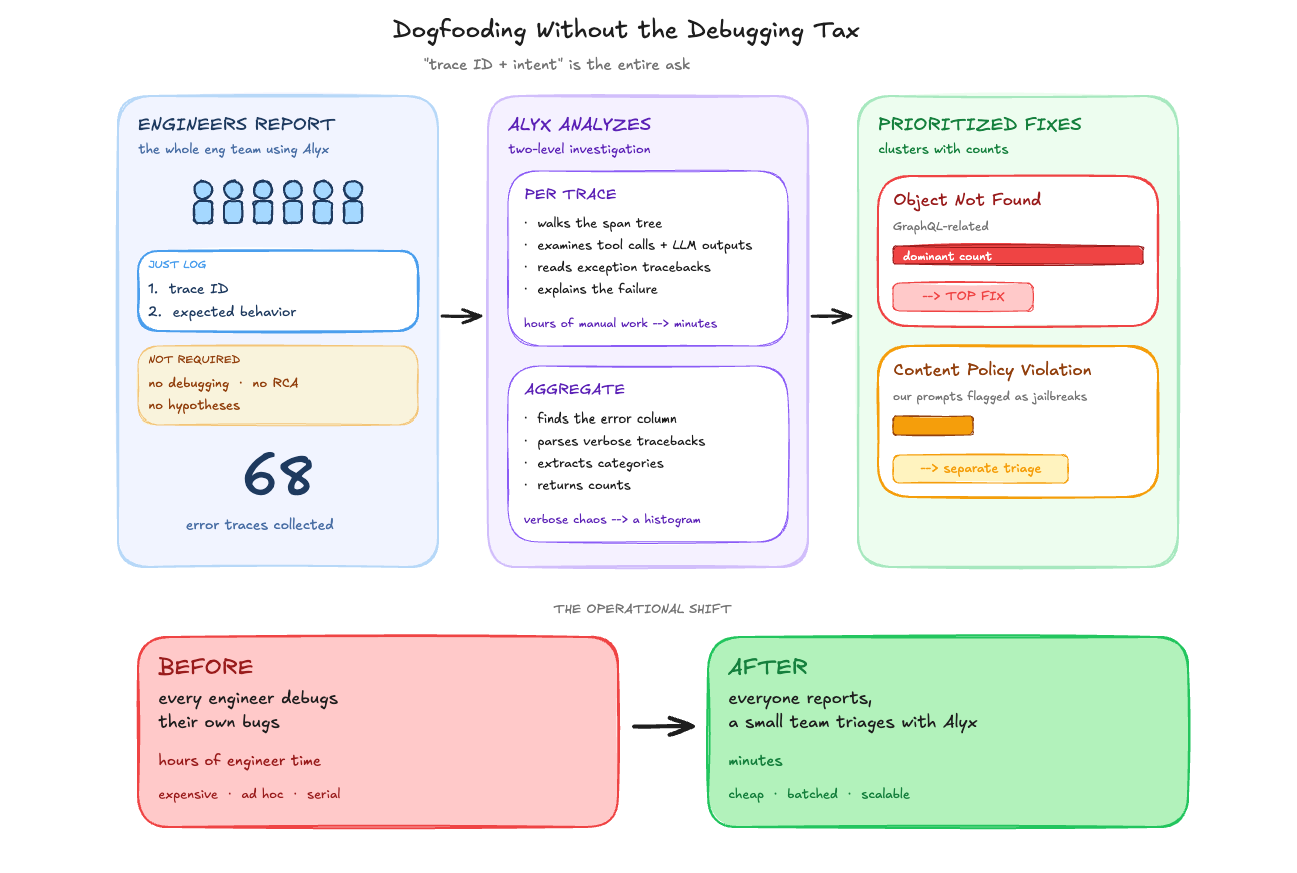
We recently ran a dogfooding session with almost our entire engineering team using Alyx. The setup was simple: use the product, and when something breaks, log the trace ID and what you were trying to do. That was it — no debugging, no root cause analysis, no “here’s what I think went wrong.” Just the trace ID and a description of the expected behavior.
This was deliberate. Debugging is expensive engineer time. Logging a trace ID is not. We could have asked every engineer to dig into their own failures, but that would have meant pulling people away from their actual work to do ad hoc trace analysis. Instead, we collected the trace IDs and handed the debugging to Alyx.
What we were looking at afterward: 68 traces with errors from production Alyx. For each one, we could ask Alyx directly — “what went wrong in this trace?” — and it would walk through the spans, examine the tool calls and LLM outputs, read the exception tracebacks, and explain the failure. For a single trace, that is already faster than doing it by hand. Across 68 traces, the difference is hours versus minutes.
At the aggregate level, we asked Alyx to categorize the errors. It identified which column contained the error data (event.attributes), used semantic parsing to read the verbose exception tracebacks (these are not clean strings you can GROUP BY), extracted meaningful categories, and returned counts. “Object Not Found” errors (GraphQL-related) dominated and became the immediate fix target. Content policy violations — where our LLM provider was flagging some of our own prompts as potential jailbreak attempts — surfaced as a separate category.
The key insight is operational: you don’t need every engineer who hits a bug to also be the one who diagnoses it. You need them to capture the trace ID. The investigation can happen later, by fewer people, with Alyx doing the trace-level analysis. That changes the economics of dogfooding from “everyone debugs their own issues” to “everyone reports, a small team triages.”
What this changes about agent development
This workflow—trace analysis to root cause identification to fix—still involves some manual handoffs. You go to the UI, find the ent’s traces, debug their execution, iterate and optimize your prompts, run multiple evals – while coding agents like Cursor and Claude Code have a unique set of data (code) and tools to look at your code – we’re working towards a future where both agents can talk to each other.
Key takeaways
- Traces are too dense for manual inspection at scale. A single span can be 200K characters of JSON. When you have 70 of those in a trace, and hundreds of traces in a time range, you need tools that can search, query, and aggregate across that data programmatically.
- Aggregate first, then drill down. The most efficient debugging workflow is not opening traces one by one. It is computing aggregations across your traces to find patterns, categorizing errors semantically, and only then drilling into specific spans. Alyx’s tool chain is built around this sequence.
- Separate reporting from debugging. In our dogfooding sessions, we learned that the highest-leverage setup is having many people report failures (just a trace ID and what they expected) and a small team triage them with Alyx. You do not need every engineer who hits a bug to also diagnose it.
- Dogfood with your own tools. We use Alyx to analyze Alyx’s traces, debug Alyx’s prompts, and categorize Alyx’s errors. This is not a philosophical stance — it is how we find the gaps. If our trace debugger cannot diagnose our own agent’s failures, it is not ready for anyone else’s.
Want to see how Arize helps teams build evals for AI agents?
This is the final part four of a four-part deep dive series on how we built Alyx.
The previous posts are here if you missed them: