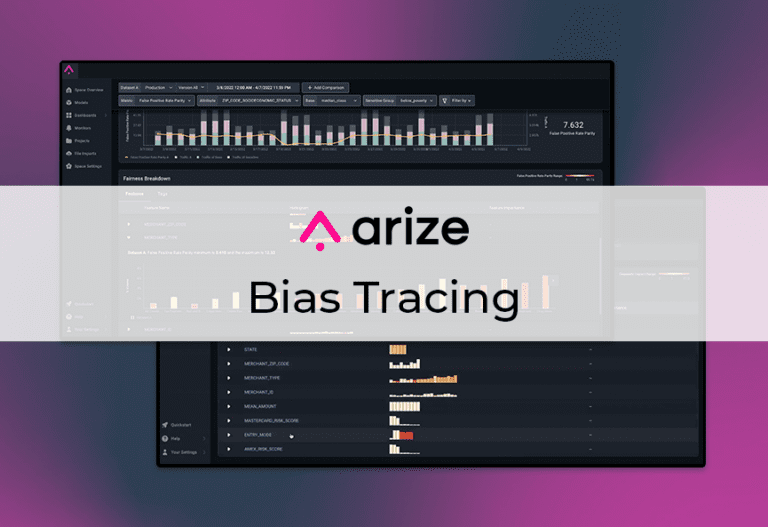
Commonly used as a model fairness metric, false positive parity measures whether a model incorrectly predicts something as more likely for a sensitive group than for the base group. In other words, among rows that are truly negative, does the model falsely alarm at the same rate for each cohort? Unequal false positive rates mean one group bears more unnecessary friction, denials, or manual reviews.
Build better agents with Arize
Trace, evaluate, and learn. Build agents that work with Arize AX and start tracing your runs today.
Prefer open source? Try Arize Phoenix for self-hosted, open source agent observability.

Key takeaways
- False positive parity compares false positive rates (FPR) across groups at a fixed threshold.
- High FPR disparity hurts groups with more false alarms even when overall accuracy looks fine.
- Threshold tuning can trade parity against precision; document business costs explicitly.
- Combine FPR parity with recall parity and disparate impact for fuller fairness review.
- Small sample cohorts produce noisy FPR estimates; use confidence intervals.
Definition and formula
For binary classification at threshold t:
False positive rate for group g = FP_g / (FP_g + TN_g)
False positive parity holds when FPR_g is equal (or within policy tolerance) across groups g.
This differs from recall parity, which compares true positive rates among actual positives, and from disparate impact, which compares overall positive prediction rates.
Why FPR parity matters
In criminal risk, loan, or content moderation systems, false positives often impose immediate harm: blocked accounts, declined applications, removed posts. If one demographic sees more false alarms at the same threshold, user trust erodes even when aggregate accuracy is balanced.
Product teams sometimes accept lower global precision to equalize FPR across groups; legal and policy teams must sign off.
Measurement practice
Fix the model version and decision threshold before comparing cohorts.
Define groups using policy-approved attributes; avoid ad hoc slicing that violates privacy rules.
Report counts of FP, TN per group, not only rates, so stakeholders see sample size.
Track FPR over time; drift in inputs can change parity without redeploying weights.
Mitigation options
Adjust thresholds per group (controversial and regulated in some domains).
Improve labels and features to reduce systematic errors on affected cohorts.
Use constrained training or post-processing that targets error rate equality with utility constraints.
Add human review queues weighted toward high-FPR cohorts while models improve.
Lifecycle governance in AI model lifecycle management is where fairness metrics should gate releases alongside accuracy.
Slice-first deployment habits from shipping image classification models with confidence extend to demographic cohorts when permitted.
Agent and LLM classification layers should log parity metrics with trace evals described in LLM and agent evaluation platforms.
Limits
Equal FPR does not imply equal overall harm if base rates differ.
Optimizing FPR alone can crush recall for some groups.
Proxy features can hide disparities until slice analysis reveals them.
Reporting templates
Dashboards should show FPR per group with numerator and denominator, threshold version, and model artifact id. Executives see rates; investigators see counts.
When FPR parity fails, attach examples of false alarms from affected groups (redacted) so product and policy teams agree on severity.
Compare FPR parity before and after threshold experiments on shadow traffic before promoting new cuts.
Regulatory context
Fair lending and employment domains often review error rate disparities alongside outcome rates. Legal counsel interprets metrics; engineering supplies transparent measurement.
Export metric definitions in model cards so external audits reproduce FPR calculations from logged confusion cells.
Practitioner checklist
Before changing production settings, confirm labels, thresholds, and monitor windows match the definitions used in your last offline eval. Snapshot dashboards when incidents start so postmortems compare apples to apples.
Run slice-level reviews on high-traffic cohorts weekly even when global metrics look flat. Many failures appear first in one locale, product line, or prompt route.
Document model version, featurizer hash, and data window in every incident ticket. Future you needs that context to interpret drift charts.
When metrics disagree (offline vs online, precision vs recall), write down the business cost of each error type before picking a fix. Metrics are proxies; costs are the decision.
Share eval harness links in release notes so support and PM teams know which golden tasks must pass before they announce improvements.
FAQ
Is false positive parity the same as equalized odds?
Equalized odds requires both FPR and TPR parity across groups. False positive parity focuses only on FPR.
Can I achieve FPR parity by raising thresholds?
Often yes, at the cost of recall. Evaluate both metrics and business KPIs.
Does FPR parity apply to multiclass models?
Extend to one-vs-rest false alarm rates per class or focus on the decision that triggers harm.
How do LLM moderators fit?
Define false positives as incorrect flags on benign content; compare rates by cohort on audited samples.
How often should I check FPR parity?
Each model release and on rolling production windows with sufficient negatives per group.