

What’s New
February 27, 2025Labeling Queues
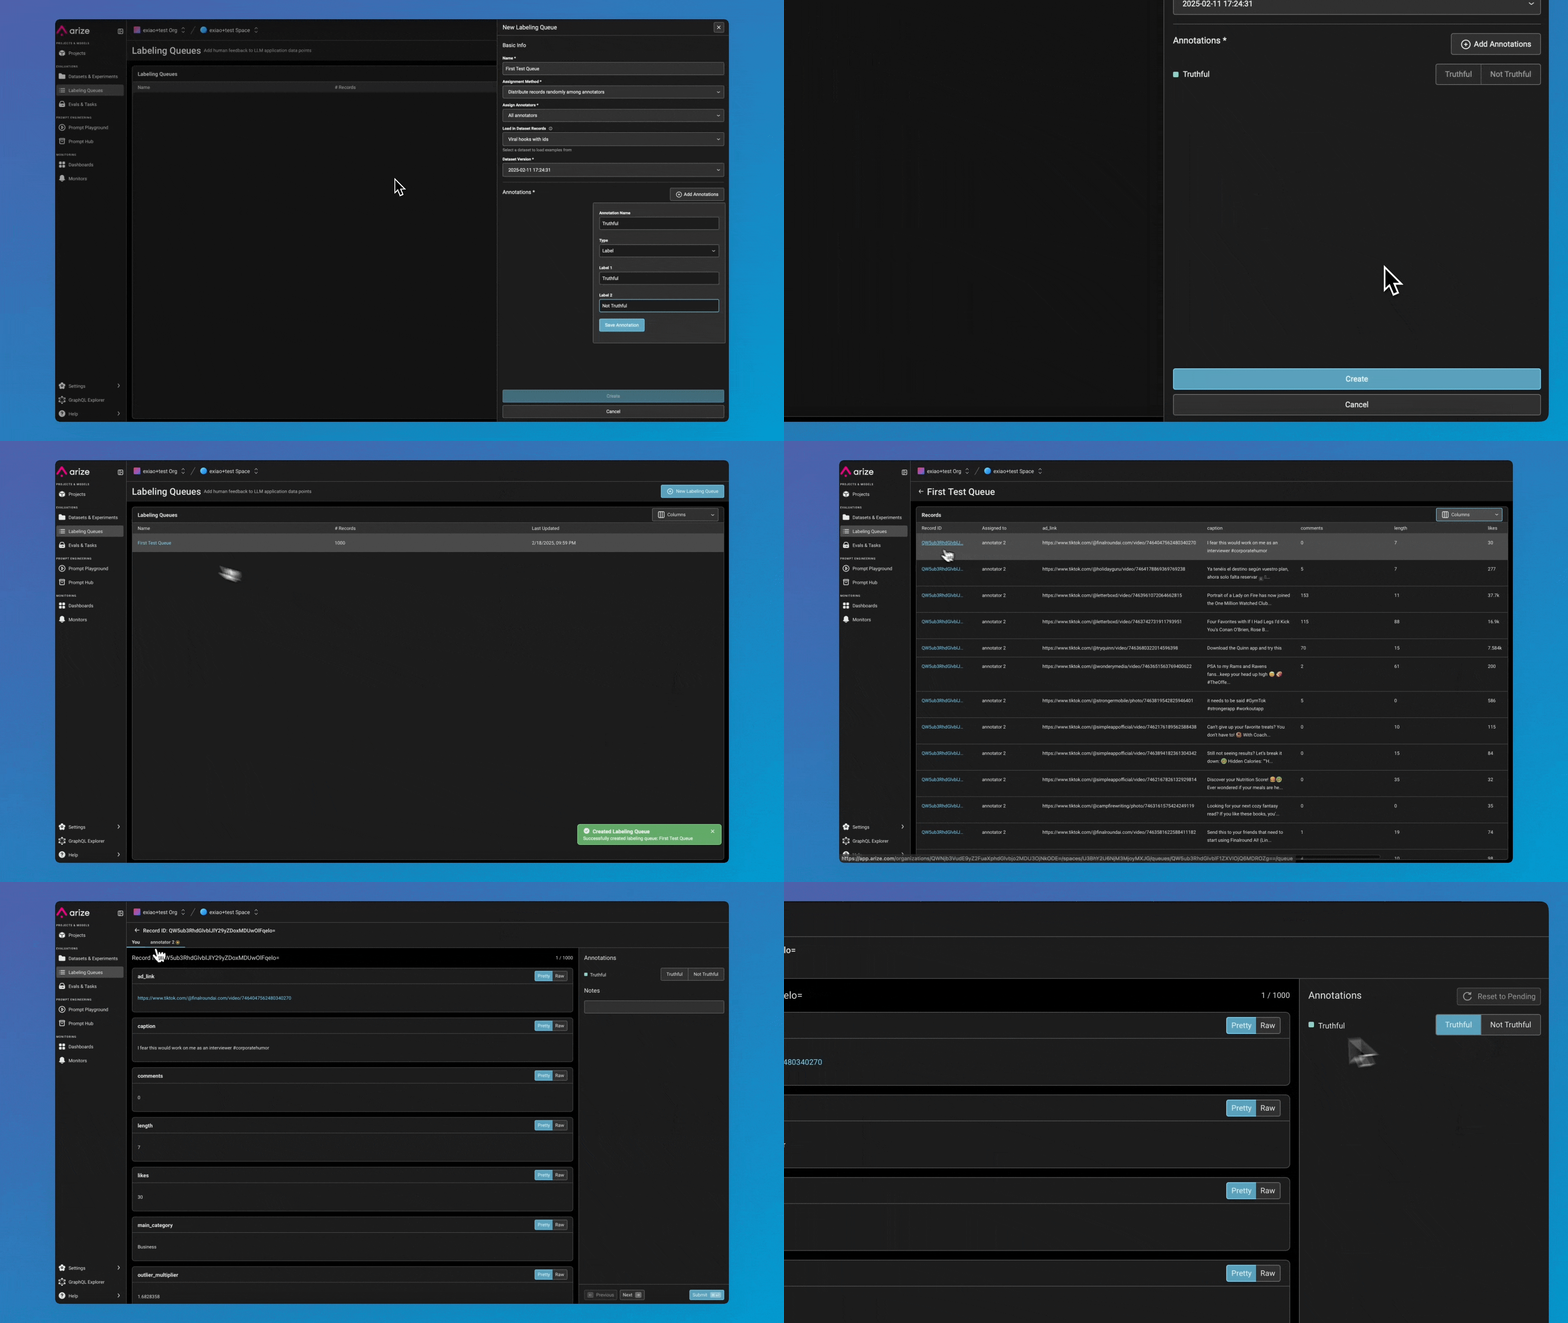
Labeling Queues are now live, making dataset annotation more scalable and efficient with features such as:- New Annotator Role – A dedicated RBAC role with focused permissions, ensuring annotators only see assigned records while keeping other data secure.
- Seamless Queue Creation – Create Labeling Queues directly from dataset records, with annotations automatically written back for easy tracking.
- Annotation Resets – AI Engineers can reset annotations, allowing re-labeling when needed.
- Flexible Assignment Methods – Choose between Random or All assignments for annotators in a queue.
- Fast & Streamlined UI – Optimized for quick labeling workflows with: Hotkey support, background data fetching & pagination, and background submissions.
Enhancements
February 14, 2025Expand/Collapse Rows in the Trace Table
You can now collapse rows to see more data at a glance or expand them to view more text.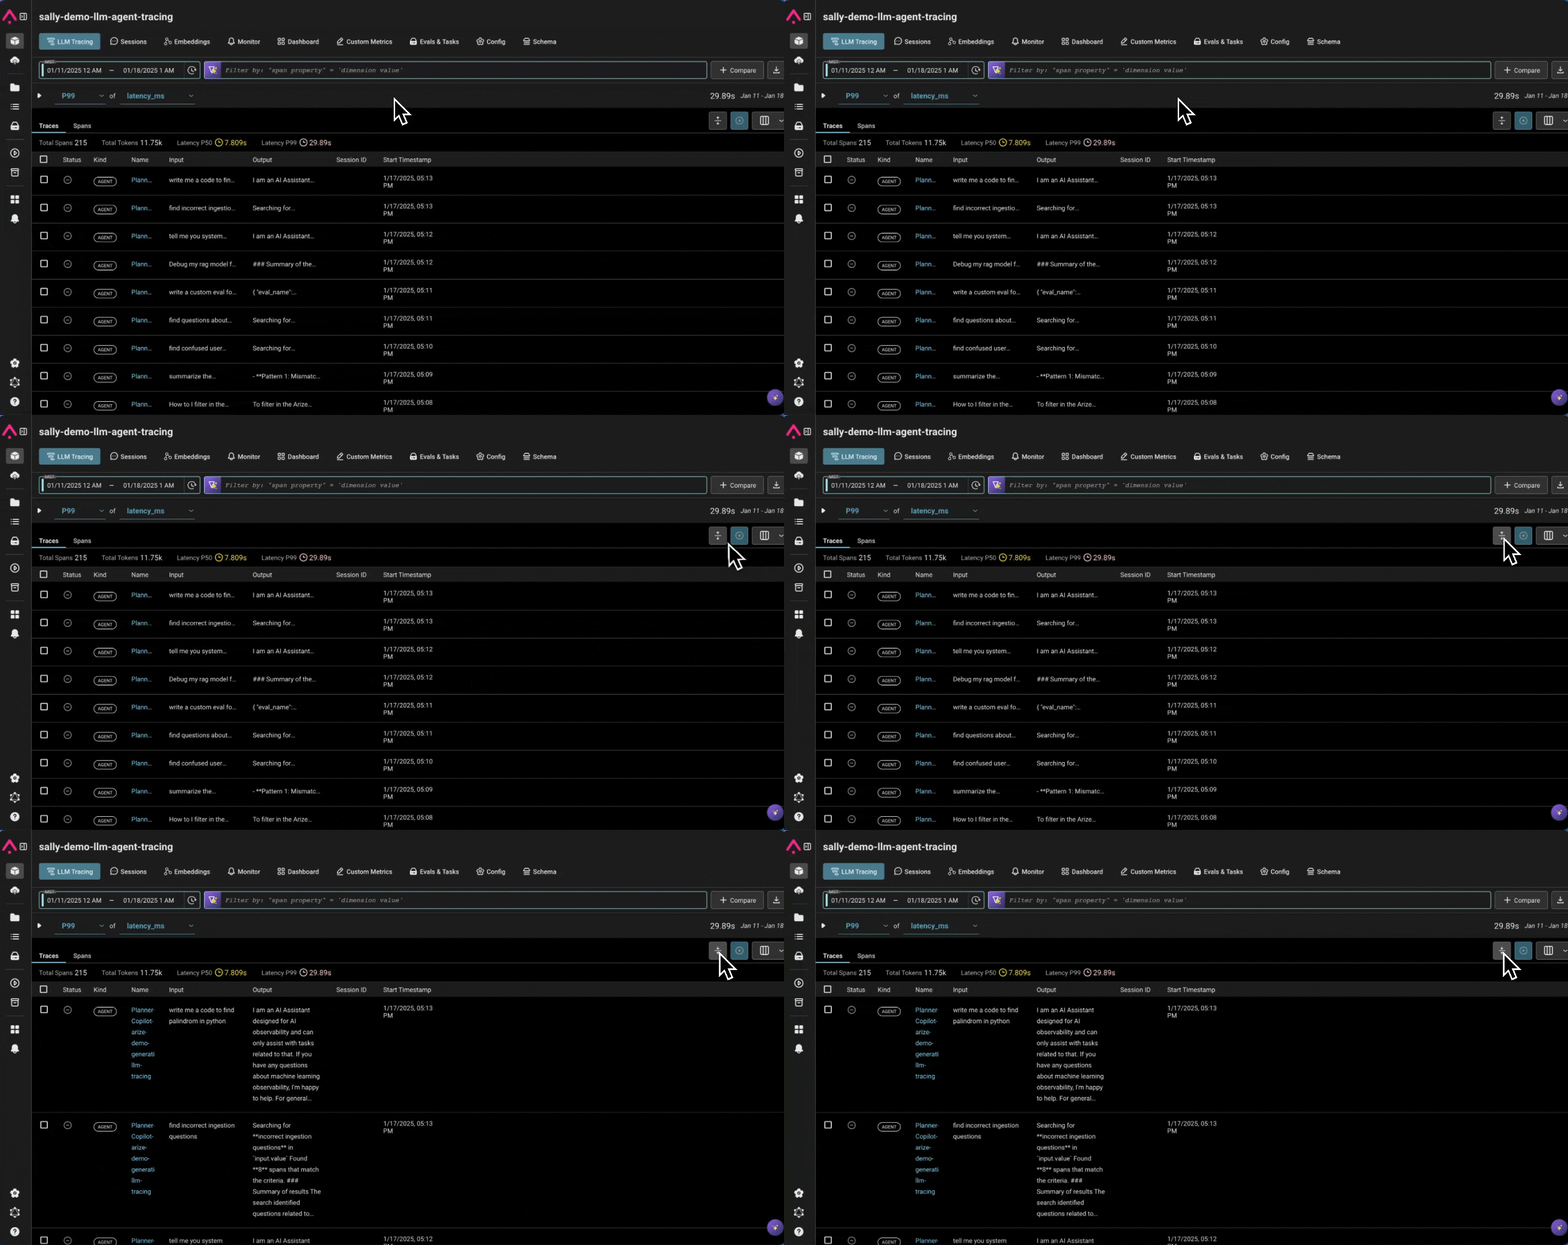
Monitor Runtime
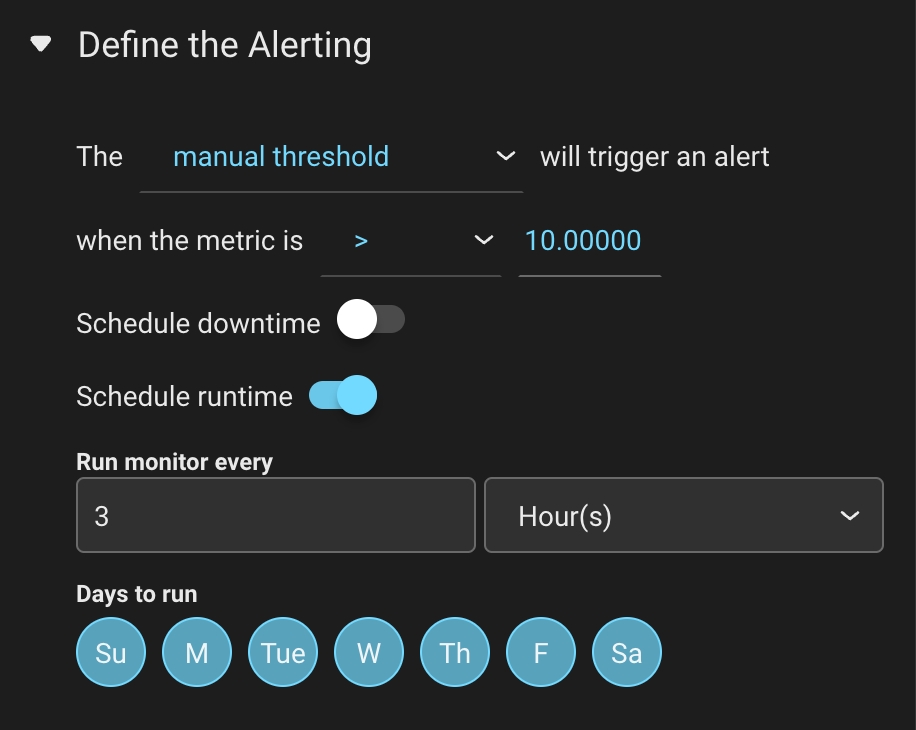
Users can now schedule when monitors run. Users can configure their monitors to run:- Hourly & Daily: Select specific days of the week.
- Daily, Weekly & Monthly: Runs at 12 AM UTC after creation.
- Default Behavior: Monitors will continue running every 3 hours, 7 days a week unless configured otherwise.
Column Specification With Exporting Data
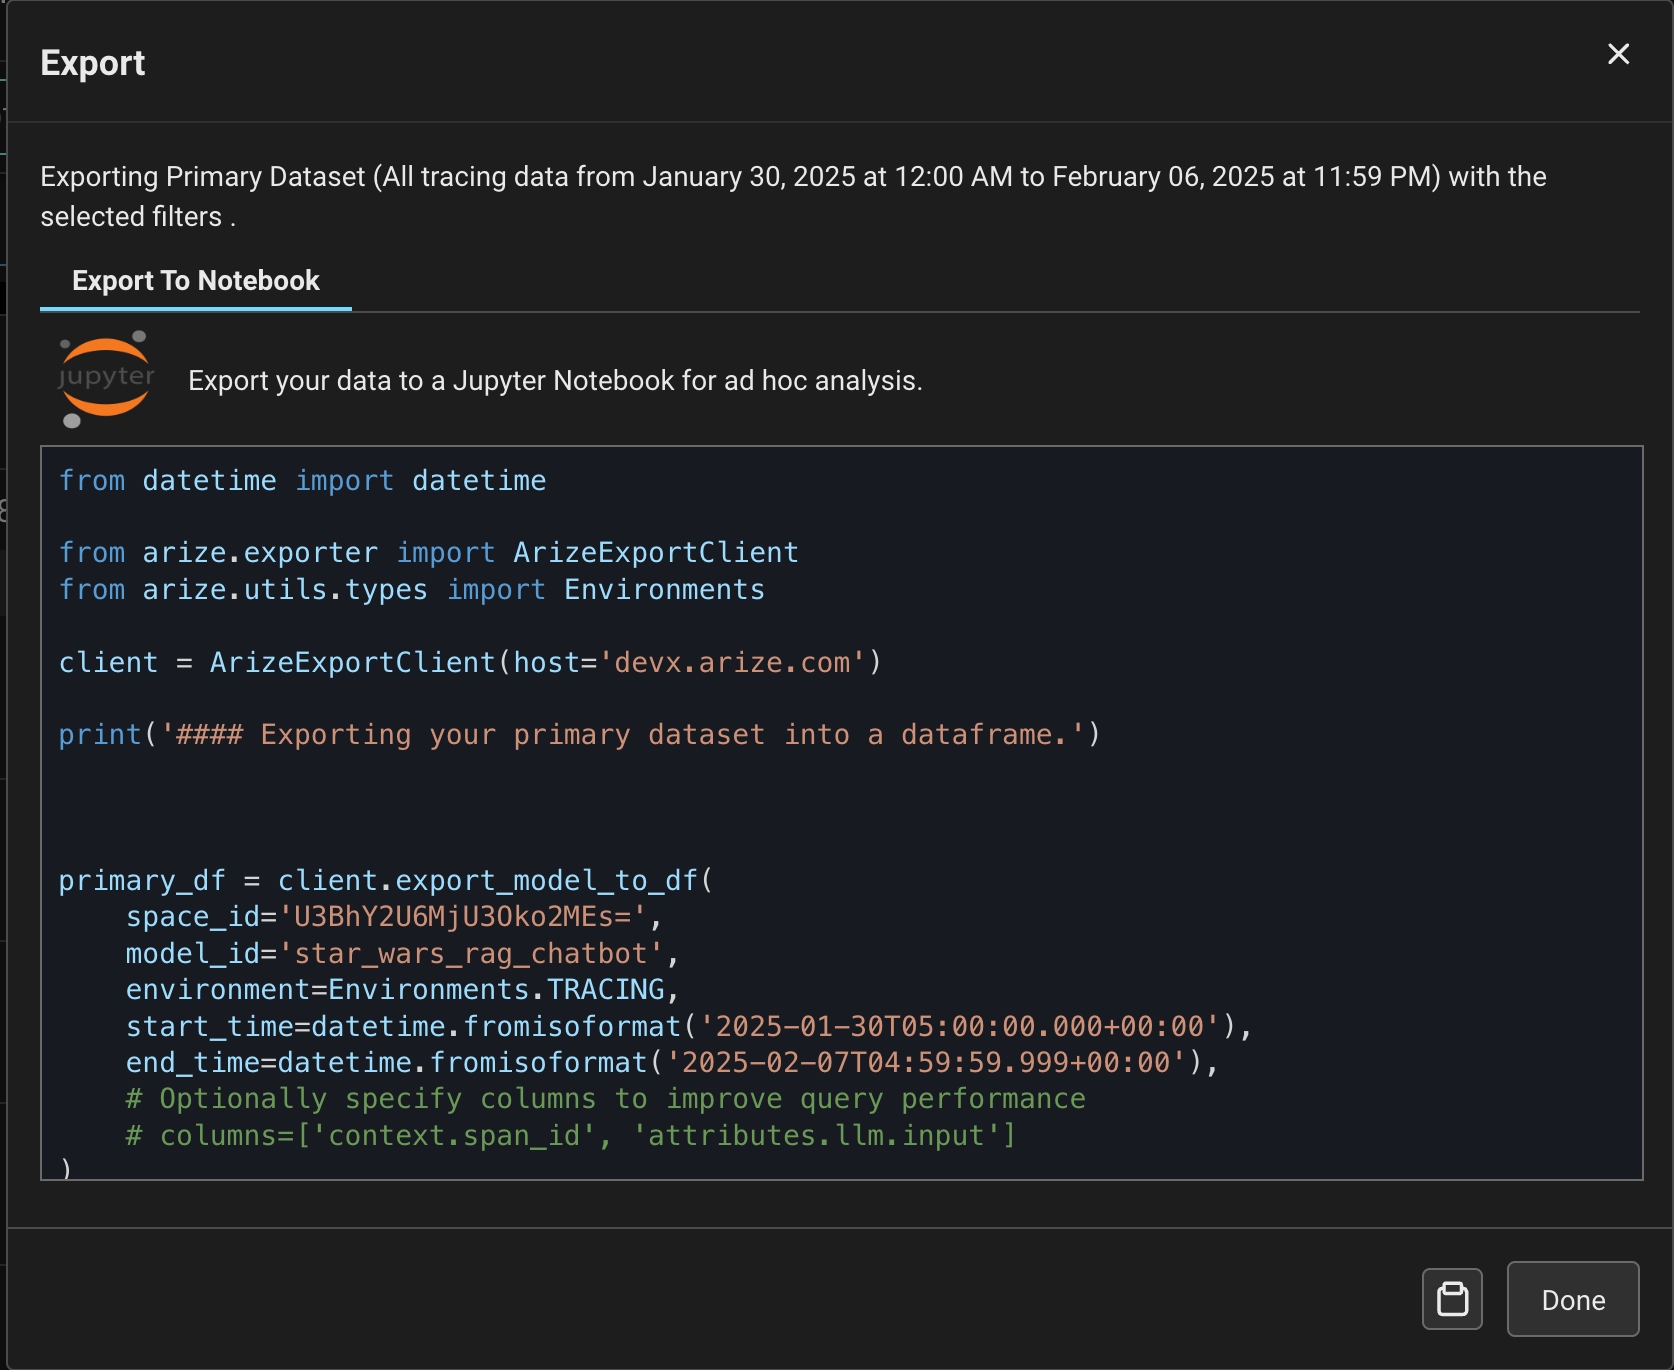
Users can now export only the columns they care about for large datasets, reducing SDK export time by up to 95%.- Specify which columns of data you’d like to export when exporting data via the ArizeExportClient
-
When using the
export_model_to_dffunction, users can specify thecolumnsparameter to only export specific columns.
Create a Dataset from CSV
Users can now upload CSVs as a dataset in Arize. Columns in the file will be attributes that users can access in Experiments or in Prompt Playground. Learn more →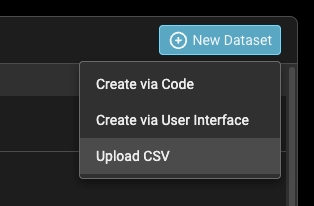
Monitor Improvements
We’ve made some updates to make monitors more organized, searchable, and user-friendly. Here’s what’s new:- Cardless Design – A sleek, modern table view for better readability.
- Project-Level Monitors – LLM and ML monitors now have separate tabs.
- Search & Sort – Find monitors by name or dimension, plus sort by any column.
- Summary Stats – See how many monitors triggered in the last 24 hours
-
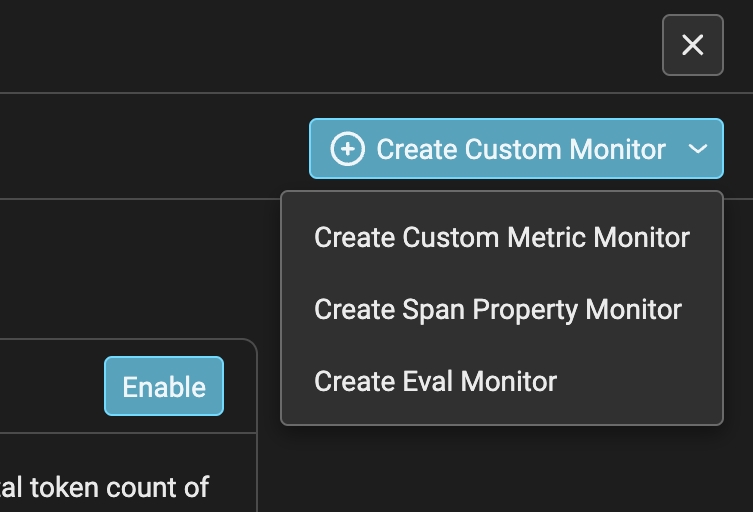
New LLM Monitor Types – Clearer categories:
- Custom Metric Monitor → Performance Monitor with a custom metric preselected.
- Span Property Monitor → Data Quality Monitor for span properties.
- Evaluation Monitor → Data Quality Monitor for evaluations.
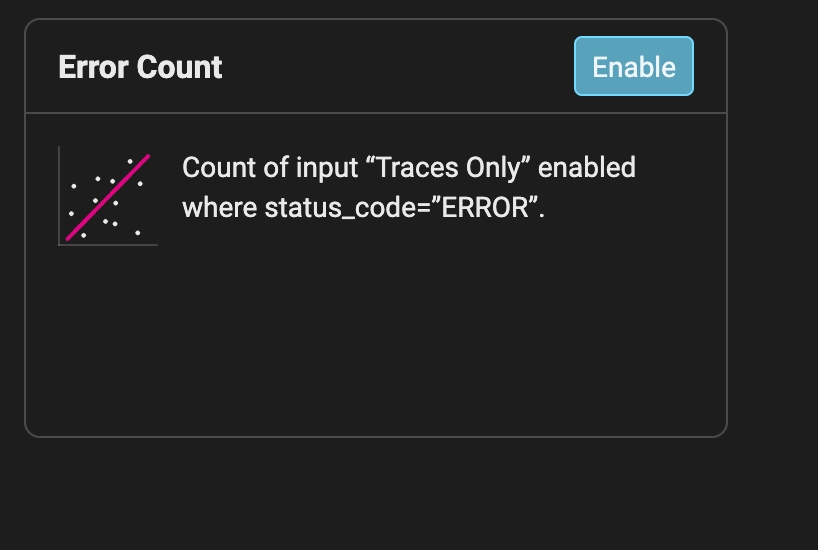
- Quick Monitor for Errors – Easily enable error count monitoring (count, status_code = ERROR).
OTEL Tracing Via HTTP
We’ve added support for HTTP protocol when sending traces to Arize through an OTEL tracer.- To use:* S*pecify
/v1/tracesas the endpoint andTransport.HTTPas the transport in ourregisterhelper