


Introduction
When you’re an on call engineer, every second counts—especially when you’re troubleshooting incidents that will impact users. 100X AI is a startup that’s building AI agents to help engineering teams resolve incidents faster and with greater precision.
But to build intelligent, automated troubleshooting workflows, they need visibility into these LLM-powered agents—that’s why they use Arize Phoenix. Dat Ngo (Director of Solutions, Arize AI) sat down with Eddie Guo (Co-Founder, 100X), and Swaraj Raibagi (ML Engineer, 100X) to explore how they leverage Phoenix for observability, tracing, and performance monitoring, and why they’re power users.
From auto-instrumentation to OpenTelemetry integrations, the team talks about how Phoenix helps them fine-tune their AI agents and close the gap between alerts and resolution.
Watch the recording or read the transcript to see how 100X, fresh out of stealth, is revolutionizing AI-driven troubleshooting with Phoenix—we’re excited to see what’s next for them!
Watch
Transcript
At 100x, we’re building agents to 100x the productivity of the engineering team. That’s why we’re called 100x, and we’re starting from the one of the most painful duties of the engineers which is on-call. A 100x bot connects to your engineering stack, intercepts your system, alerts, and acts as the first line of defense.
Dat Ngo (Director of Solutions, Arize AI): We’re showcasing Arize Phoenix power users, and also 100x, so help me give a kind of warm welcome to Eddie and Swaraj.
My name is Dat, I’m your showcase host. You might have seen me on some other Arize videos. But the real stars of the show are really Eddie and Swaraj. So I would love an introduction from Eddie first and then Swaraj.
Eddie Guo (Co-Founder, 100x): Awesome. Yeah, really glad to be here, and thanks for the invite. My name’s Eddie. I’m the co-founder and head of AI at 100x. Before 100x, I was leading ML Search and building agents at Moveworks, and prior to that I was at Uber building their pricing algorithm. Really good to be here.
Swaraj Raibagi (ML Engineer, 100x): Yeah, yeah, absolutely. Thanks for inviting us Dat, and the Arize team. My name is Swaraj, I’m a machine learning engineer here at 100x. Before this I was dabbling in the world of data science, ML and NLP at a few different companies mainly building, you know, analytics or chatbots or applications on top of on top of enterprise data. So it’s really exciting to talk about how we’ve been using one of our favorite tools actually.

Dat: Awesome love it. Thanks for the introductions, and I mean I have to ask, you know, would love to know a little bit more about like just 100x in general. How you guys came together as founders, and what you were trying to solve?
Eddie: Yeah, I can tell a little bit about 100x and what we’re building. At 100x, we’re building agents to 100x the productivity of the engineering team. That’s why we’re called 100x, and we’re starting from the one of the most painful duties of the engineers which is on-call. A 100x bot connects to your engineering stack, intercepts your system, alerts, and acts as the first line of defense. Our product learns from your knowledge in your system, understands your tech stack, and when issues happen, it is able to autonomously pull all the relevant information, either from your observability tool, from your internal toolings, your internal API databases, and present a finding to the engineers, even before engineer starts to acknowledge the alert right? And this helps them resolve and troubleshoot issues much faster. So we’re working with a group of world class companies, especially, really, really, technical products right now.
Dat: Awesome. And then, just to summarize what I heard there. So 100x, for anyone who’s ever been on-call you get like a text or a call from…I don’t know PagerDuty or Opsgenie, but what you’re saying is like 100x really helps–I guess you guys use agentic workflows–probably large language models as well, to do a lot of the preemptive work? Or does it solve everything for you?
Eddie: I think it’s a combination. It’s a combination of both and depends on the specific, alert right? We’re able to understand the root cause of the alert by just understanding. We have ability to know all the different metrics immediate to your system and we know the sort of the service topology in your system, able to pinpoint the exact right system, what kind of metrics and logs to pull, also able to follow maybe very specific steps, and that’s mentioned in your run books to troubleshoot the alert.
Dat: Gotcha. So a lot of that contextual information like, you get an alert, you have to look through stuff, figure it out. It’s kind of aggregated that stuff up and done a lot of the heavy leg work for you. That makes sense.
And then I guess my next question is: How are you using or leveraging Arize Phoenix? Would love to see an example of that.
Swaraj: Yeah, I can paint some color there. So 100x is meant to be AI-first troubleshooting at multiple levels, and multiple parts of your alerts lifecycle.
So, we use LLMs on various levels, setting context for our larger, for wider agents, or even doing smart sort of data, querying at an integration level. Finally, we also use LLM agents to sort of format the output, so that it sort of bubbles up the most important parts for you when you’re presenting this to the user. So one large challenge for us before we started using Phoenix was getting visibility across all of these different levels, so we could instrument stuff at the very top of our investigations quite quickly. But as soon as we started adding more complexity, the sort of parallel work and maintenance work of building out all this instrumentation was something that didn’t always get prioritized.
So that’s when we came across Arize, and I think, we noticed sort of three benefits when we were when we were going through and looking for different options, like one, as I mentioned, was just end to end visibility on, on all the different parts that we want, and then being able to sort of add customized checkpoints or spans as such. And so we really like Arize’s sort of approach of just fitting it with OpenTelemetry. And all of these frameworks that people are using.
And then that comes to my second point for using Arize is that the auto instrumentation is just really great. It’s a true quick start when you, when you first try it out. And we were able to get a lot of these fans right out of the box in about 10 min of setups. I think that was great, and we knew we were going to be growing in complexity, but also growing in use cases with our observability data, I think with LLM applications, as is with ML applications. Looking at your data is so important, and the more we could consolidate all the different aspects of looking at your data in one place.
So, I think usage and performance visibility is one. But we also use our eyes for creating data sets and then running sort of experiments on those which and those data sets, of course, are sort of born out of those element traces itself.
I’d love to show you two ways we actually use Arize internally, and then a third way after that.
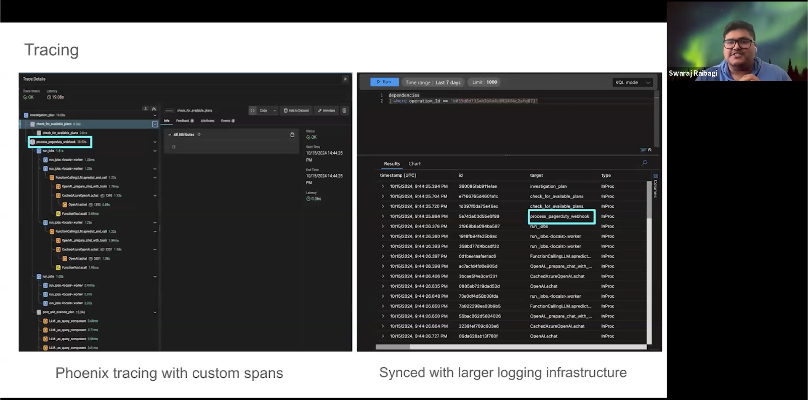
The first is tracing. You can see here on the left, we’re doing various custom plans like investigation or process, but then the rest of these are kind of out of the box essentially, which was really great to see the different operations that it takes to make an LLM call. It’s no longer just sending one string sort of packaging functions. It would be parsing out data. So I think having that level of instrumentation is really useful. What we also really liked about Arize is because it uses OpenTelemetry.
You’re able to sync it with our large language model infrastructure where the rest of our logging exists, which is on Azure. And so that was a great benefit to be able to do that. And once again the lift to making that happen was essentially just a couple of lines of code which is pretty fantastic. But this is a lot about observability and giving engineers and any product managers a quick view into what’s happening under the hood.
But oftentimes you want to tie this under the hood sort of information with top level usage metrics. And so what we’ve also done is we use post hog to send alerts on usage when users perform any action such as maybe interacting with an optional button on a slack channel that we’ve posted a message on. And so you can see here that in our sort of product alerts channel. We actually are told that this is the message the user clicked on, and then that kind of goes to another Phoenix link. I’ve hidden some of the sensitive parts, but you can see that this is another Phoenix link.
So what we were trying to do is: how do we close the gap between an engineer or a team member wanting to see what is what is under the hood? And because Phoenix provides such a good under the hood view, I think that was the reasonable choice to go with. So those are some ways we leverage Phoenix on a regular basis. I think most of us end up clicking one of these links multiple times a day.
Dat: Awesome, great, great presentation there. And I think it’s pretty meta that you’re using observability. And, oddly enough, it’s like in your own system, like you’re using observability to help other people or figure out: is this agent who’s helping me with kind of preemptive on-call work, for example, or investigating what’s happening. And it kind of begs the question (it gets even more meta here) do you use your own tooling– like I’m sure you have infrastructure where things might break, and I’m sure you have an on-call engineer as well–But do you even leverage your own product in that sense, too? And how’s that experience?
Swaraj: Yeah, that’s a great question. And I think dogfooding a product like this was just sort of common sense for us a little bit since we’re building an engineering stack, and we will have issues. And we all didn’t want to jump through 10 different applications. And we’re already at something like 5 or 6 that you may need to go look at to solve an alert. And so what we’ve been able to do is, as you saw, we were able to sync some of these phoenix bands to this auto instrumentation to our Azure logs. And so that’s where 100x sort of comes in and I’d love to show you a demo here and talk you through it. (See 9:30:00 in the video above).
So here we can see a pagerduty alert being fired for one of our applications to start with. We already have the trace ids in our page duty payloads, and so 100x constructs the Phoenix URL, and provides that directly in Slack. So you can quickly see: this was the issue that was entered, and there was some trace back. But then, following that, 100x sort of goes into the logs and constructs these queries that run on top of Phoenix traces.
And so you can see, those are some of our custom spans, and then pulls out the most relevant error. In this case a websocket disconnect that occurred while we were still processing something.
Additionally, sometimes the error is just not enough. Sometimes you want to sort of like a timeline of what essentially happens. So we actually run over each trace ID, which in this case is an operation ID. And then you’re told: we tried an initial error, but there was a subsequent attempt, and there were multiple cascading failures that happened after that.
And so that’s that’s one way that we avoid going to, you know, PagerDuty, going to azure to figure out what exactly went wrong, and then actually get a quick sort of hook into Phoenix as well to see some of those underlying spans. Maybe there was something that we missed there.
So, this is one of the ways that we use Phoenix and our own product to provide value to our own team.
Dat: Yeah, I really love how seamless it is. I think, being in a startup, you kind of live and breathe in Slack, and a lot of alerts are in Slack channels and things like that. But it’s really nice that you can go back and forth in between. And just get context,really, really quickly, and not have to go to some place, type in some ID to figure out some issue. I really like that.
As you’re thinking about your product, how are you guys thinking about evals or quantifying how well your agentic system is doing? And how does that tie into tracing? How do you guys think about evals?
Swaraj: Yeah, I think we might have to just take a quick pause, because for some reason, I’m not able to stop screen sharing. Okay, sorry about that.
Dat: All good.
Swaraj: It should be fine now. So you were talking about evals, right? So I think from day one, you were already sort of forming an idea of what sort of eval data sets we would need across the board. When we had a few LLM calls, it was quite easy to pick out a few examples and then use Google sheets and try to make something work there.
But as soon as we started growing in terms of LLM calls and different programs, we realized we need a tool to not just trace, but also gather these examples, and run experiments on top of them.
I think that’s where Phoenix was also really useful for two different reasons. Actually, for one, Phoenix lets you add feedback that comes in from users onto existing spans. So we’ve been using that to automatically create a set of examples where users have provided feedback. And so that goes into this annotation queue where you want to see if those are good examples for our data sets.
Additionally, I think, on LLM spans itself, you can create these data sets out of Phoenix. That’s been really useful as well. Whenever I am reviewing a lot of spans, it’s a very easy workflow to go add new examples to data sets. And then using those data sets, you can create metrics on top of it.
We’re very targeted with our evals though. It’s easy to sort of blow up the evals to be something that’s a lot more work than the actual product. So we’re very targeted about it. And that’s what I like about Phoenix–you don’t have to create an entire investigation or multiple calls into one data example. You can, pick out very specific parts of your trace, and then be like: Hey, I need to make sure that at least this top level sort of routing is correct, and then I’m pretty sure of the rest of the pipeline.
We use the data set feature exhaustively to create more data sets. But I think on evaluation, we’re very targeted about what we’re trying to measure and what measure we’re trying to push.
And that’s what I like about Phoenix–you don’t have to create an entire investigation or multiple calls into one data example. You can pick out very specific parts of your trace, and then be like: Hey, I need to make sure that at least this top level routing is correct, and then I’m pretty sure of the rest of the pipeline.
Dat: Awesome. Yeah, thanks for the context. There, I think, like, yeah, a combination of user feedback, and then running evals at maybe specific points or spans that you consider important, probably super key.
What other AI tooling do you love in your stack? And what does your tech stack look like today? And what tools do you have? And why do you like them?
Eddie: Yeah, we’re definitely a big believer in how AI tools will 100x productivity of engineers, right? Aside from our own tools like Swaraj mentioned, I think it definitely helped us catch a few pretty severe issues and we’re able to resolve problems really quickly with the 100x tool. We definitely built an internal sort of code review PR comment generator tool just for ourselves– one of my co-founders just built it as a weekend project, and we’ve been using it happily ever since.
We use a lot of code generation tools like GitHub, Copilot, Cursor. It’s really working well for us.
And of course, like a lot of companies, we have a lot of calls with customers, so note taking tools really help us go back to our notes, summarize key points, get action items for our next meeting, and we definitely have a few other like tools across hiring, across our go to market as well.
Dat: Oh, love that. Yeah, I think you’d be pretty hard pressed to like sell an AI product if you’re not a big AI user yourself. So I definitely love that. And I think the tooling you’re using is solid. I can’t wait to see how the tooling gets better.
Okay. So for some of the folks who know me from Arize, I love hot takes. So for this next one, I would love to hear y’all’s hot takes.
What are the things you, Eddie and Swaraj are thinking about? What’s your hot take and what are your core bets in this space? What are things that you take a contrarian view to? What are some things that you kind of like agree with the masses? Curious on your take.
Eddie: Yes. I think one thing we fundamentally believe is that troubleshooting issues like on-call alerts is more of a knowledge problem, not a data problem, right? There are a lot of observability companies there, and of course, it is in their interest to have people pipe all their data, all the data to that one centralized system.
But the fact is that people use 10 different tools, or more at larger, more mature companies. Even from team A to team B, they’re using different tools. Right?
So even if the data is there, how do you access that data? It’s hard.
People repeat the same process again and again, every single day, and people write a bunch of run books, knowledge and troubleshooting guides within their organization (and sometimes they even forget to do that). But when they leave, nobody knows how to access the data. And even after they access data, how do you correlate everything? Right? How do you know: I’ll always look at this log A, and this metric B, right? All this information is there.
So we fundamentally believe it’s a knowledge problem, and an agent is here. And even a group of specialized agents who can work together, who know the context. Who know how to dig into that knowledge–maybe it’s on the Slack thread–and stitch them together in order to form a holistic view of your system.
We believe that’s the solution for the future, and that’s why we’re building in that direction.
Dat: Oh, I love that. I mean, that’s so true. It’s so contextual, right? When you’re solving problems. It is so contextual.
And then maybe as a last question, I love when founders get to plug their take. I would love to know, you know. Maybe, what’s on your roadmap or anything else you want to highlight about 100x? What would you say to a future 100x user who is listening but isn’t using 100x now? What do you want to share?
Eddie: Yeah, the first thing is always more integrations. We have a lot of customer interest. We know that engineers use a wide variety of different tools. We definitely want to be able to support that demand, so we can onboard our customers more quickly.
And another thing we’ve been thinking about a lot is: how can we be more proactive rather than reactive?
A lot of how the current system works so that engineers have to purposely set an alert, fine-tune the threshold for that alert. When it happens, they’re jumping into looking into what’s going wrong. Sometimes that can be a little too late.
How can we be more proactive with this abundance of data? How can we detect issues before it becomes a problem, right? Can we stop it? Can we alert engineers right? And also, can we take more actions on the system as humans are getting more comfortable with AI suggestions? Troubleshooting steps right with some steps, requires the right access. Can we, after we build more confidence, how can we take actions on behalf of humans in a safer way and in a trustworthy way?
Those are some of the areas we definitely want to double down on in the coming months.
Dat: Oh, I love that just you know you think about the theme of AI is just making all of our lives easier and and just the ability to move faster as well. So I want to give a big shout out to Eddie and Swaraj for being our guests today. Definitely check out 100x. Even if you’re not an engineer, I’m pretty sure you’ll still need it.
And then thank you so much, Eddie and Swaraj for coming.
And then for our audience members, remember, if you get a chance, please give us a star on Github. Arise, Phoenix, we really appreciate you, Eddie and Swaraj, and thanks for coming on.
Swaraj: Thanks, Dat. Thank you for having us
cheers. Thank you.
Eddie: Cheers!