


Best Practices In ML Observability for Monitoring, Mitigating and Preventing Fraud

Tammy Le
Chief Marketing Officer
Every year, fraud costs the global economy over $5 trillion. In addition to taking a deeply personal toll on individual victims, fraud impacts businesses in the form of lost revenue and productivity as well as damaged reputation and customer relationships. AI practitioners are on the front lines of this battle, building and deploying sophisticated ML models to detect fraud that save organizations billions of dollars every year.
Of course, it’s a challenging task. Fraud takes many forms and attack vectors across industries, from financial services to healthcare, insurance, technology, and travel. Really, no organization is immune from fraud in today’s world as data breaches become more common at large enterprises, stolen credentials are sold on the dark web and hackers target everything from critical infrastructure to local hospital chains with ransomware.
Why ML Monitoring and Observability in Fraud Detection?
Part of the reason fraud persists is the complexity involved in identifying it in the real world. Constantly-evolving abuse patterns and imbalanced datasets can easily foil rigid rules-based systems. Due to this fragility, businesses and governments alike long ago adopted ML techniques for anomaly detection, fraud prevention, and other counter-abuse investment areas. However, unmonitored, fraudsters have even been able to render naive ML models stale in a matter of weeks.
As perpetrators continue to reinvent adversarial techniques to exploit models in production, monitoring for anomalies has become both business critical and time-sensitive. By detecting deviations between baseline and production distributions and examining feature and cohort performance, teams can be proactive in identifying issues and retraining models to minimize losses.
A credit card company examining differences in inference distributions, for example, might discover that a fraud model has far more false positives in production than the validation baseline — resulting in millions of legitimate purchases getting denied at the point of sale and annoyed customers switching to other cards. Alternatively, an ML team examining a dip in aggregate accuracy might discover that a fraud model isn’t as good at predicting smaller transactions relative to the big-ticket purchases that predominated in the training data. No matter the issue, monitoring can help ML teams forestall losses and preserve hard-won brand loyalty and market share.
Monitoring and observability are important for another reason: in heavily regulated industries like finance and healthcare, ML model transparency is required by law for any claims made by an automated system. Beyond compliance, organizations also want explainability to introspect and understand why a model made a particular prediction to ensure broader governance, fairness, and mitigate bias.
Challenges Particular To Fraud
Before diving into best practices for troubleshooting fraud models in production, it helps to know some of the common challenges in working with fraud data and what can go wrong.
Even if you feel like you have a good handle on the data itself, a host of issues frequently bedevil counter-abuse ML teams. Here are some common challenges:
- Imbalanced Datasets. As a general rule, fraud accounts for a relatively small portion of transactions in the real world. In healthcare, for example, fraud is estimated to be 3% of total transactions. With less data on the actual activity or observation of interest (i.e. upcoding or prescription forgery in healthcare) available at the training and validation stage, models will likely perform poorly in the real world without proper countermeasures like data upsampling.
- Misleading Traditional Evaluation Metrics. One might think their model is performing extremely well if it yields 99% accuracy. However, if your model sees less than 1% of fraudulent transactions, this misleading metric could actually mask the fact that your model is still (in the worst case) missing every possible fraudulent transaction. Since most ML algorithms optimize to maximize accuracy and reduce error, they tend to work best when samples across classes are balanced and equal. This is rarely (if ever) the case with fraud, where fraudulent credit card transactions for example might be 0.5% of all transactions but still add up to over $100 million per month.
- Limited/Sensitive Features. Data on transactions can also be limited. In industries like healthcare or financial services, regulatory and compliance measures result in sensitive or personally identifiable information (PII) being redacted from data sources to abstract the user from the transaction. For example, a credit card transaction might be limited to its most basic details (i.e. transaction ID, date/time, terminal, transaction amount, location, etc).
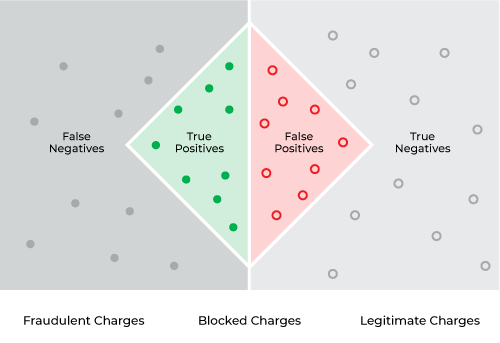
- Not All Inferences Weighted Equally. A misclassified fraudulent transaction (a false negative — predicting “not fraud” for a transaction that is indeed fraud) is often more costly than a misclassified legitimate transaction (a false positive — predicting fraud for a transaction that is not fraud). In credit card fraud, the latter is a mild inconvenience to a customer — who can usually confirm via text message whether a credit card charge is legitimate — while the former is an immediate financial loss.
Best Practices for Observability with Fraud Models
Once you’ve set up a baseline and monitors, the task at hand becomes identifying the root cause of issues and responding quickly as threats evolve in real-time. While every industry and organization’s models and metrics are slightly different, there are some commonalities in identifying what is not working as expected and how to respond.
Important Metrics
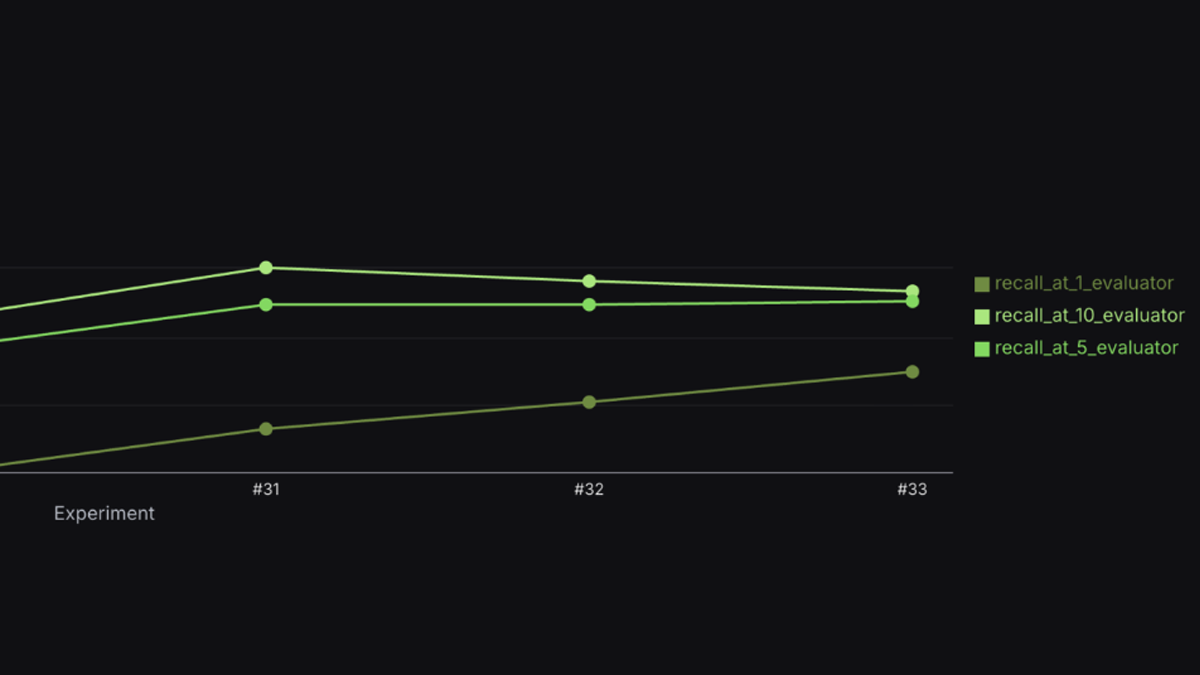
As mentioned, accuracy may be misleading when it comes to evaluating the performance of your fraud model. Some important metrics to watch include:
- Recall. How much fraud your model is picking up can be instructive, providing a window into your model’s impact against real-world threats. Alternatively, you can monitor your model’s false negative rate (inverse of recall).
- False Negative Rate. False negative rate measures fraud that a model failed to predict accurately (classified as not fraud). It is a key performance indicator since it’s the most expensive to organizations in terms of direct financial losses, resulting in chargebacks and other stolen funds. False negatives are behind the estimated $1.5 trillion in losses from fraud in the financial services industry every year.
- False Positive Rate. The false positive rate — or the rate at which a model predicts fraud for a transaction that is not actually fraudulent — is also important because inconveniencing customers has its own indirect costs, whether it’s in healthcare where a patient’s claim is denied or a credit card where a customer gets delayed buying groceries. According to a study from Forrester and Adobe, enterprises that prioritize customer experience generate 1.6 times more customer lifetime value than other companies.
Performance Degradation
It’s critical to identify the slices — or combinations of features and values — driving a drop in performance. Diving into a performance analysis of your model by filtering on various low performing feature/value slices can help bring to light fraud patterns, fraudster origin, and hidden model exploits.
Going back to the earlier example of credit card fraud, the slices behind a sudden drop in performance might be a surge in smaller fraudulent charges (<$5) from local merchants throwing off a model that was primarily trained on larger transactions from national retailers. Armed with this insight, ML teams can then adaptively retrain the model to improve performance on these segments.
In each case, having an ML observability platform that not only monitors your performance metrics but also proactively surfaces feature performance heatmaps can be the difference between patching costly model exploits in hours versus several days.
The Importance of Drift
As an ML practitioner, you are likely to encounter drift or distribution changes over time. Monitoring and troubleshooting drift is an important part of every practitioner’s toolkit (for reference, here is a deep dive on how to troubleshoot model drift written with Delta Air Lines’ Hua Ai).
Especially with fraud where tactics are always evolving, it’s important to account for drift to ensure your models stay relevant. Identifying feature, model, and actual drift between various model environments and versions can be helpful in identifying fraud patterns, data quality issues, and anomalous distribution behavior.
To make this concrete, let’s go back to the credit card example where a company sees a sudden surge in smaller fraudulent transactions at local retailers. By detecting changes in the shape of the data — in this case, transaction size — practitioners can be proactive, stamping out the new tactic before it causes wide losses. This is especially important in financial fraud like identity theft, where the victim might not even realize and report the activity until months later.
Continuing the credit card fraud example, here is a guide to what some anomalous distribution changes might mean depending on where they are happening along with real-world scenarios:
Help! We’re seeing…
Prediction Drift
Possible Drift Correlation: An influx and surge of fraud predictions could mean that your model is under attack! You are classifying a lot more fraud than what you expect to see in production, but (so far) your model is doing a good job of catching this. Let’s hope it stays that way.
Real-World Scenario: A hack of a health provider leads to a surge of identity theft and credit card numbers sold on the dark web. Luckily, the criminals aren’t novel enough in their exploits to avoid getting caught by existing fraud models.
Actuals Drift (No Prediction Drift)
Possible Drift Correlation: An influx of fraud actuals without changes to the distribution of your predictions means that fraudsters found an exploit in your model and that they’re getting away with it. Troubleshoot and fix your model ASAP to avoid any more costly chargebacks.
Real-World Scenario: A global crime ring sends unemployment fraud to all-time highs using new tactics with prepaid debit cards, causing a dip in performance for fraud models trained on pre-COVID or more conventional credit card data.
Feature Drift
Possible Drift Correlation: An influx of new and/or existing feature values could be an indicator of seasonal changes (tax or holiday season) or in the worst case be correlated with a fraud exploitation; use drift over time stacked on top of your performance metric over time graph to validate whether any correlation exists.
Real-World Scenario: An earlier holiday shopping season than normal takes hold, with bigger ticket purchases than prior years. It might be a sign of record retail demand and changing consumer behavior or a novel fraud exploitation (or both).
Conclusion
As fraud continues to evolve and even take new forms in the modern era with high potential for losses, it’s critical for data science and ML teams to have an observability strategy in place to catch, monitor and troubleshoot problems with their fraud models in production. By having an approach that is both reactive in monitoring key metrics and proactive in measuring drift, counter-abuse ML teams can begin to get ahead of potential problems and free up time to focus energy on the most sophisticated threats.
For additional reference, here is how Arize helps clients tackle fraud monitoring. To dive deeper into all things fraud models, sign up for our upcoming webinar.