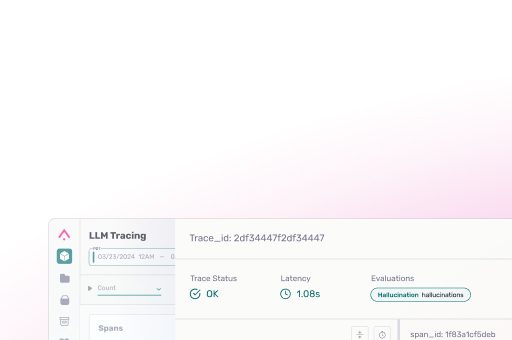
Tracing is a powerful tool for understanding the behavior of your LLM application. Leveraging LLM tracing with Arize, you can track down issues around application latency, token usage, runtime exceptions, retrieved documents, embeddings, LLM parameters, prompt templates, tool descriptions, LLM function calls, and more. To get started, you can automatically collect traces from major frameworks and libraries using auto instrumentation from Arize — including for OpenAI, LlamaIndex, Mistral AI, DSPy, AWS Bedrock, and Autogen — or create and customize spans using the OpenTelemetry Trace API (because Arize and OpenInference support OpenTelemetry, this means that you can perform manual instrumentation with no LLM framework required). This tutorial covers what LLM tracing is, why it matters, how to ingest traces, and LLM tracing in Arize. It includes a code-along example. More: 🚀 Quickstart: https://docs.arize.com/arize/large-language-models/tracing/quickstart-tracing 🤖 Auto instrumentation: https://docs.arize.com/arize/large-language-models/tracing/auto-instrumentation/ 🔗 Other Links Connect with Eric Xiao on LinkedIn: https://www.linkedin.com/in/ericxiao/ 🧠Learn more about LLM tracing: https://arize.com/blog/llm-tracing-and-observability-with-arize-phoenix/ 🪽LLM Tracing with Phoenix: https://docs.arize.com/phoenix/tracing/llm-traces-1/ Timestamps: 0:00 What is LLM tracing? 0:18 How to ingest traces 1:08 Code walkthrough: haiku LLM app example 2:52 Product docs chatbot example: tracing in the Arize platform #llm #llmtracing #opentelemetry #largelanguagemodel #ai #gpt4o #debugging #traces #spans #evals #llamaindex #openinference #phoenixoss
- Phoenix OSS
- Pricing
- Docs
-
Learn


