


Co-Authored by Aparna Dhinakaran, Co-founder & Chief Product Officer & Sri Chavali, AI Engineer.
Thanks to Hamel Husain and Eugene Yan for reviewing this piece
Evals are becoming the predominant approach for how AI engineers systematically evaluate the quality of the LLM generated outputs. Despite this, teams have wildly different methods for how they are defining their evals – some use strictly boolean, while others use a variation of binary or multi-categorical values, score ranges, explanations, and other techniques.
Are LLMs equally competent at all these approaches? In practice, how useful an eval really is often hinges on getting the format right. This blog dives into best practices based on our testing.
2024 Results
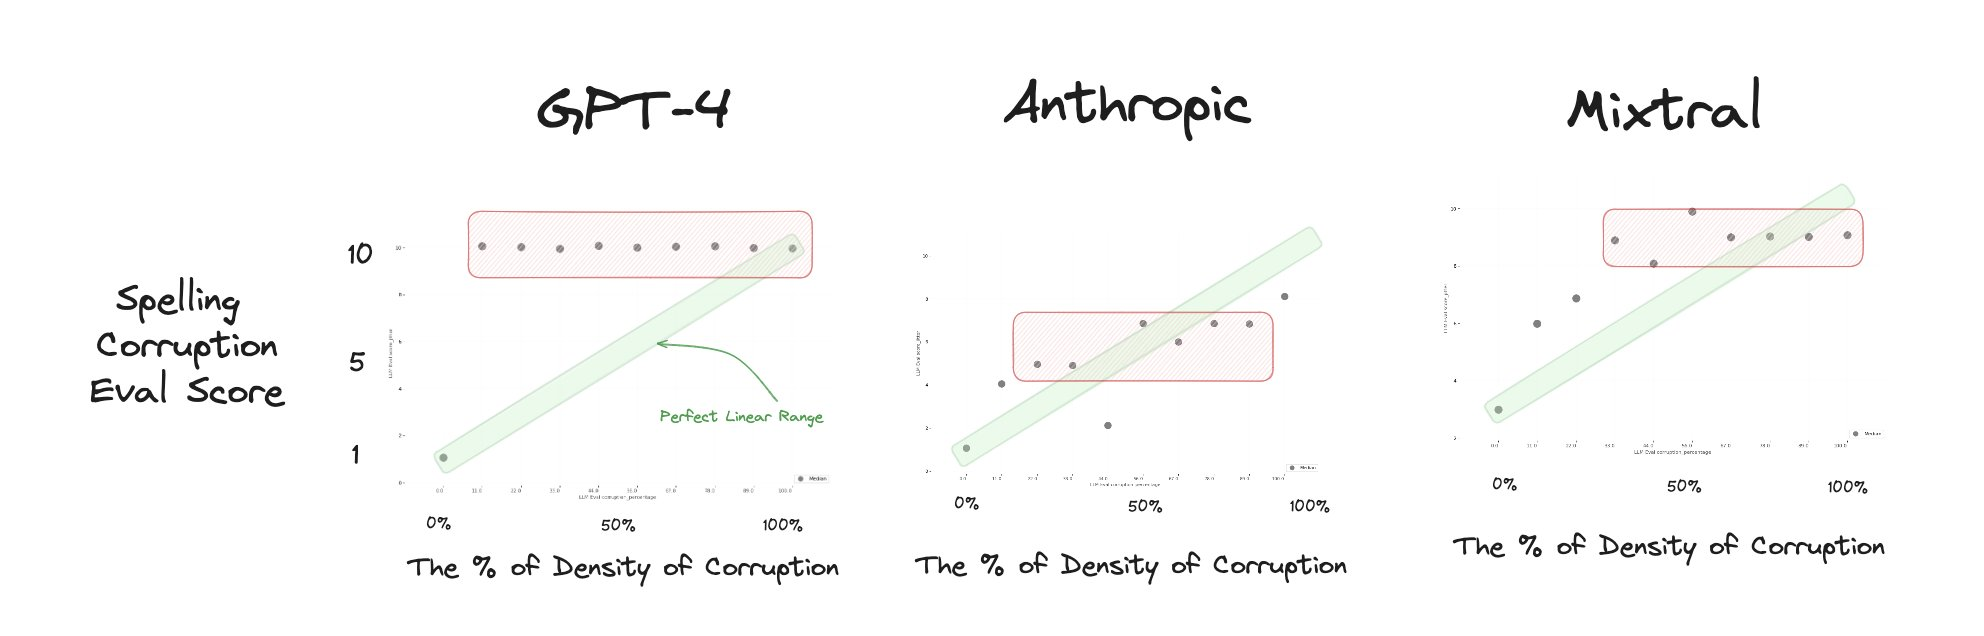
Last year, our tests suggested that score-based evals were not a good or consistent approach compared to binary evals.
Retesting In 2025
Of course, a lot can change in a year as new models come online. To see if our initial conclusion still holds up, this year we repeated the test using newer models from OpenAI, Anthropic, and Mistral, alongside a large OSS model (Qwen). The lineup includes GPT-5-nano, Claude Opus 4, Qwen3-235B, and reasoning-tuned o3.
Test Setup
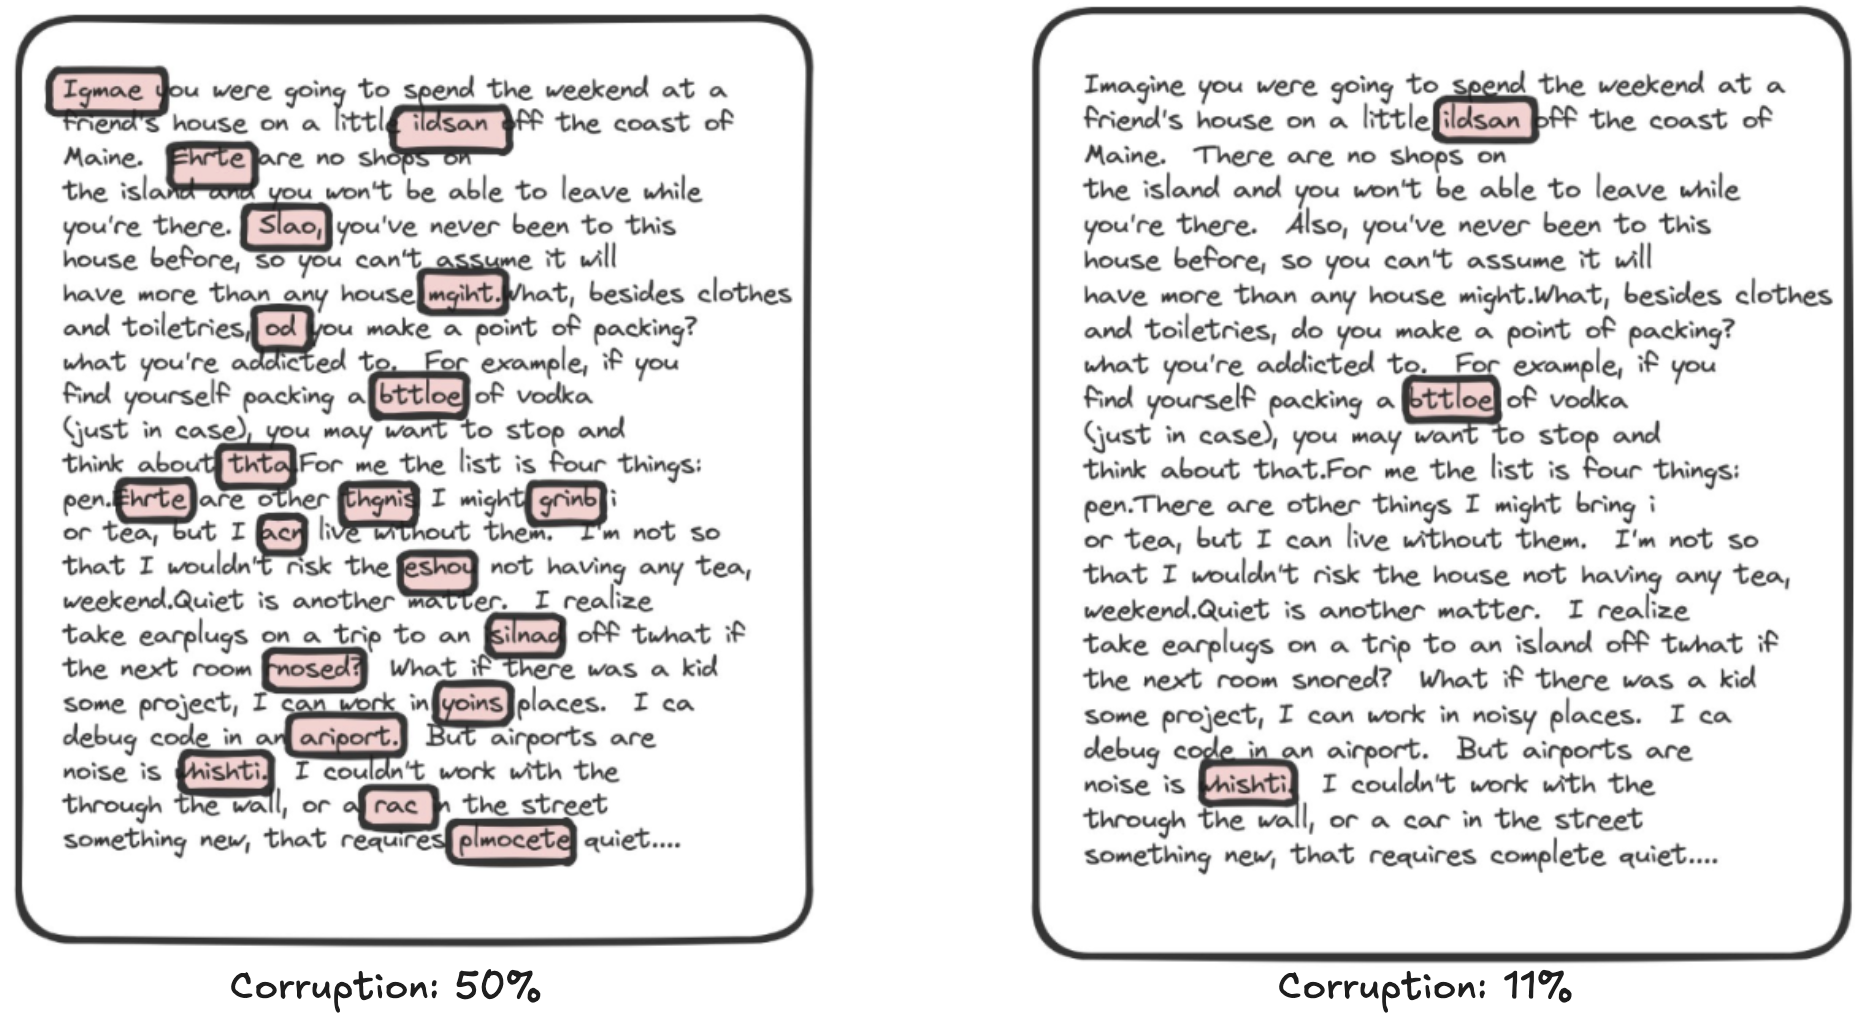
The experiment takes a passage of a text, and adds x% percentage of corruption (i.e. spelling). We then ask the LLM-as-a-judge eval to evaluate what percentage of the text has corruption. The original setup used three numeric ranges — 1 to 10, 0 to 1, and −1 to 1. In this trial, we also added an A to E rubric to see whether letter grades might behave differently.
Each model judges two corruption types: spelling, which adds structural errors like typos, and frustration, which inserts interjections and dismissive phrases (“Ugh,” “Seriously,” “This is ridiculous”) in proportion to the corruption level. These cover both surface-level mistakes and more stylistic degradations, reflecting common failure modes in real LLM outputs.
This is the LLM-as-a-Judge eval template:
SIMPLE_TEMPLATE_SPELLING = """
You are a helpful AI bot that checks for grammatical, spelling and typing errors in a document context. You are going to score the document based on the percent of words that contain grammatical and typing errors. The score should be between {templ_high} and {templ_low}. A {templ_low} score will be no words with grammatical errors, a score of {templ_20_perc} will be 20 percent of words have errors, a {templ_50_perc} score will be 50 percent of words have errors, a score of {templ_70_perc} is 70 percent of words have errors, and a {templ_high} score will be all the words in the context have grammatical errors. The following is the document context.

#CONTEXT
{context}
#ENDCONTEXT

#QUESTION
Please return any score between {templ_high} and  {templ_low}, with the case of {templ_high} being all words have grammatical and spelling errors and {templ_low} being no words have grammatical or spelling errors. You will return no other text or language besides the score. Only return the score. Please return in a format that is 'the score is: [SCORE]'
"""
Results
Frustration
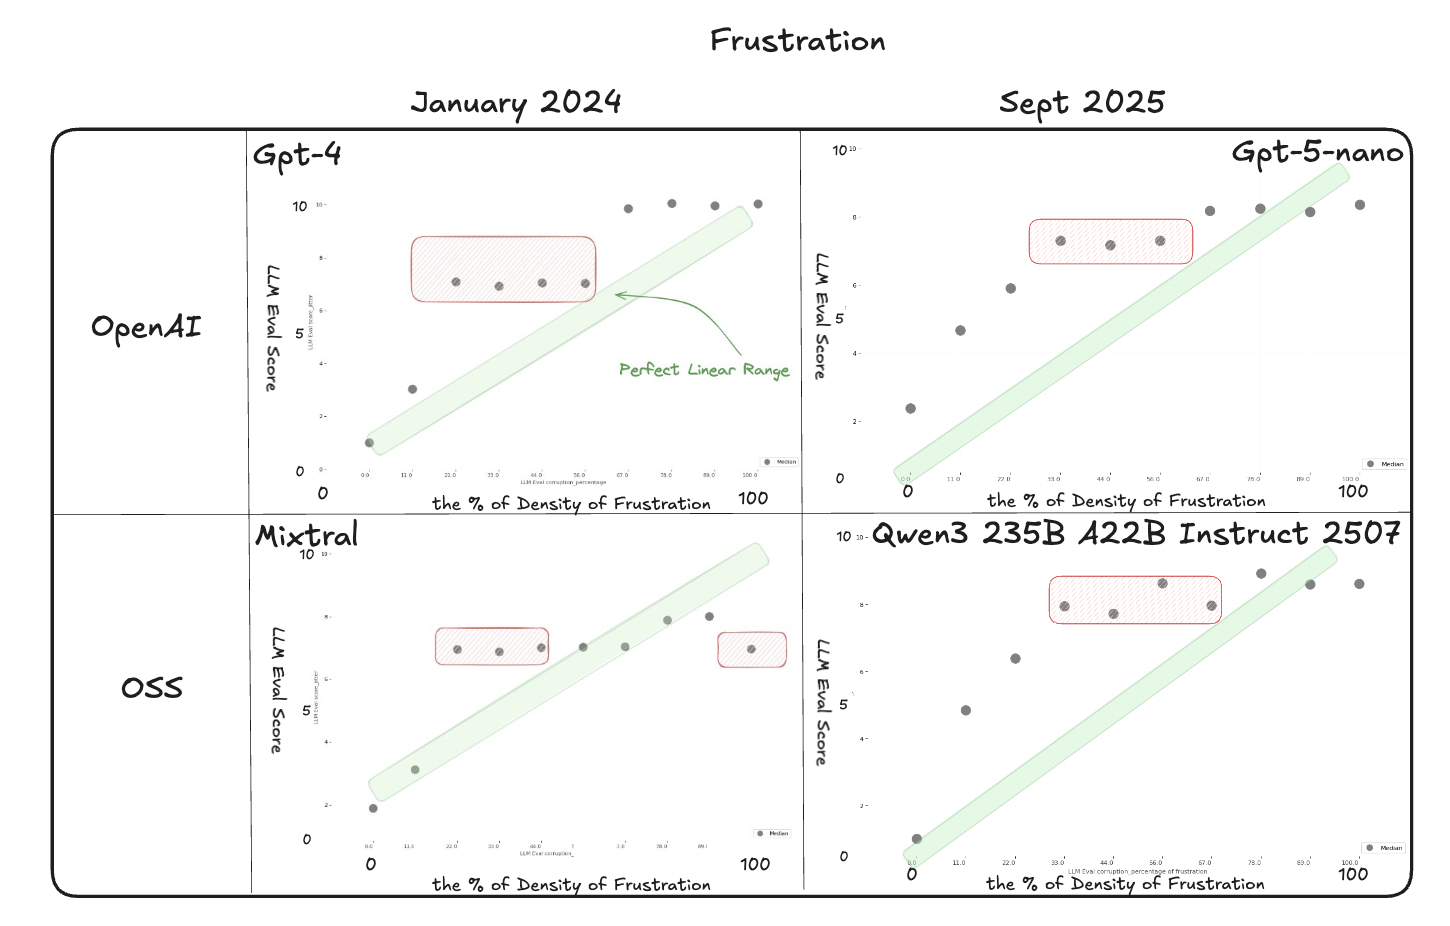
On frustration, the newer judges separate clean passages from mid-range corruption more consistently than the 2024 baselines. GPT-5-nano shows the smoothest progression, with medians that rise steadily and distributions that remain relatively tight across runs. Claude Opus and Qwen3 also follow the expected upward slope, but their spreads are wider and neighboring corruption levels often overlap. Compared to the 2024 Mixtral results, where scores collapsed into broad bands, the 2025 models maintain clearer separation overall.
However, variance and plateaus still appear. This means numeric scoring can flag major differences in quality but stops being reliable once corruption reaches a certain level. The scores are useful for broad distinctions but break down for finer judgments, and this pattern is likely to hold in other applications of numeric scoring.
Single Experiment Results
Distribution of Results across Many Experiments
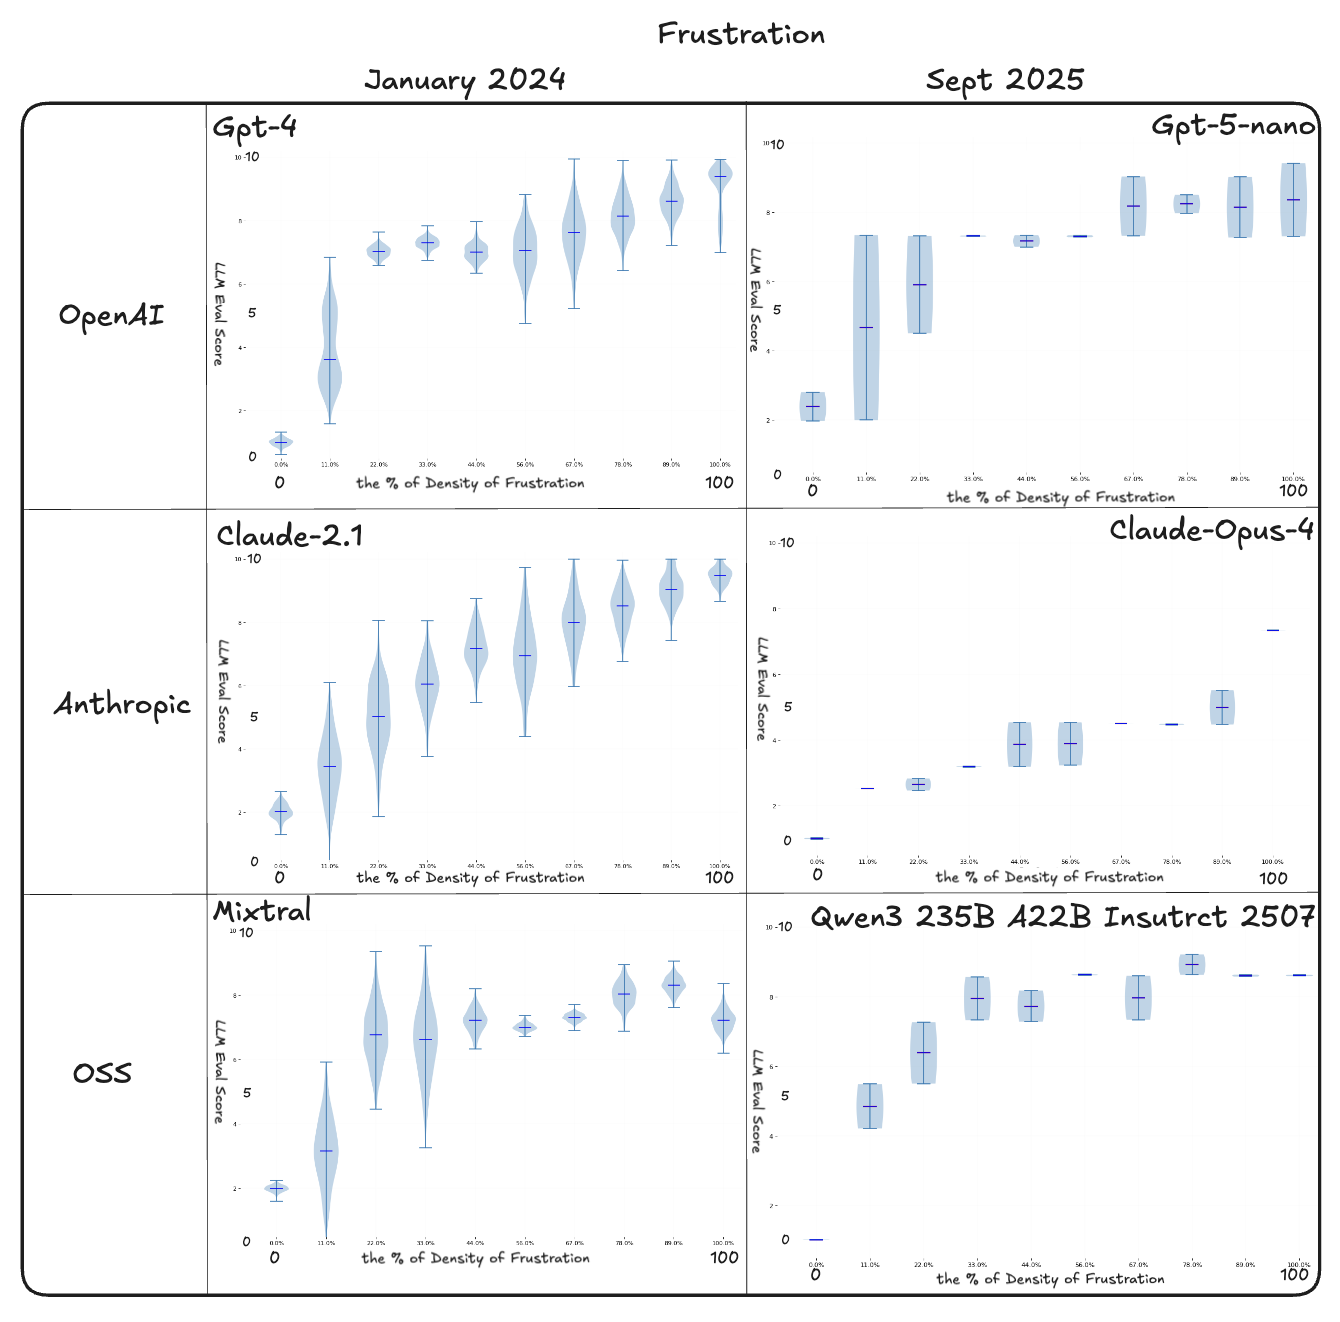
Distribution plots show both the median judgment and the spread across runs, making visible the plateaus, flips, and clustering that single scores conceal.
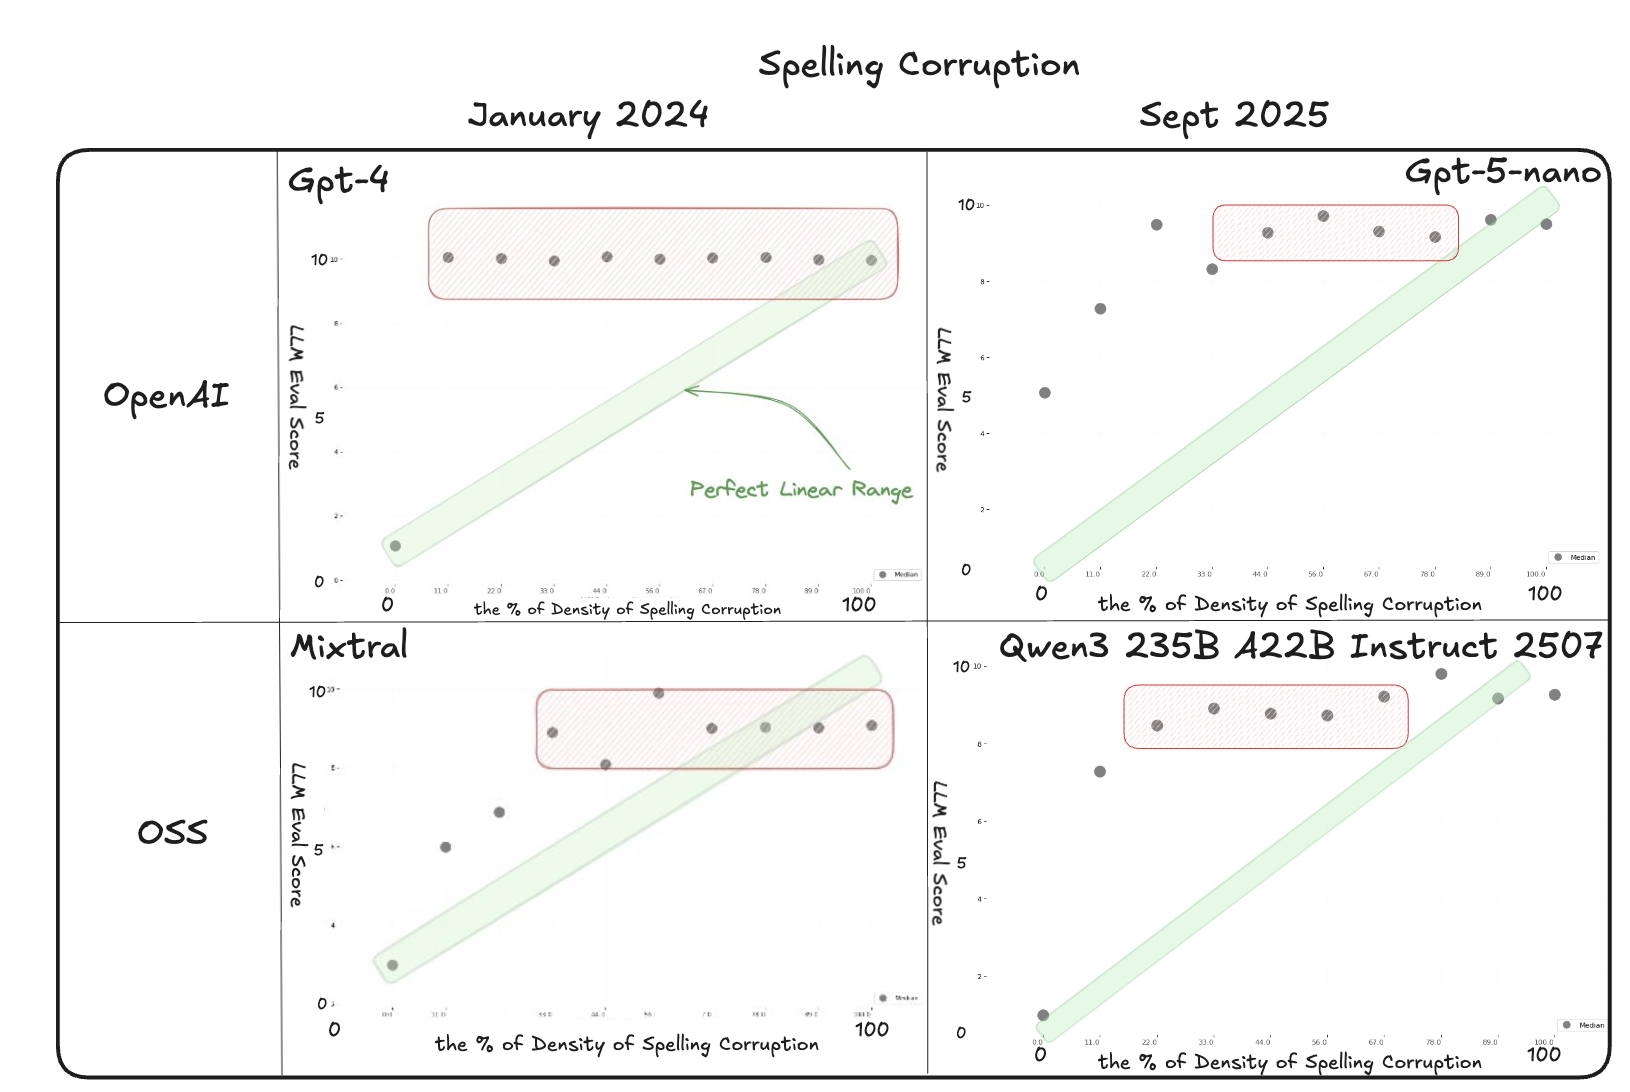
Spelling
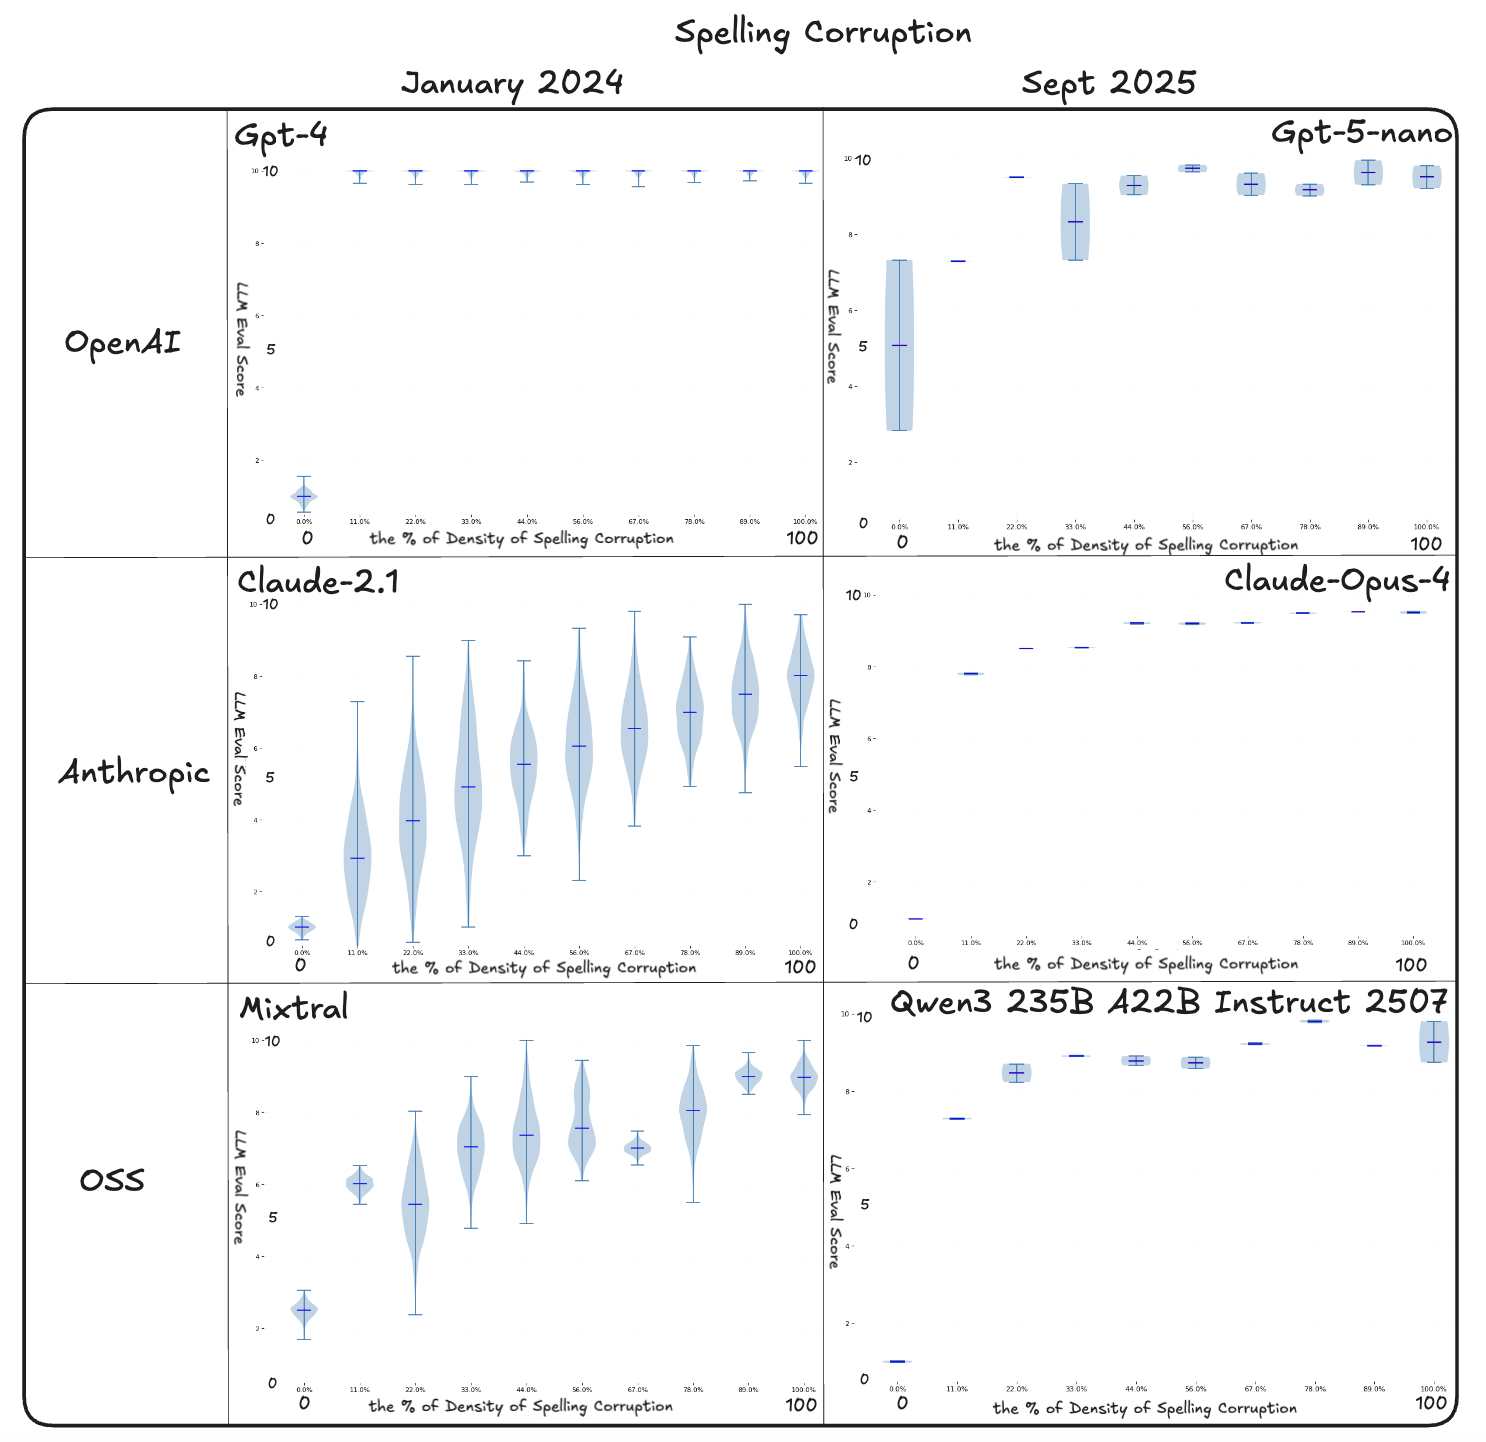
The spelling condition remains the most difficult case. In 2025, GPT-5-nano, Claude Opus, and Qwen3 all plateaued quickly after only a small amount of corruption, with scores saturating and collapsing into narrow bands. The expected correlation between corruption density and score is weak, as the models stop separating light and heavy errors once the distributions flatten. Compared to earlier baselines, the newer judges do not show clear improvements on this condition, indicating that structural spelling errors continue to be challenging for LLM-as-a-judge evaluations.
Single Experiment Results
Distribution of Results across Many Experiments
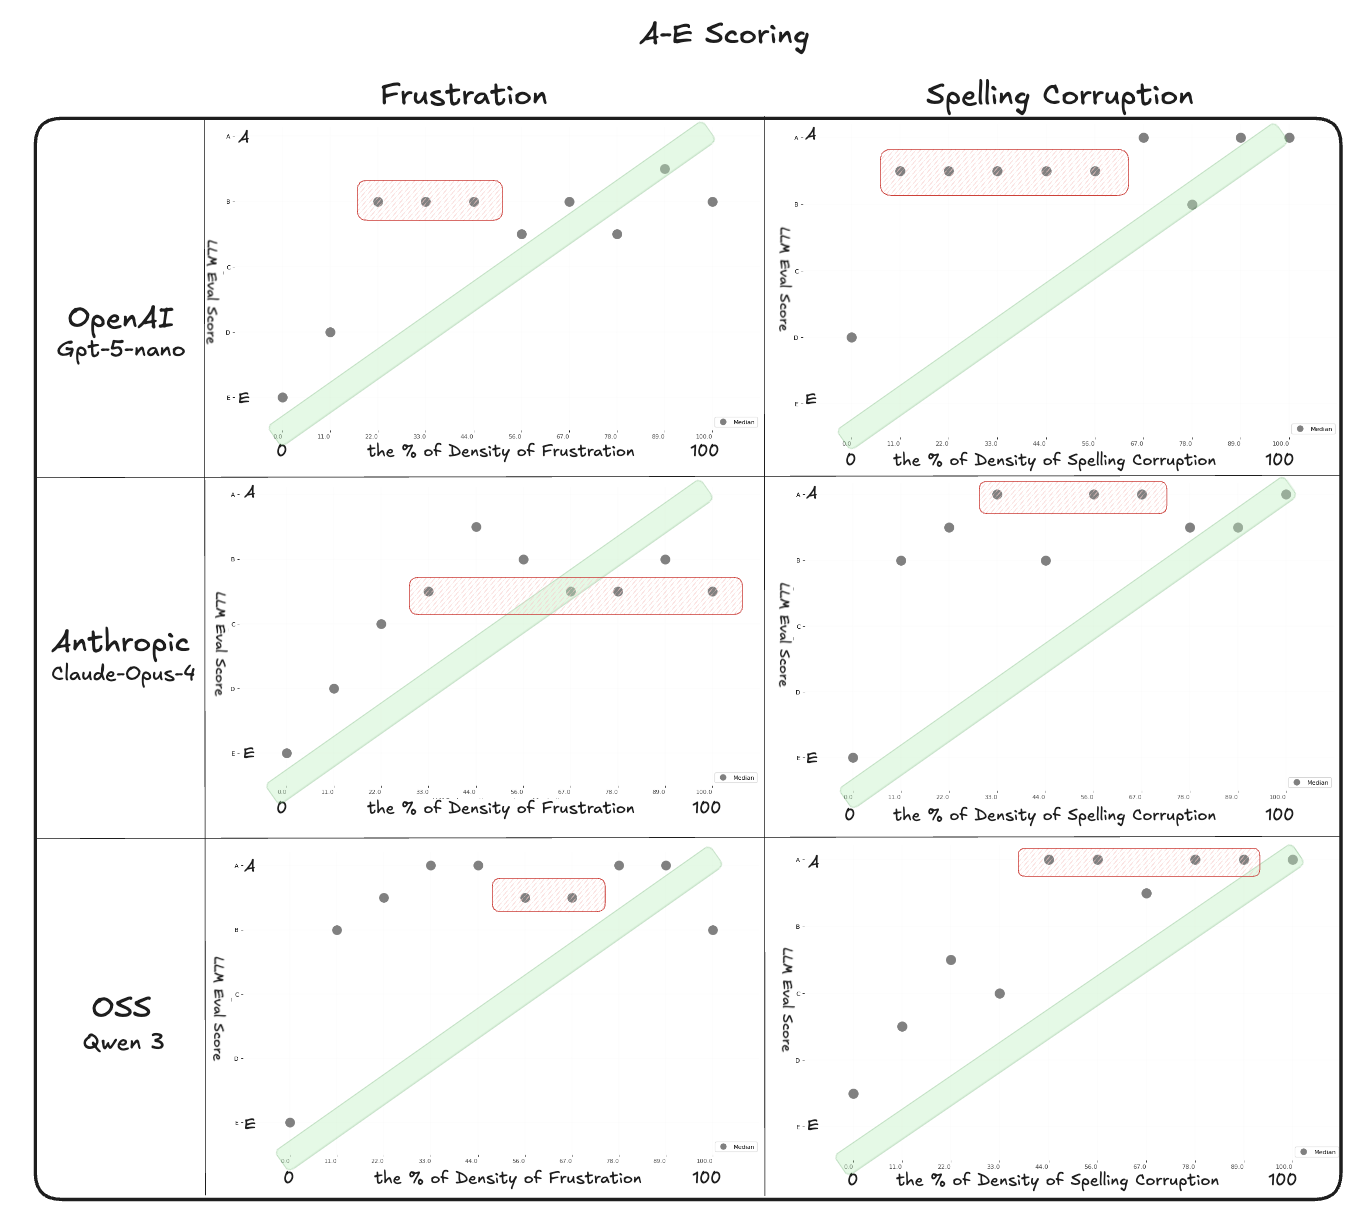
Letter grades as a scoring format – A to E
The A–E rubric narrows variance but removes resolution. In other words, results are more consistent across runs, but much of the subtlety is lost: most passages cluster into A–C, with D and E only appearing at extreme corruption levels. Letter grades function more like categorical labels than calibrated numbers. They are stable across runs but insensitive to finer changes. This pattern recurs across experiments: continuous scales drift or collapse, while categorical or checklist-style judgments preserve distinctions more reliably. Prior evaluation studies report the same effect, showing that discrete rubrics align more closely with human annotations than open numeric scoring.
Numeric ranges shift the appearance of the curves but do not address this instability. On 1–10, gradation appears briefly before flattening; on 0–1, scores push to the extremes; on −1–1, negatives are applied inconsistently. None produce a smooth correlation with corruption density.
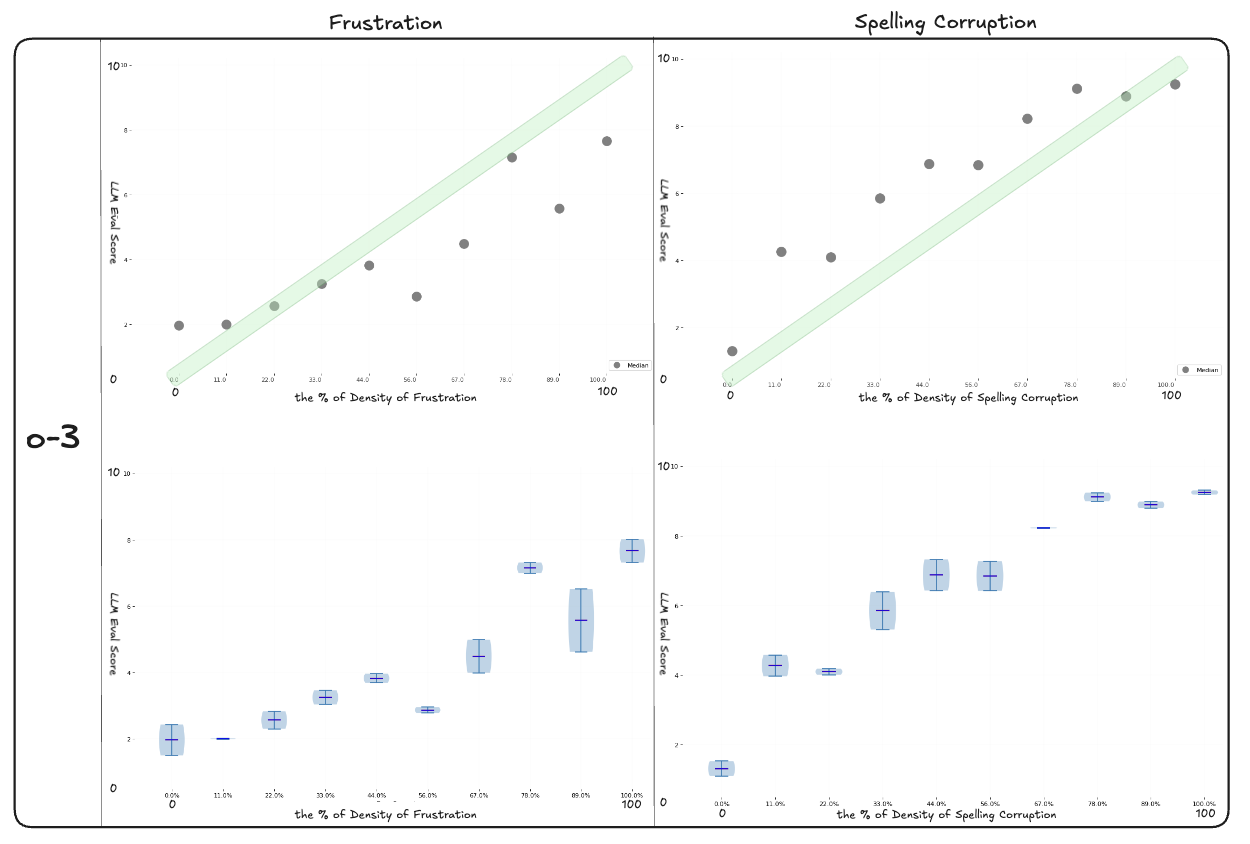
Reasoning Models
How is the performance of reasoning models vs the rest?
Reasoning-optimized judges were not part of the 2024 runs, so we tested them separately to see whether they improve stability compared to the 2025 non-reasoning judges. In this setup, o3 shows tighter distributions and smoother medians on frustration, reducing discontinuities seen in other models. Overlap across neighboring corruption levels remains, and on spelling the same failure mode appears: scores saturate early and collapse into narrow bands.
The improvement comes from lower variance. o3 produces more consistent medians across repeated runs and is less sensitive to prompt or seed changes. However, the instability of continuous numeric scales persists, since outputs remain discrete tokens without calibration. This matches recent work showing that reasoning improves confidence calibration but does not solve the fragility of numeric scoring.
Is the cost of reasoning models worth it?
Reasoning models improve stability but come with higher cost. Across model families, the tradeoff looks different:
- OpenAI: o3 reduces variance and produces smoother medians on frustration compared to GPT-5-nano. The improvement is clear but comes at several times the cost per run.
- Anthropic: Claude Opus 4 performs more consistently than Claude 2.1, but the gains taper off as corruption levels increase. The additional cost is significant, and whether it is justified depends on whether the task requires fine-grained separation or only categorical distinctions.
- Open Source: Qwen3 reasoning variants improve on distribution stability relative to non-reasoning baselines, but the cost gap is narrower than in proprietary families.
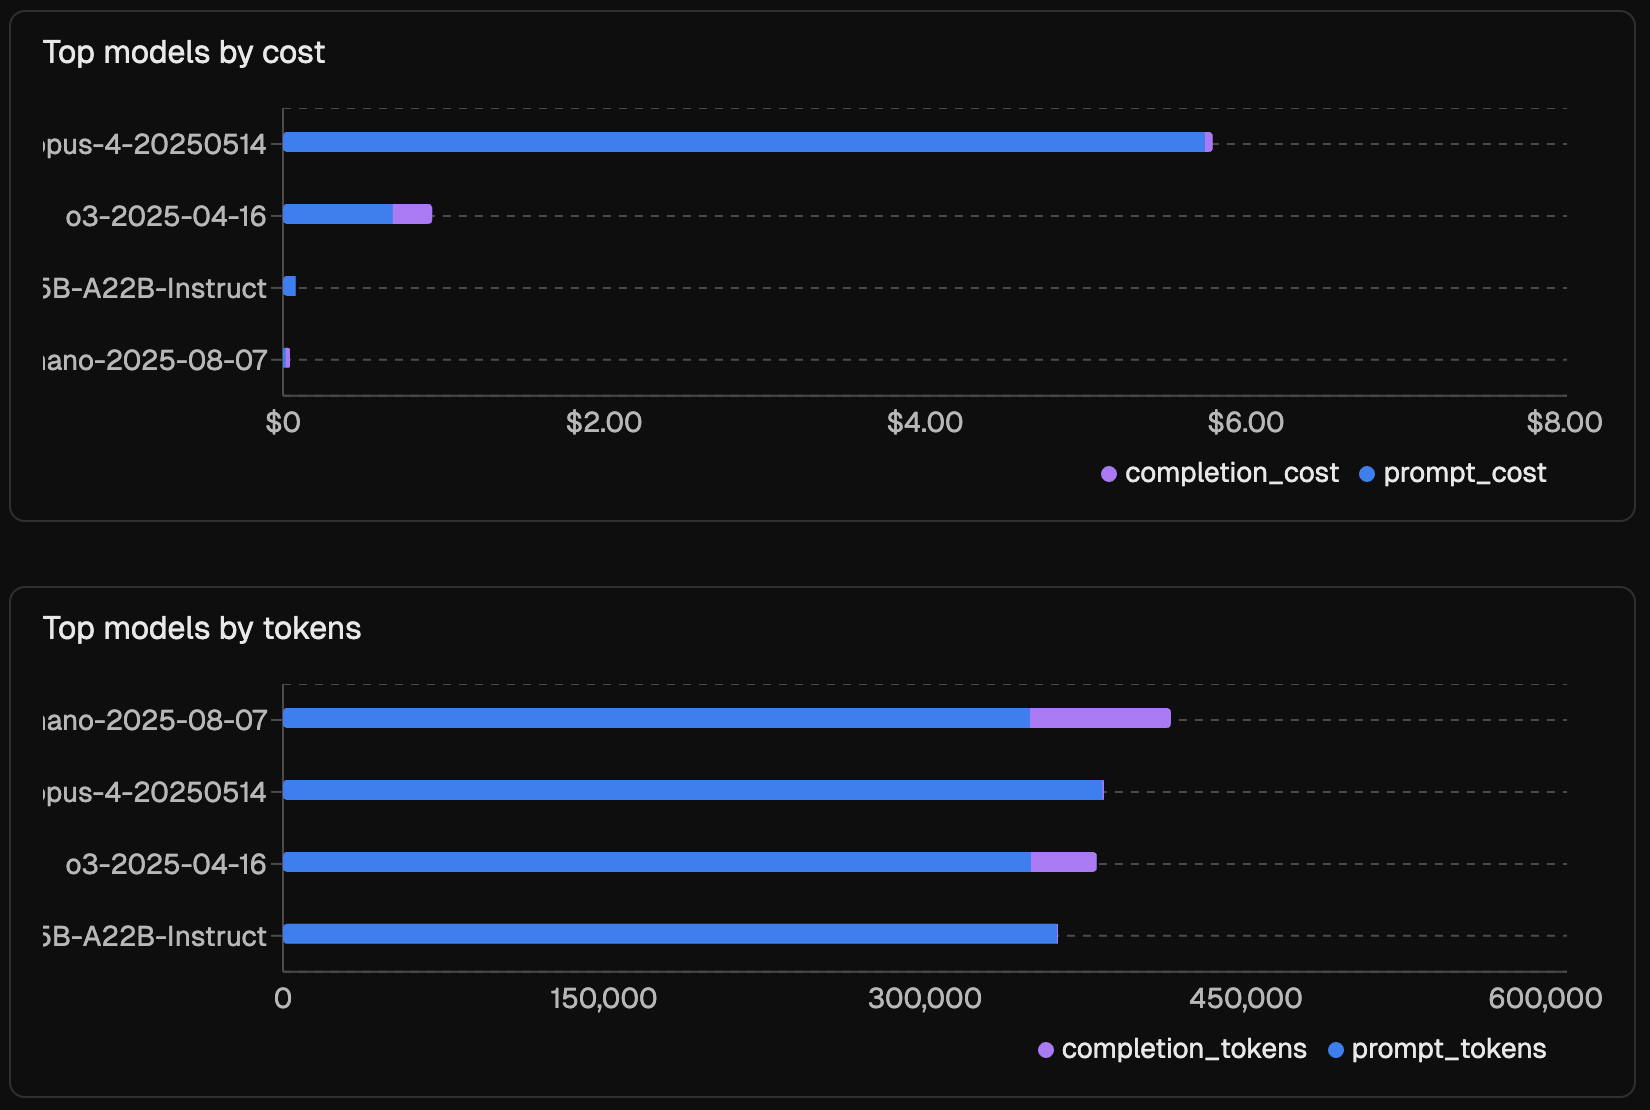
The figure below shows how cost and token usage were distributed across the experiments. Claude Opus 4 accounted for the largest share of total cost, while GPT-5-nano generated the most tokens overall. These patterns highlight that different models dominate either on price or on volume, even before considering their scoring behavior.
Whether reasoning models are “worth it” depends on the use case. For tasks that demand stable numeric judgments, the added spend may be justified. For categorical or checklist-style labels, non-reasoning judges often provide similar signals at lower cost.
Analysis
How consistent is the distribution of score evals?
Consistency depends not only on whether medians move in the expected direction but also on how judges distribute values across repeated runs.
- Disagreement in placement: Evals from different judges are not directly comparable. GPT-5-nano and Claude both produce medians that rise with corruption density, but they differ in scale. The same passage may be scored lower by one judge and higher by another, which makes side-by-side comparisons unreliable.
- Variance within models: Qwen shows smoother median curves, but variance across runs is wide. In spelling, corruption levels collapse into overlapping bands, so light and heavy corruption are not separated cleanly.
- Limits of numeric scoring: These discrepancies show that numeric outputs are fragile without calibration. Scores hold only when fixed to a specific judge configuration; across models or scales they drift, flatten, or reverse.
- Distribution plots make this visible: narrow, separated bands show stability, while wide or saturated bands mark collapse. Plateaus and clustering are most pronounced in spelling, where even light corruption triggers saturation.
Binary vs Multi-Categorical
Binary and multi-categorical judgments avoid many of the collapse patterns seen with numeric scales. Binary labels consistently separate clean from corrupted passages, with low variance across runs and outcomes that reproduce across prompts and models. Multi-categorical rubrics such as A–E reduce variance as well, but they collapse fine distinctions into broad bands. This creates stability while limiting sensitivity to incremental corruption.
Across experiments, both formats preserve distinctions that numeric scores tend to erase. Binary judgments are the most stable, while multi-categorical rubrics provide a middle ground: more gradation than binary but less consistency. Distribution plots confirm this pattern, showing that discrete judgments follow the corruption gradient more reliably than continuous numeric ranges.
Takeaways
LLM-based evaluation faces a tradeoff between stability and resolution. Numeric scores can provide fine granularity but drift with prompt wording, model choice, and configuration, making comparisons unreliable. Our corruption tests confirm this fragility: scores bunch, flip, or collapse when scales or prompts change.
Binary and categorical judgments, such as the A–E rubric, are more stable. They align better with human annotation, reproduce across runs, and make error tracing easier. Letter grades reduce variance but act as categorical bins rather than calibrated ranges.
In practice, discrete labels generalize more broadly, while numeric scores are only useful in tightly controlled and calibrated contexts.
We have open-sourced the testing code. Run ScoreEvalsTest.py to reproduce the experiments and phoenix serve to trace cost, latency, and token use.
Appendix
Related Works & Ongoing research
Recent studies of numeric reasoning show that even advanced models like OpenAI’s o3 and Deepseek’s R1 improve on accuracy but still leave clear gaps. Architecture, training data, tokenization, and training paradigms are likely sources of these limits.
In evaluation settings, categorical rubrics and checklist-based criteria align more consistently with human annotation than open numeric ranges. Even strong models such as o3-mini and GPT-4o show clustering and inconsistent jumps when mapped to continuous scales, reinforcing evidence that discrete checklists or verbal criteria produce outputs that are easier to interpret and compare.
More Details On How Our Test Was Built & Details On How To Replicate
The test starts with long, consistent passages that are systematically corrupted at fixed percentages. Frustration injects affective qualifiers while preserving syntax, and spelling introduces character- and token-level errors. This controlled gradient makes it possible to attribute score shifts to judge behavior rather than input variability.
To replicate, run ScoreEvalsTest.py to generate samples and collect judgments, and use phoenix serve to trace cost, latency, and token use. Results are aggregated across seeds into distributions and medians. Distribution plots matter here: they expose variance, plateaus, and clustering that single scores conceal.
Extensions include adding new corruption types such as semantic drift or discourse-level noise, and refining evaluation templates with calibration steps or ordinal anchors. These adjustments could reduce variance and reveal whether instability reflects the model itself or the scoring setup.