

The shift from simple chat interfaces to autonomous agents has broken the traditional monitoring stack. Agentic systems fail in ways that look like success: incorrect but well-formed outputs, unnecessary tool calls, or actions that are syntactically valid but semantically wrong.
In this blog, we are looking at some of the best AI observability tools available to secure these production reasoning loops. We cover a spectrum of needs, from rapid prototyping with proxies to deep orchestration tracing for multi-agent pipelines and scaled enterprise deployments.
Agent Observability and the Architecture of Trust
You cannot fix AI failures with standard logs because the error lives in the reasoning and not necessarily in the code execution. This mismatch creates a massive operational risk for engineering teams used to systems built for repeatability and a need for AI observability and tracing. Given the same input, agents introduce a layer of variability that traditional software cannot handle.
Identifying common AI agent failures requires moving beyond basic logging. Without a way to track these conversations, your agents are just API calls in the air. To extract fundamental business value, you must treat agent traces as durable business assets.
The missing link is rarely model quality or the orchestration framework – the missing link is visibility. We focus on a “glass box” approach using distinct, interoperable tools to trace and govern agents at scale.
Effective systems now rely on top AI prompt management tools to maintain version control. Establishing a rigorous agent evaluation framework is the only way to build the architecture of trust.
Understanding AI Observability in the Age of LLMs
To understand where observability fits, we must look at how the stack has evolved. In the DevOps era, we monitored server health. In the MLOps era, we monitored model drift and training loss. In the Agent Era, we monitor decisions. Understanding What is Observability? in this context means capturing the probabilistic “chain of thought” that drives an action.
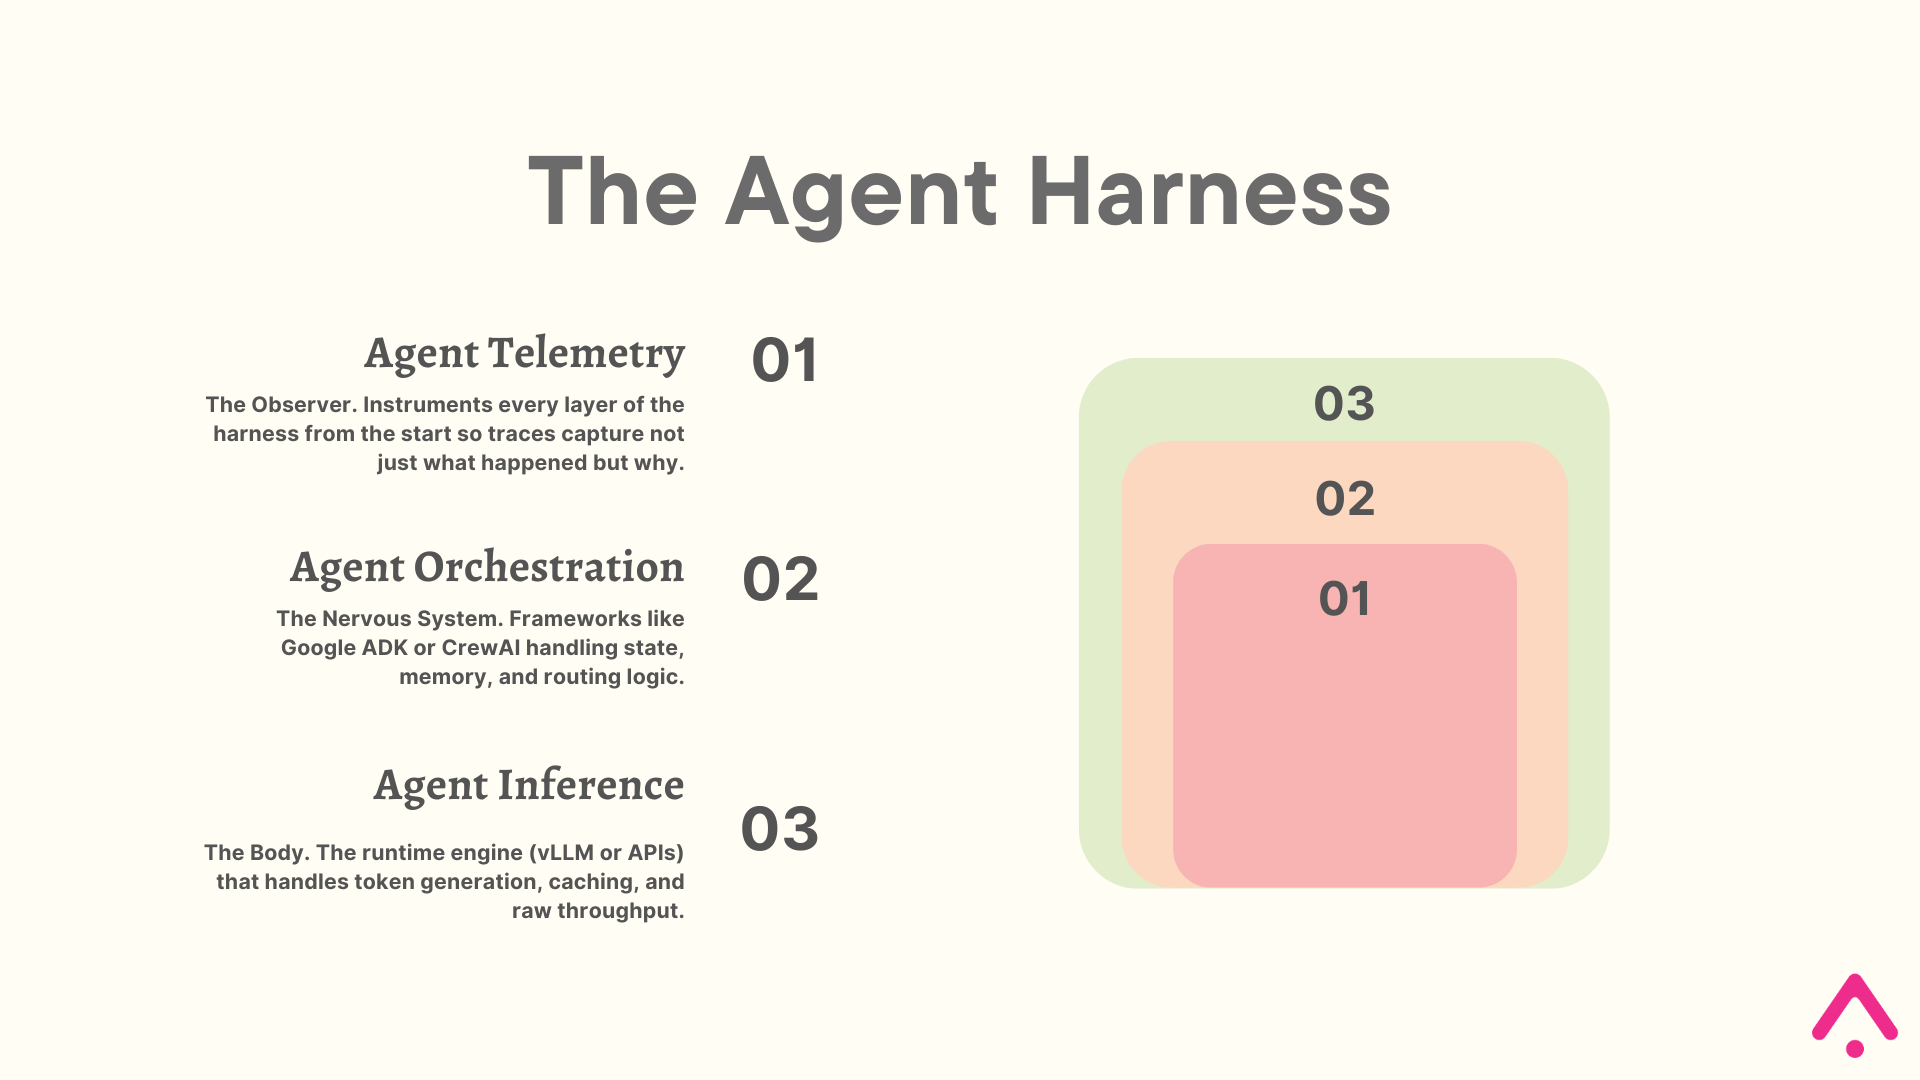
For teams building on top of model APIs, which is most of us, the foundation of a reliable agent system is not the model itself. It is the agent harness: the orchestration logic, runtime, and telemetry that wraps around the model and governs how it operates. As Anthropic’s engineering team has documented, even a frontier model running in a bare loop will fall short of production quality without structure. The harness imposes that discipline.
This reframes how you should think about your production stack. Observability is not something you wire in after the system is built. It must instrument every component from day one:
- Agent Telemetry: This is the observability layer, but calling it a layer undersells it. As Arize’s own research has documented, traces are the source of truth for what an agentic system actually does, as opposed to what the code says it should do. Every operation developers traditionally performed on code, including debugging, testing, optimizing, and monitoring, must now be performed on traces.
- Agent Orchestration: This is where behavior is defined. AI agent frameworks like Google ADK or CrewAI handle the state machine, memory persistence, and routing logic. Telemetry embedded here captures why a decision was made before a single token is generated.
- Agent Inference: This is the execution engine that powers the agent. Inference layers like vLLM or provider APIs handle throughput and caching. Without instrumentation at this layer, you cannot distinguish a fast agent from a correct one.
Without telemetry wired into the full harness, you are running a black box. You might know your agent costs $50 a day, but you and your stakeholders do not know if it is solving problems or apologizing in expensive loops. Using an AI agent evaluation framework is not an afterthought. It is the mechanism by which the system verifies its own behavior and improves over time.
What to Look For in an AI Agent Observability Tool
Selecting a tool for autonomous systems requires a shift from monitoring metrics to monitoring logic. If a platform treats an agent like a simple chatbot, it will fail to capture the branching paths of a multi-step reasoning loop. You need a system that prioritizes trace-level LLM evaluations to verify end-to-end reliability.
One often-overlooked capability is context graph management: how platforms treat and store your agent traces as long-term business assets rather than ephemeral debug logs.
A context graph is simply the persistent record of why your agent made each decision. It does that by recording the reasoning it considered, the context it retrieved, the tools it called, and the outcome.
Most platforms let this data disappear after debugging. The best platforms retain it, make it queryable, and enable feedback loops where past decisions inform future behavior. This distinction of whether traces become durable assets or vanish can directly impact your ability to improve agents over time.
| Capability | What to Consider |
|---|---|
| Agent Decision Graph | Visualizes the internal state machine showing how agents, tools, and components interact step-by-step. Makes debugging agent loops 10x faster than reading raw logs. |
| Context Graph Ownership | Determines whether your traces become durable business assets or ephemeral telemetry. Ask: Will you own the data in your own warehouse, or does the platform own the queryable context graph? This choice affects long-term autonomy and feedback loop effectiveness. |
| Session-Level Evaluations | Measures coherence and goal achievement across full multi-turn conversations, not just isolated responses. Essential for understanding actual user experience. |
| Natural Language Search | Find specific failure patterns across millions of traces using queries like “agent hallucinated tool arguments” instead of writing complex SQL. Turns weeks of investigation into minutes. |
| Trajectory Mapping | Automatically detects inefficient patterns: recursive loops, repeated failures, wasted tokens. Directly impacts costs and user experience. |
| MCP Tracing | Debug Model Context Protocol tools directly in your IDE. Bridges the gap between development and production observability. |
| Regression Suite Builder | Promote production failures to versioned test datasets with one click. Ensures the same failure never happens twice. |
| OpenTelemetry Support | Standardizes telemetry collection and prevents vendor lock-in. Your data remains portable as the ecosystem evolves. |
Establishing this criteria ensures your stack is built for the complexity of the “Agent Era” rather than the simpler “Chatbot Era.” By prioritizing these few principles, you move to a proactive improvement cycle that turns every production trace into a learning opportunity for your system.
The critical question when evaluating any platform: Does it own the context graph, or do you? Arize AX differentiates by retaining context graphs within ADB (Arize Database), an AI native datastore that unifies observability and evaluation data in open formats, enabling zero-copy access across your AI and data stack. This enables real-time cross-trace analysis without the cost and latency of re-warehousing.
Top AI Agent Observability Tools for Production
Every tool in this list is built on one of two architectural patterns and that distinction should be the first filter you apply before evaluating anything else. Proxy-based tools sit between your application and your model provider. You redirect your API calls through their gateway and observability happens automatically with zero instrumentation overhead.
SDK-based tools instrument your code directly. There is no middleman, which means deeper visibility into your agent’s reasoning and no single point of failure if the observability backend goes down. We have tagged every tool below with its architecture type so you can filter immediately.
| Tool | Best For | Primary Value |
|---|---|---|
| OpenTelemetry | Experiments | Provides a vendor-neutral foundation. Use this to ensure your data remains portable during the R&D phase. |
| Arize AX | Enterprise Growth | Teams who need deep control over their product. Ideal for large-scale production with massive trace volumes. |
| Braintrust | Eval-First Engineering | Engineers who prioritize testing. Best for teams with emphasis on prompt engineering as a software development lifecycle. |
| LangSmith | LangChain Ecosystems | Teams already using LangChain for orchestration. Trace collection, session replay, and custom evaluators come pre-wired to LangChain components. |
| LangFuse | Early-Stage Prototyping | Developer-friendly open-source platform for teams getting started. Best suited to prototyping and small-scale deployments. |
| Portkey | Provider Reliability | Systems that require high uptime through automatic fallbacks and load balancing across multiple LLM providers. Note: introduces a single point of failure and centralized key storage risk. |
| Galileo | AI Logic and Safety | Teams focused on hallucination detection and RAG optimization using specialized Luna-2 models. |
| AgentOps | Agent Orchestration | Developers using multi-agent frameworks like CrewAI. Best for tracking recursive loops and thought processes. |
1. OpenTelemetry
SDK Instrumentation
OpenTelemetry is the CNCF standard for distributed tracing that provides vendor-neutral instrumentation. It standardizes how telemetry data gets collected and exported without locking you into any specific backend.
The key contribution is semantic conventions for LLM spans. These define exactly how to capture prompts, completions, token counts, and model parameters in a way every observability platform accepts. Without this, each vendor builds their own schema, and migration becomes a rewrite instead of a config change.
OTel serves as the foundation for more specialized telemetry libraries. Projects like OpenInference, built by Arize AI, extend the base specification with AI-specific semantics, but the core value remains the same: portable instrumentation that works across backends.
OTel itself only handles collections but does not analyze, evaluate, or visualize anything. You instrument your code, point traces at a collector, and send data to any compatible backend like Datadog, Grafana, Arize, or your own database.
2. Arize AX
Arize AX is an enterprise observability platform built on the Arize Phoenix open-source foundation. Standardizing on OpenInference, it removes the burden of proprietary instrumentation, allowing engineers to focus on improving agent reasoning rather than debugging data pipelines.
The core value is making agent behavior visible at the decision level. When an agent fails, the Agent Graph visualization shows exactly which step broke and why. This graph is an execution tree rather than a linear trace, showing how agents delegated to sub-agents, which tools fired, and where the state changed. This works automatically across a wide range of AI agent frameworks.
Because it instruments your code directly via SDK, your agents continue functioning even during an observability backend outage. You get decision-level visibility with no middleman introducing latency or failure risk.
What sets Arize apart is Data Fabric, powered by ADB. While most observability platforms export traces to external warehouses for long-term storage, ADB keeps context graphs within the platform itself. Every trace, evaluation, and annotation syncs to your cloud warehouse in Iceberg format every 60 minutes, but the backend OLAP database runs on ADB, built specifically for billions of agent traces.
This architecture eliminates the re-warehousing tax: instead of periodically re-indexing historical traces to answer new questions, teams query context graphs in real-time. Over months of operation, these compounds significantly in cost and analysis latency. The trade-off is vendor coupling: you gain query speed but sacrifice data portability. For mission-critical agent systems, this is often the right choice.
Evaluation happens at both the trace and session levels. Session-level evals measure coherence across multi-turn conversations, answering questions like “did the agent maintain context” and “did it complete the user’s goal”. While trace-level evals pinpoint individual reasoning failures.
Alyx is the AI assistant built directly into the platform. It handles trace analysis, eval building, and debugging through natural language. Alyx connects via Model Context Protocol, so you can instrument and debug agents from Cursor, Claude Code, or other IDEs without context switching. The MCP Tracing Assistant unifies client-server traces in the same hierarchy, which matters when agents call external MCP tools.
3. Braintrust
Braintrust is an evaluation-first observability platform that merges testing directly with production monitoring. It treats prompts as versioned objects to eliminate the typical trial-and-error cycle of engineering. The system relies on Brainstore, an OLAP database purpose-built for AI interactions.
The platform includes Loop, an AI assistant that analyzes production data to automate the hardest parts of observability. Loop generates custom scorers from natural language descriptions and applies them to live traffic to catch hallucinations.
SDK-based instrumentation means traces are captured within your own infrastructure. No proxy means no credential exposure and no single point of failure between your application and your model provider.
Beyond technical metrics like latency, teams use Loop to query logs for product roadmap decisions by identifying common failure patterns in user requests. This shifts the focus from simple uptime to the actual quality of the reasoning paths.
Developer experience is central to the Braintrust workflow through native SDK support for Java, Go, Ruby, and C#. This expansion allows enterprise teams to instrument their existing production stacks using OpenTelemetry standards. It handles automatic caching and trace logging at the gateway level, which reduces both costs and implementation complexity.
4. LangSmith
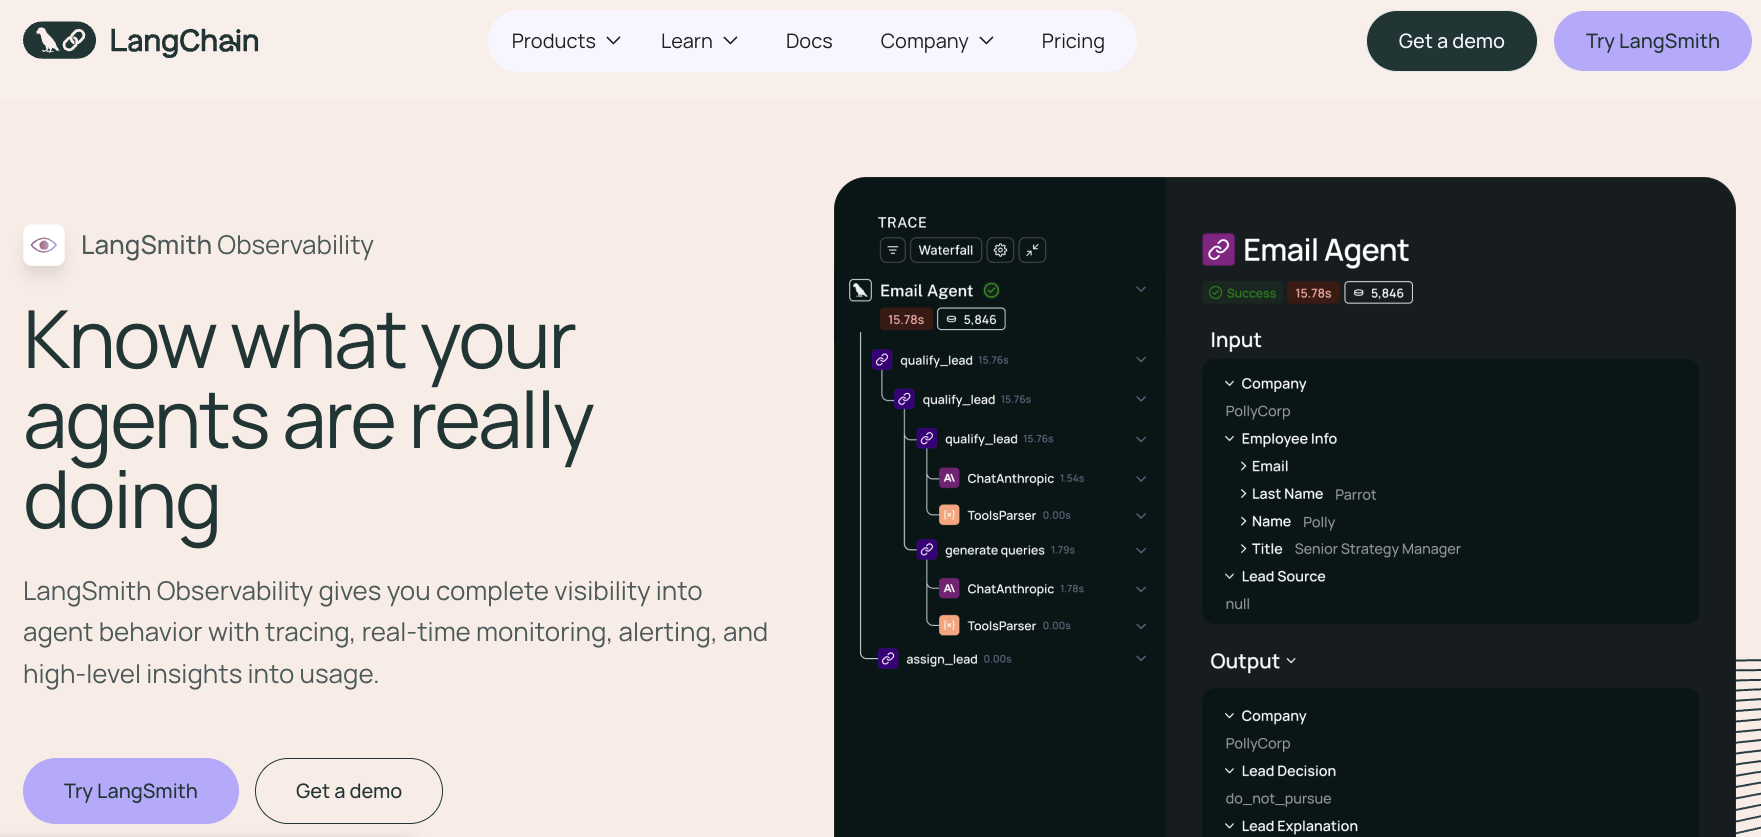
LangSmith is LangChain’s native observability platform. It provides trace collection, session replay, and evaluation capabilities optimized for teams already using LangChain for orchestration.
SDK instrumentation but the architecture advantage is limited here. The observability is so deeply coupled to the LangChain stack that you are effectively locked in. Migrating to a different orchestration framework means re-instrumenting your entire observability layer from scratch, which is a similar kind of lock-in to what proxy-based tools create, just at the framework level rather than the network level.
The platform excels at rapid debugging through its execution timeline view, which shows the exact sequence of LLM calls, tool invocations, and state changes. Custom evaluators allow you to score agent outputs against your specific criteria using either deterministic logic or LLM-based grading.
LangSmith’s strength lies in frictionless integration; teams using LangChain agents get observability with minimal additional setup. The platform supports automatic tracing for LangChain components, reducing instrumentation overhead.
For teams prioritizing ecosystem fit over platform independence, LangSmith removes context switching between orchestration and monitoring. The primary trade-off is vendor coupling. Deep integration with LangChain means migrating to a different orchestration framework would require re-instrumenting your observability layer.
Teams report this as a key concern in adoption, given LangChain is a vast library that has its core value derived from something for everything rather than a more focused “everything for something” approach.
5. LangFuse
Langfuse is an open-source observability platform emphasizing developer experience and debugging UX. It provides trace collection, session management, and prompt versioning in an accessible interface.
The platform’s strength is its approachability for early-stage teams. Features like prompt management, user session tracking, and cost attribution work out-of-the-box with minimal configuration. Native SDKs for JavaScript, Python, and other languages make integration straightforward
Primarily SDK-based, however, Langfuse’s recent acquisition by Clickhouse (Jan 2026) introduces uncertainty into the platform’s future trajectory. The acquisition is shifting their architecture toward a hybrid model. Teams with strict data residency requirements should clarify exactly where traces are routed before committing.
Teams considering Langfuse for production deployments should carefully review current feature roadmaps and clarify support commitments before committing to long-term usage. The integration with Clickhouse’s OLAP infrastructure may eventually provide advantages for large-scale analytics, but this remains unproven.
For prototyping and small-scale deployments, Langfuse remains a solid choice. For mission-critical production systems, the acquisition introduces enough uncertainty that evaluating alternatives is prudent.
6. Portkey
Portkey is an AI Gateway and observability suite built specifically for production reliability. While it offers a proxy-based integration similar to Helicone, it functions more as an intelligent routing layer than a passive logger. By changing your API base URL to Portkey, you gain access to an AI Gateway that manages interactions with various LLM providers.
The technical mechanism involves a “Control Panel” approach where Portkey acts as a programmable middleman. When you send a request, integrate it by changing your baseURL to the Portkey endpoint and passing your Portkey API key in the request headers. This simple switch provides immediate, token-level observability across cost, performance, and accuracy metrics without needing to refactor your core logic for different model schemas.
The proxy model creates a critical single point of failure and a concentrated security risk. If the Portkey gateway goes down, your entire agent fleet loses connectivity to every model provider simultaneously. Storing sensitive API keys in a Virtual Vault enables features like automatic fallbacks, but it also creates a massive target for attackers.
This risk is concrete. In version 1.14.0 Portkey had to patch CVE-2025-66405, a Server-Side Request Forgery vulnerability where attackers used custom host headers to trick the gateway into hitting internal network resources. Teams must use strict egress filtering to prevent a compromised gateway from scanning their private infrastructure.
Beyond security, Portkey provides a Prompt Library to decouple prompt engineering from application code. When combined with their reliability suite, the platform turns raw observability into an active governance system for production AI.
7. Galileo AI
Galileo AI has shifted from simple hallucination detection to an evaluation intelligence platform. The system is built on Luna – 2 foundation models released in early 2026.
SDK instrumentation with evaluation logic running inside the platform rather than between your application and your model provider, meaning no added latency on inference calls.
The flagship release from Galileo is Galileo Signals. This engine automates failure mode analysis by scanning millions of production traces. It identifies why agents drift and prescribes specific fixes for prompt engineering or retrieval strategies. The system works with an updated Agent Graph that includes traffic analytics. These visuals show the most frequently used paths in a multi – agent reasoning loop.
Developer experience now centers on the Agent Evals MCP. This protocol allows engineers to run production-grade evaluations inside Cursor or Claude Code. For enterprise governance, the platform supports “Composite Metrics.” These metrics combine multiple scores into a single threshold for automated gatekeeping. If an agent’s score drops, the system kills the session or flags a human before the LLM generates a response.
8. AgentOps
AgentOps is a governance and observability platform built for autonomous agents and multi-step reasoning chains. It tracks the entire lifecycle of an agent from initialization to task completion rather than just logging individual requests. It provides dedicated tracking for tool usage, self-correction loops, and planning stages. You integrate it using a single decorator that wraps your existing agents.
AgentOps is an SDK-based observability architecture with a single decorator integration that runs entirely within your own infrastructure, keeping credential exposure risk inside your own security perimeter. It provides PII redaction and audit trails for compliance.
The session replay dashboard provides “time-travel” capabilities to rewind an agent’s execution. It pinpoints exactly where a reasoning path diverged from the goal. The platform identifies recursive thought patterns to prevent agents from burning tokens in infinite loops. It triggers alerts or pauses when a cycle is detected.
The Human-in-the-Loop (HITL) module allows an agent to pause execution. It requests human approval for high-stakes tool calls like processing payments or deleting files.
Choosing the Right AI Observability Tool
Selecting a stack depends on your tolerance for architectural risk and your engineering capacity. There is no “best” tool, only the right trade-offs for your specific deployment stage. The primary architectural decision is whether you want a “Man-in-the-Middle” proxy or native SDK instrumentation.
The proxy model creates a critical single point of failure and a concentrated security risk. If the Portkey gateway goes down, your entire agent fleet loses connectivity to every model provider simultaneously. Storing sensitive API keys in a Virtual Vault enables features like automatic fallbacks, but it also creates a massive target for attackers.
A breach of this vault or the gateway exposes your spending power and data across all configured AI services. This risk is concrete, in version 1.14.0 Portkey had to patch CVE-2025-66405. This was a Server-Side Request Forgery (SSRF) vulnerability where attackers used custom host headers to trick the gateway into hitting internal network resources. Teams must use strict egress filtering to prevent a compromised gateway from scanning their private infrastructure.
Choose an SDK for mission-critical agents where security and deep reasoning visibility are non-negotiable. SDKs like Arize AX or Braintrust give you “decision-level” visibility. They show exactly how an agent’s internal state changed between tool calls. Because there is no middleman, your application remains resilient. Even if the observability backend has an outage, your agent continues to function.
Before committing to a vendor, I leave you with four questions:
Does our security policy allow third-party proxies to handle raw PII and API keys?
Do we need to trace complex, multi-step agent reasoning or just log simple prompt-response pairs?
What happens to our user experience if the observability layer adds 100ms of latency or suffers a 10-minute outage?
Can the platform promote production failures to our evaluation suite with a single click?
FAQs
What is AI agent observability?
It is the practice of capturing not just what your agent did but why it did it. Unlike traditional monitoring which tracks metrics like uptime and latency, agent observability traces the full reasoning path behind every decision, tool call, and output.
How is agent observability different from LLM monitoring?
LLM monitoring tracks inputs and outputs. Agent observability tracks the decision chain between them. When an agent fails, monitoring tells you it failed. Observability tells you which step in the reasoning loop caused it and why.
Do I need a separate observability tool if I am already using Datadog?
Yes. Datadog is built for infrastructure metrics and application performance. It has no native understanding of prompt chains, tool call fidelity, or multi-step reasoning loops. You need a tool that treats traces as first-class AI artifacts, not generic log entries.
What is a context graph in AI observability?
It is the persistent record of why your agent made each decision across a session, including the reasoning it considered, the context it retrieved, the tools it called, and the outcome. The best platforms retain this as a queryable business asset rather than discarding it after debugging.
How do I debug an agent that is stuck in a loop?
Trajectory mapping automatically detects recursive patterns in your agent’s execution path. It identifies which tool call or reasoning step the agent keeps returning to and why, so you can fix the prompt or routing logic causing the cycle.
What is the difference between trace-level and session-level evaluation?
Trace-level evaluation scores individual reasoning steps and tool calls. Session-level evaluation measures whether the agent achieved the user’s actual goal across the full conversation. You need both because an agent can pass every individual trace check and still fail the user completely.