


How to make sure your recommender system is still ranking well in production
Recommender systems are machine learning (ML) that can be thought of as a subset of the ranking model class of model types. These models are popular methods for personalization tasks and are often encountered in retail and social media applications to personalize content.
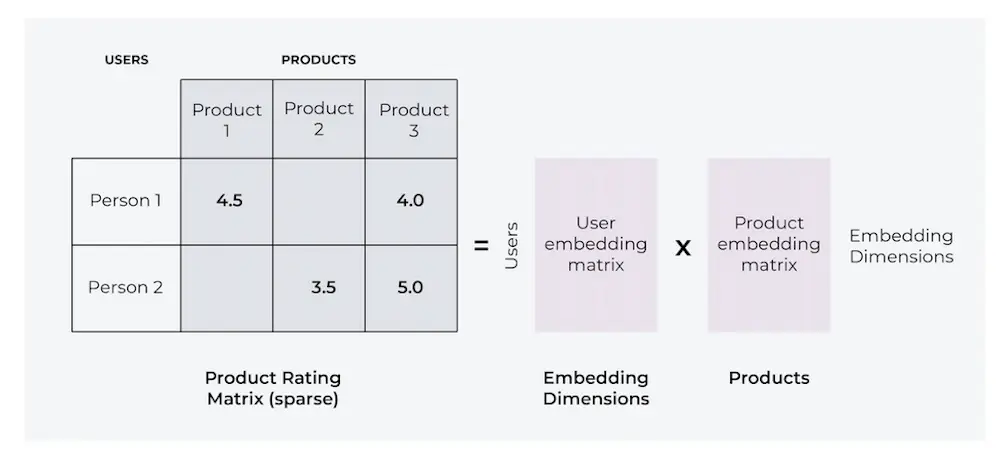
Although there are different approaches to building a recommendation system – including matrix decomposition, hybrid models, and deep learning – all of these models generate a list of items ranked according to their relevance scores. These scores represent the likelihood of a specific action, such as clicking on or buying an item.
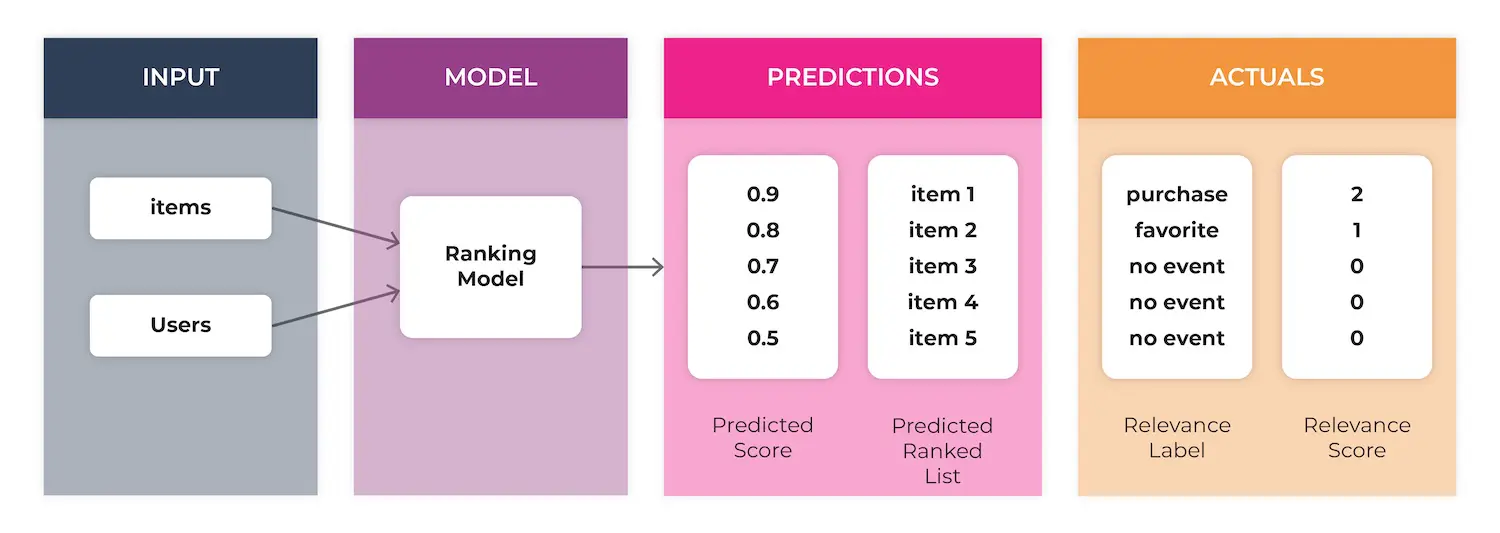
In this world, rank order matters. These ranked lists are displayed to users with the goal of optimizing the users engagement with the items in the list to drive a more personalized experience. With this in mind, the audience is likely to see first and engage with the top items in that list. In applications, the audience is typically seeing the items at the top of the list first anyway, and we want to capture their attention soon before they lose interest going down the list. So it’s crucial that the recommender system is ranking well.
What are the Major Metrics for Ranking Models?
So how good are your ranked lists, and how do you measure that? Rank aware evaluation metrics are different from traditional ML model evaluation metrics in the sense that they are no longer measuring the quality of a single point prediction, but instead measuring the quality of a ranked list of multiple predictions. Rank aware metrics use the numbers 1 through k to denote the order of an item in a list. There are a variety of core @k metrics used to evaluate ranking models. The core metrics for recommender systems are NDCG, MAR@K, MAP@K, and variations thereof.
A few key metric definitions:
| Metric | Description |
| NDCG | NDCG is a measure of the effectiveness of a ranking system, taking into account the position of relevant items in the ranked list. It is based on the idea that items that are higher in the ranking should be given more credit than items that are lower in the ranking. NDCG is calculated by dividing the discounted cumulative gain (DCG) of the ranked list by the DCG of the ideal ranked list, which is the list with the relevant items ranked in the most optimal order.
NDCG ranges from 0 to 1, with higher values indicating better performance. |
| MAP (mean average precision) | MAP is a measure of the precision of a ranking system, taking into account the number of relevant items in the ranked list. It is calculated by averaging the precision at each position in the ranked list, where precision is defined as the number of relevant items in the list up to that position divided by the total number of items in the list up to that position.
MAP ranges from 0 to 1, with higher values indicating better performance. |
| MRR (mean reciprocal rank) | MRR is a measure of the rank of the first relevant item in a ranked list. It is calculated by taking the reciprocal of the rank of the first relevant item, and averaging this value across all queries or users. For example, if the first relevant item for a given query has a rank of 3, the MRR for that query would be 1/3.
MRR ranges from 0 to 1, with higher values indicating better performance. |
Learn more about ranking metrics here.
How Does Collaborative Filtering Work?
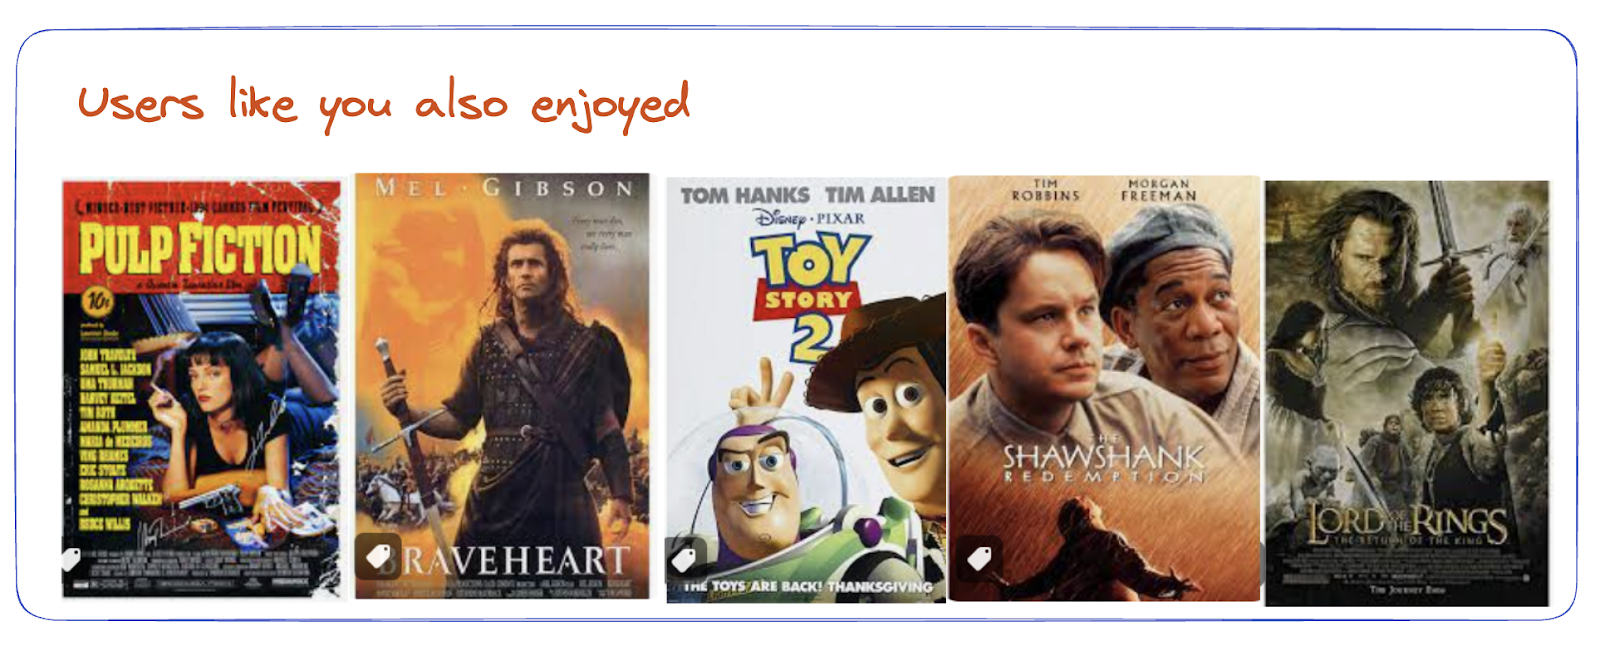
Imagine a model that is making personalized movie recommendations to a user. A collaborative filtering model uses user engagement data to identify users with similar interests, and makes recommendations based on what similar users are enjoying. These are called user-item interactions.
The output shown to a user would look something like this: The model has predicted the top k=5 movies that the user is likely to click on and ranked them from one to five based on the user’s predicted probability to click. When the user sees these recommendations they may interact, generating a feedback loop with an actual (click or not click) that can be used to evaluate the model’s accuracy.

Monitoring a Collaborative Filtering Algorithm In Production
If there is any question about why ML observability matters for personalization algorithms like this, it’s not hard to find examples of recommender systems going off the rails in the real world.
A few examples:
- YouTube admits that “something weird is up” with its recommendation system
- Buying a toilet seat leads to…more recommended toilet seats on Amazon
- An investigation surfaces concerns about TikTok’s recommendation system
So how do we keep a model like this ranking well when it’s live?
Step 1
Ingest your model inputs and outputs to Arize. Arize has ranking model support for both search ranking and recommender systems. Whether you’re using NDCG, MAP@k, regression metrics, classification metrics, or another metric to evaluate the ranking model, it’s easy to identify the data to send to Arize and the model type to use by referring to the Arize documentation here.
Step 2
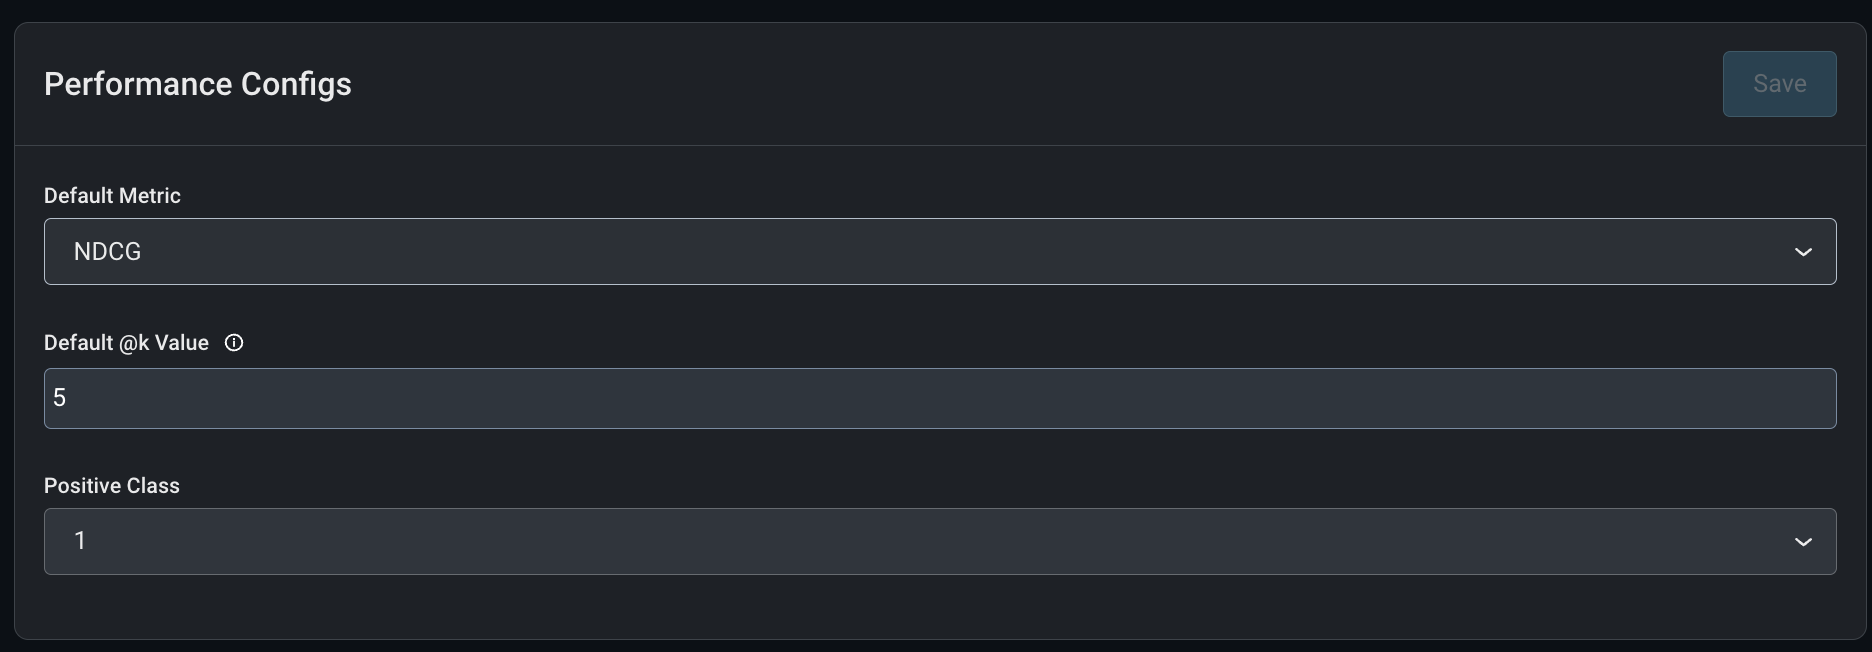
Once the data is in Arize, the model’s configurations need to be set. Here, we can choose a default metric (NDCG is selected below), and a meaningful at k value. We can also select the positive class in this case a click is denoted as “1” and a no-click is a “0.”
Step 3
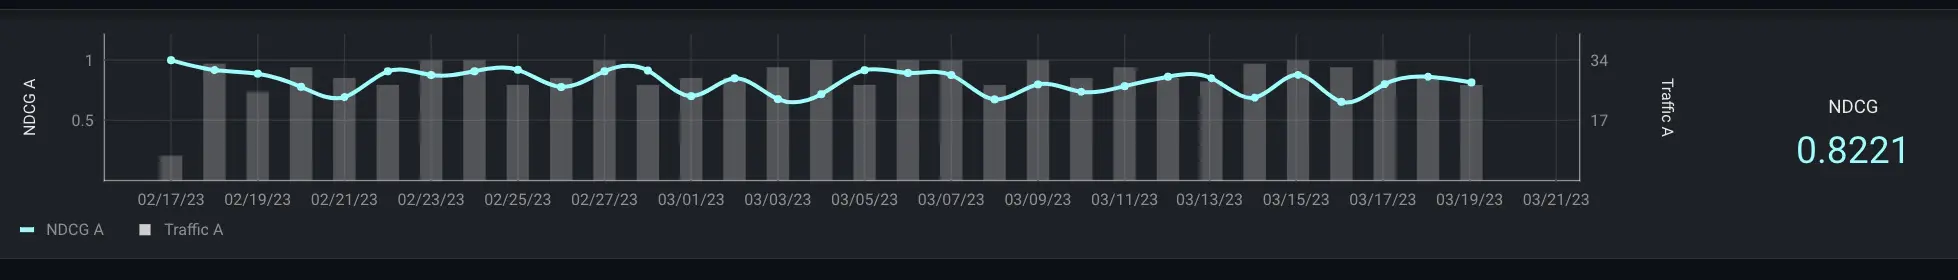
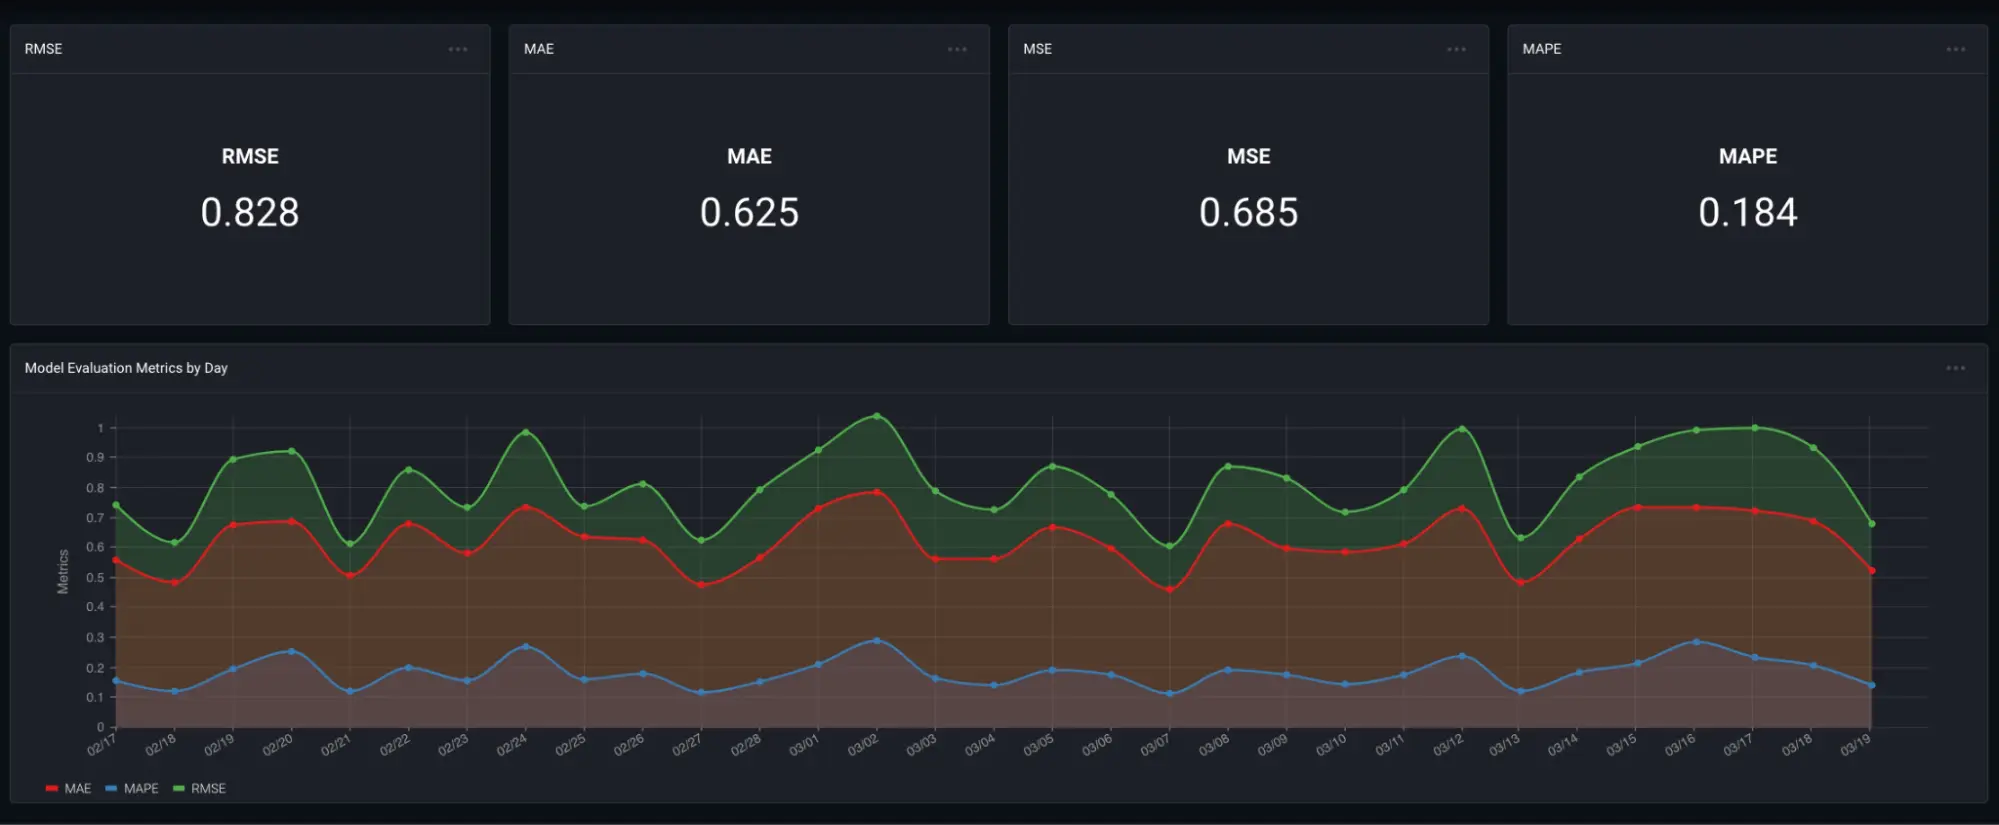
Once this is all configured, here is what can be seen and tracked in Arize dashboards:
- NDCG: measures the quality of the ranked predictions over time
- MAP: measures the precision of the items in the ranked list over time
- gAUC: measures how well the model predictions the correct interaction (classification) over time
- RMSE and MAE: measures how accurate the predicted rating scores are, which are used to rank the list of recommendations.
This distribution plot is a nice sanity check. If your ranking model is ranking, items in the higher rank orders should have higher predicted ranking scores.

Step 4
If you like what you see in Dashboards and want to be automatically alerted on these trends, check out monitors.
Troubleshooting a Collaborative Filtering Algorithm in Production
Arize performance tracing and drift interactive workflows allow users to explore trends in production data and uncover root causes of model performance drift.
In Arize, we can uncover popularity bias in the movie recommendation model example. We can visualize item popularity trends in this “Long Tail” plot.
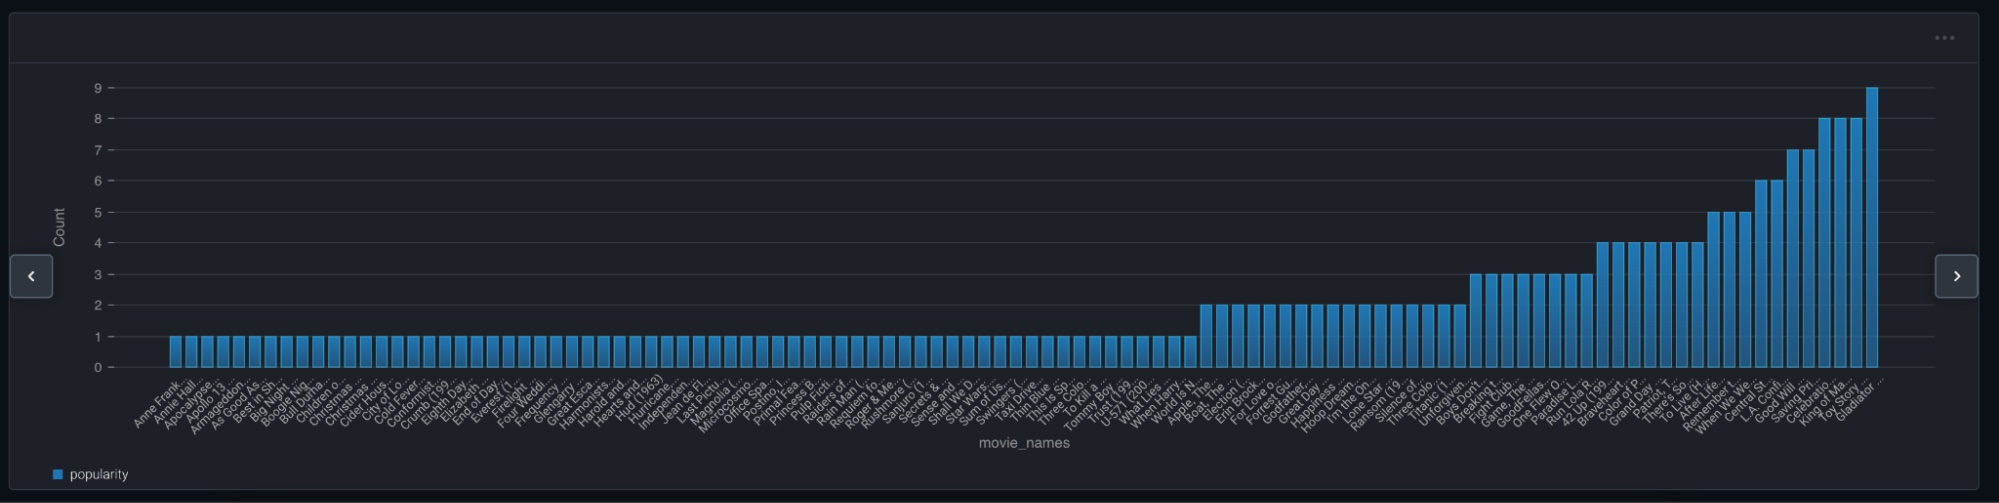
Braveheart occurred in the dataset 0.126% of time, while The Sixth Sense occurred 4.6% of time (Sorry Mel, Bruce Willis is just more popular!). If our goal with this model is personalization, we’ll want the model to be able to accurately recommend both movies to the right users.
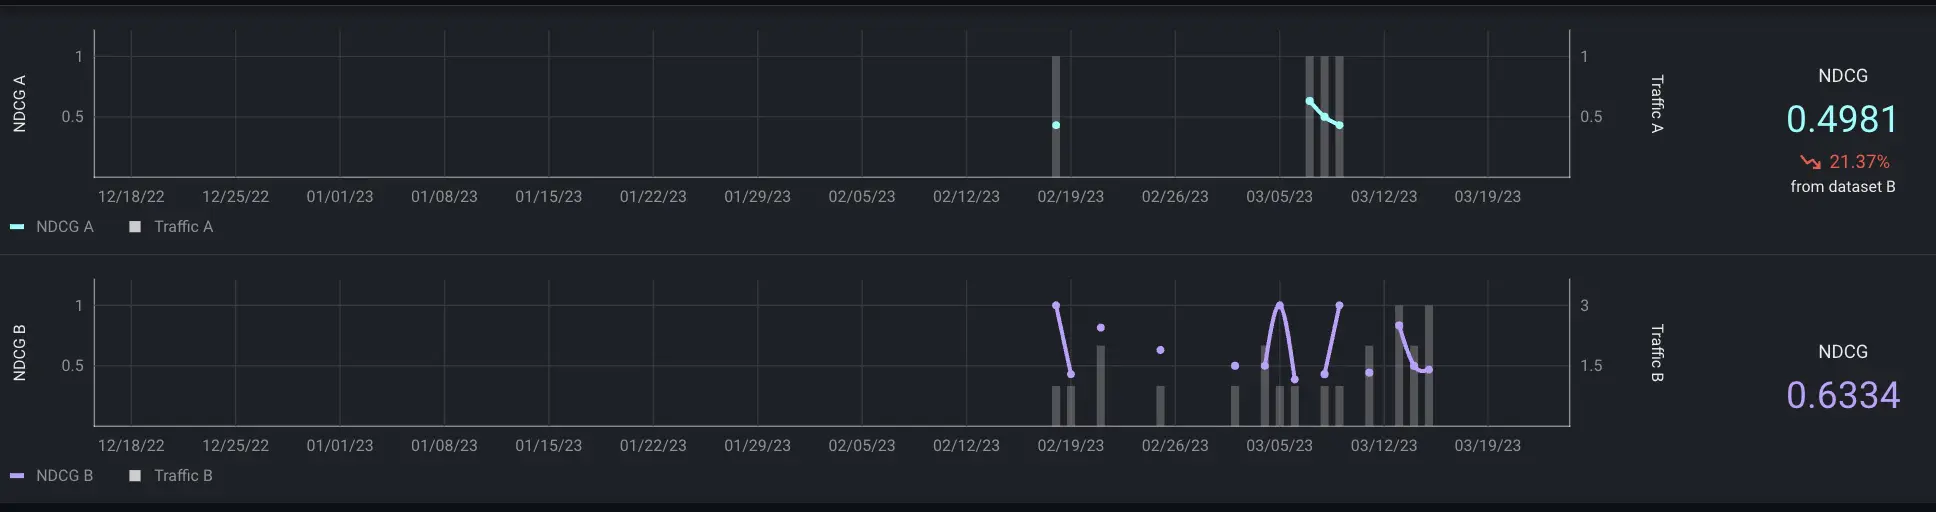
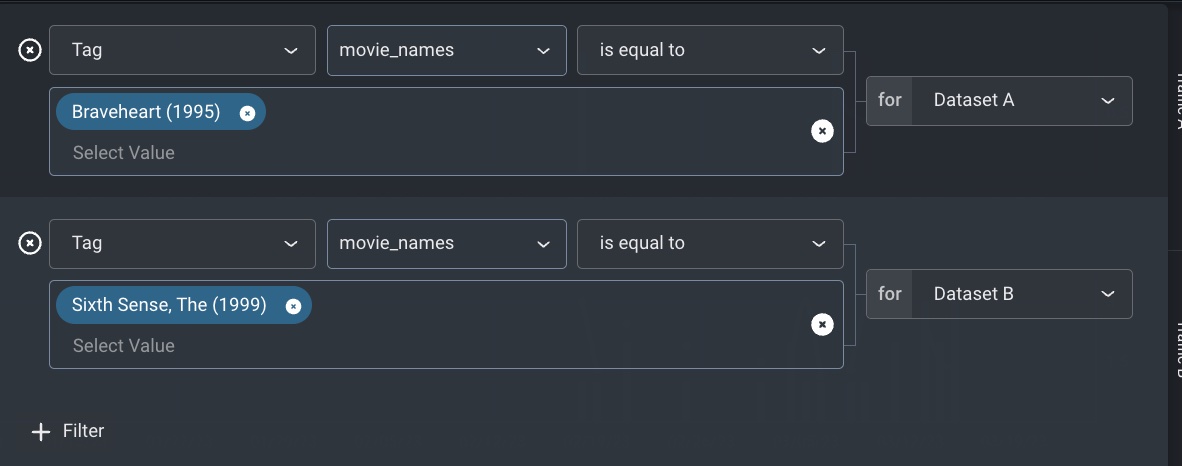
Digging in using Arize performance tracing, we can compare NDCG filtered by items. We see the model is performing a lot worse on Braveheart than it is for the more popular movie. This indicates that we could improve model performance and personalization overall by providing additional examples of item-user interactions for these less frequently occurring movies.
Conclusion
From ecommerce to music and video streaming, collaborative filtering recommender systems play a crucial role in personalizing user experiences across many popular applications. While popular, these systems are also ticking time bombs as previously unknown issues emerge in production. Utilizing rank-aware evaluation metrics and ML observability to get to the bottom of potential issues, ML teams can stay a step ahead.