

Best Practices In ML Observability for Customer Lifetime Value (LTV) Models

Krystal Kirkland
Software Engineer
Learn more about how Arize helps clients observe lifetime value models, sign up for a free account, dive into an interactive demo or request a trial of Arize.
The age-old saying still holds: the customer is always right, but some are more right than others (that’s the saying, right?). While there are many metrics to estimate the value of a customer within any organization, customer lifetime value (LTV) is an important one to consider when evaluating the health of a company’s overall sales motion. Especially in sectors like consumer packaged goods or retail where a customer-to-business relationship is inherently non-contractual, finding a way of predicting future purchasing behavior is essential in increasing overall profitability in an organization.
Customer lifetime value is simply the total monetary value of transactions or purchases made by a customer with a business over their entire lifetime. It is a measurement of how valuable a customer is to a company, not just on a purchase-by-purchase basis but across the whole relationship.
A brief history: LTV calculations were first created in the 1980s by Wharton’s Dr. Peter Fader, popularized in the 2000s, and translated into a machine learning model conveniently packaged into the open-source library Lifetimes. Since LTV evaluates the pattern of engagement based on predictions, using ML is a natural fit.
LTV models are used across an array of industries of all sizes to estimate the expected value of a customer. Like any estimation, predictions can go awry. It’s critical to understand how these predictions engage with the real world to fine-tune your model for optimal performance.
The nitty gritty: LTV in math form
LTV = ((Average Sales ✕ Purchase frequency) / Churn)) ✕ Profit Margin
- Average Sales= (Total Sales) / (Total no. of orders)
- Purchase frequency = (Total no. of orders) / ( Total no. of unique customers)
- Churn = 1 – Retention Rate
- Profit Margin = Based on business context
The Significance of LTV
From increasing overall business profitability to forecasting startup revenue, LTV’s main applications are around planning and budgeting.
According to a Criteo survey, 81% of marketers say that monitoring LTV boosts sales. As mentioned in the book Marketing Metrics, the probability of selling to a new prospective customer is 5%–20%, while the chance of selling to an existing customer is 60%–70%. Therefore, by predicting LTV you can arm your team with insights on how to acquire new customers and retain existing ones while maintaining significant profit margins. More specifically, LTV can help organizations:
- Define marketing goals
- Understand the correct channels of engagement
- Plan spending to lower acquisition costs and keep retention high
- Seek customers with similar traits
- Attain customer feedback
- Promote customer loyalty
When used properly, LTV models can play a significant role in a business. Since the predictions of LTV models help structure and define goals business-wide, it’s mission-critical to monitor and troubleshoot these models to ensure they perform to the best of their ability in production.
Challenges with Monitoring LTV Models
So, what can go wrong? LTV’s primary focus is finding, nurturing, and retaining customers that create the most value over an unspecified time period: a consumer’s lifespan. As a result, LTV models must iterate and quickly estimate long-term value with significantly delayed or no ground truth data.
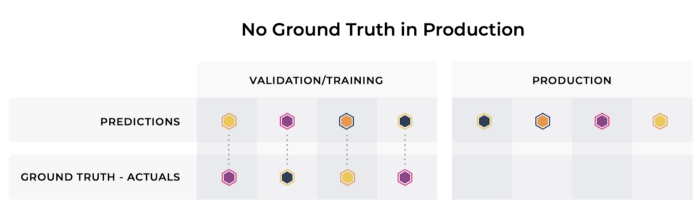
When monitoring your models in production, setting an appropriate baseline is imperative to measure drift and detect deviations in a model’s behavior in production. Typically, baselines are set using training or validation data to measure changes in the distribution of feature values, model predictions, and ground truth across different environments. Without an effective monitoring and observability tool to evaluate proxy metrics in cases of delayed ground truth scenarios, troubleshooting LTV models’ performance degradation in production may prove to be costly and time-consuming.
How to Use Monitoring and Observability for LTV Models
Based on the Criteo survey mentioned previously, one of the most significant barriers to adopting LTV is that it’s too complicated to monitor. While that has historically been the case, implementing ML observability can significantly chip away at that difficulty.
One of the main challenges of monitoring LTV models is uncovering proxy metrics to step in for delayed actuals. LTV models typically estimate the value of a customer over a significant amount of time, so mapping ground truth data to the model’s predictions can prove to be a challenge (more on proxy metrics in the sections below).
For practitioners to feel comfortable deploying and improving their LTV model performance in production, their ML observability platform should:
- Set up baseline monitors
- Evaluate feature, model, and actual/ground truth drift
- Measure model performance
Monitoring LTV Models
The first step to actively improving LTV models is to monitor your models in production. So, what does monitoring entail? An effective ML monitoring platform should automatically configure monitors best suited to your data to proactively detect drift, data quality, and performance issues. Gone are the days of manually setting thresholds and creating monitors.
Validate Model Performance Degradation Via Feature and Model Drift
To understand performance degradation of your LTV models, monitoring for feature and model drift is instructive. This means analyzing your models between various environments and versions to identify LTV patterns and anomalous distribution behavior. By leveraging drift-over-time widgets overlaid with your metric of choice, understanding model performance becomes much more efficient and actionable. While one of the main problems with LTV models is delayed or no ground truth data, you can use drift as a proxy metric to analyze how your model is performing comparatively.
Types of drift to measure:
- Feature drift: Input data inherently changes (it’s the name of the game). Monitor your features to quickly understand if your inputs deviate significantly from what your model is trained on and if you need to retrain or build a new model.
- Model drift: Measure if the outputs of your model are performing as expected in production. Uncover if your model has drifted based on:
- Training/validation environments
- Historical production periods
- Rolling production windows
Uncover the Root Causes of Inaccurate Predictions
Let’s say that your LTV model has drifted. Your monitoring solution triggers an alert, and now it’s up to you to find out what’s wrong. What’s next? You’ll want to quickly get to the root cause of the issue to reconcile the problem, often through retraining a model and comparing it to an incumbent model in production.
This can be achieved through ML observability, which can enable deeper analysis using performance heatmaps to better understand and visualize where to start troubleshooting problems associated with your LTV model. For the most straightforward workflow, ML observability allows you to drill down on low-performing slices using feature/value combinations to understand how to improve your model at a glance.
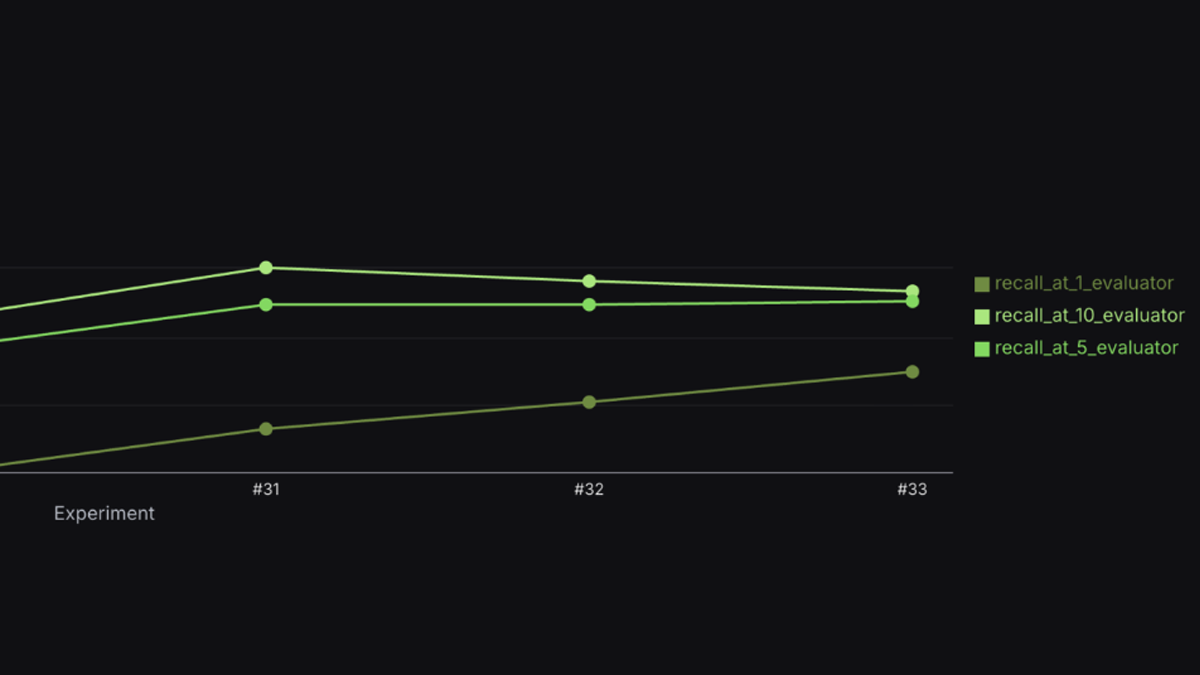
Model Performance
Even if you have the utmost confidence in your model in production, actively improving your model and monitoring for model performance helps overall business outcomes.
In the case of LTV, we evaluate model performance based on a few key metrics:
- Root Mean Square Error (RMSE): the square root of the difference between the model’s predictions and ground truth, squared and averaged out across the dataset. This measure gives higher weight to significant errors and, therefore, may be helpful in cases where a business might want to penalize large errors or outliers heavily.
- Mean Absolute Percentage Error (MAPE): measures the average magnitude of error produced by a model; MAPE is one of the more common metrics of model prediction accuracy in LTV.
- Mean Absolute Error (MAE): the absolute value difference between a model’s predictions and ground truth, averaged out across the dataset. A great “first glance” at model performance since it isn’t skewed by extreme errors of a few predictions.
When picking which performance metric(s) to measure, there’s no one answer for which metric to use; it is dependent on your model and the data it ingests. Once you decide on your performance metrics, tracking your model performance metrics on a daily or a weekly cadence allows you to make sure that performance is not degrading drastically from when the model trained or when the model was initially promoted to production. ML observability helps you keep track of these important metrics, trigger alerts if something goes wrong, and introspect to uncover the underlying issue.
Conclusion
By uncovering drift, understanding model performance and easily identifying the root cause of potential production issues, ML engineers can ship their LTV models with the utmost confidence and improve overall business outcomes. While monitoring and observing production models does not seem simple (spoiler alert: it’s not) and can act as a barrier to shipping models (it does), solutions in the MLOps toolchain can simplify model monitoring and troubleshooting. Implementing ML observability can help ensure the predictions of LTV models stay in tip-top shape with automatic monitors, monitoring for feature and model drift, and visualizing model performance over time.