


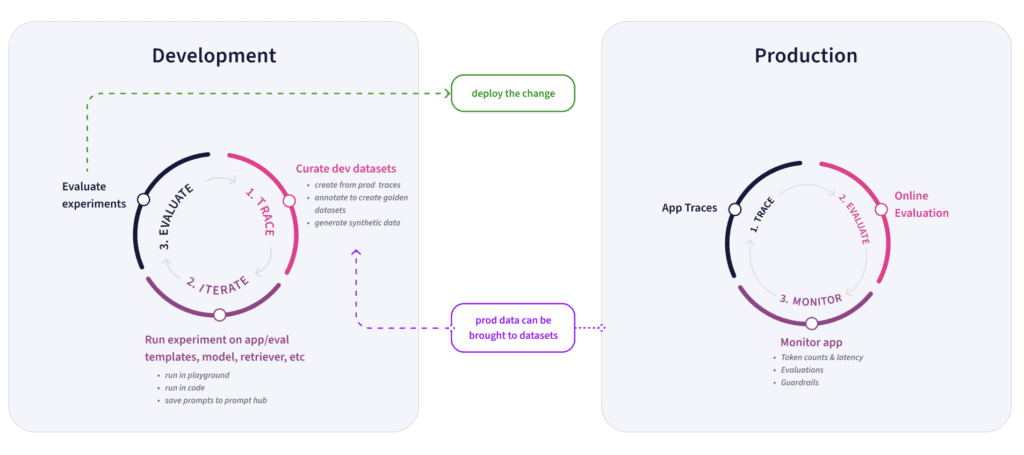
Building an AI agent and keeping it running smoothly in production can feel like a daunting task. When it comes to working with LLMs, it’s still a bit of uncharted territory—most of us are figuring things out through trial and error. Even after you’ve launched in production, things can break or perform unexpectedly, forcing you to go back, iterate, and try again. The line between development and production often feels blurry, with constant back-and-forth.
That’s where a tool like Arize becomes essential. But with such a robust toolkit, it can be overwhelming to know which features to use and when. We’ve experienced the pain of building, so we’re here to help you navigate these complexities.
In this blog, we’ve broken down how we develop, iterate, and improve our AI Assistant–Copilot–using Arize and Phoenix. We’ll guide you through the key features and workflows that make it all work.
AI Agent Testing and Iterating
When it comes to developing new skills, or testing and iterating on features, Phoenix is our go-to tool. Its traces provide us with invaluable insights during development. When we build a new skill, we usually start with a proof of concept—a basic skeleton that performs the desired task. From there, we dive into testing and iterating.
We’ve created a testing framework that integrates Copilot components directly into a notebook, making it easy to run test queries and the traces are immediately available in Phoenix for review. This lets us assess if data functions are fetching the correct data from Arize, if routers are properly calling functions, and whether functions are receiving the right arguments—all while checking if the responses align with our expectations. In short, Phoenix traces help us understand what’s working and what’s not, enabling us to iterate quickly and confidently. For us, Phoenix traces are one of our most frequently used development tools.
Once a skill is live in production, Arize becomes our primary tool. We rely on it daily, especially the traces, to see how users interact with Copilot and whether it’s performing as expected. Filtering data is crucial here. For example, we often filter by user email to differentiate internal use from customer interactions. We’ll scroll through traces, inspecting the steps the application took to ensure they align with our expectations.
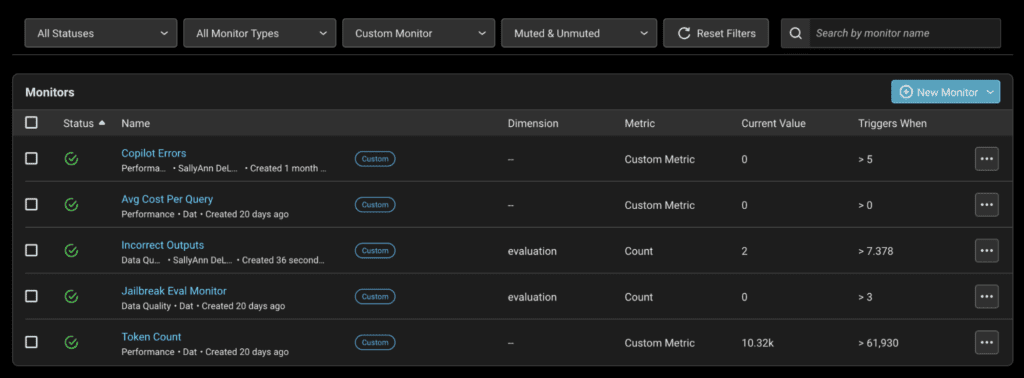
Recently, a change to our tracing endpoint broke several generative skills, causing widespread issues. We identified the problem using the traces page by filtering for error traces. Once we reviewed them, it became clear what was wrong, and we were able to resolve the issue quickly. However, to avoid a similar situation in the future, we set up error monitors that alert us when more than five errors occur, allowing us to fix issues even faster. We also monitor eval labels for potential issues like jailbreaking attempts.
Daily Flows: Dashboards and Monitoring
Another key part of our daily workflow is checking out Arize dashboards to monitor patterns and usage. We track high-level metrics such as the number of Copilot requests, average query costs, and token counts. These metrics help us gauge traffic and cost. Error rates are also a critical metric we follow closely on our dashboards.
One of the most insightful parts of the dashboard is tracking the number of requests by skill and user. Being able to visualize this helps us see which users are the most active—making it easier to gather feedback—and which skills are gaining the most traction. Early on, this data helped us identify where to invest in development, allowing us to double down on our most powerful skills.
Evaluating Agent Performance with Online Evals
To keep a pulse on Copilot’s performance in production, we set up online jobs to run automatic evals on new data. We started with a simple QA correctness eval, using Phoenix’s eval library, to check whether Copilot was answering user queries correctly. This helped us filter and drill into traces, refining performance over time. With tools like annotations, we can now review eval performance and mark incorrect evaluations for future iteration.
Not all skills fit under a generic QA correctness eval, so we’ve since built skill-specific evals with additional layers of evaluation. By refining our eval sets, we ensure more comprehensive monitoring.
Harnessing Datasets and Experiments
Daily trace reviews help us form hypotheses and build intuition about user behavior. One of our favorite features for this is datasets. As we review traces, we often identify patterns—whether it’s problematic traces, buggy behavior, or less-than-ideal results—and save them to datasets for future testing. One way we like to do this is to collect unsupported user queries in a dataset, as it helps pinpoint missing functionality in Copilot. Datasets are versatile, serving as collections of examples for testing or as active components in our development workflow with experiments.
Experiments are our go-to when testing changes, such as model updates or A/B tests. By combining datasets and experiments, we can systematically test changes in our application. We define tasks that replicate parts of the application and use evaluators to measure success. Whether troubleshooting issues or validating improvements, experiments give us a structured way to measure the impact of our changes and ensure things stay on track.
Handling Model Switches with Experiments
Back in May, when OpenAI released GPT-4-o, we were excited to take advantage of its improved performance, speed, and security. What we didn’t anticipate was the significant impact switching models would have. Many of our skills began to fail—some produced odd responses, others ignored instructions, and some even stopped working altogether. It quickly became clear that we needed to manually test every single function, document our findings, and iterate until everything was fixed. It was a painful process.
Now, with experiments, we can take a far more systematic approach when handling changes like model switches. We create a golden dataset, set up tasks that mirror our real-world setup, and evaluate whether the new model produces the correct results across all golden inputs. This allows us to predict exactly where things will break and how we need to adjust.
We also use experiments in ongoing development. For example, after reviewing our dashboards and determining that AI Search was the most promising skill to invest in, we saved a collection of traces where users attempted queries that weren’t fully supported. We noticed three clear categories of user expectations: text-to-filter, table search, and analytics. So, we developed three new skills and updated our router to handle them.
Instead of releasing these updates blindly, we leveraged datasets and experiments to thoroughly test the changes.
We built experiments to verify that our new router was selecting the correct function and passing the right arguments. We also ran experiments to ensure each new function was performing as expected. This data-driven, iterative approach has been game-changing for us, allowing us to refine our product based on real insights and confidently validate changes before release.
Automating with CI/CD Pipelines
To streamline this process further, we automated our evaluation workflow using a CI/CD pipeline with Git actions. We wrote experiment scripts for both the router and skills tests and added a workflow file to our repo. Now, every time a push is made to the AI Search code directory, these experiments run automatically. Just like any other Git check, the experiment will either pass or fail. If the mean score of the evaluators is below 0.7, the check fails.
This automated setup gives us confidence that any change we make can be tested thoroughly and with minimal manual effort. We plan to implement experiments across all our skills to ensure we understand the impact of every change we make.
Continuous Monitoring and Troubleshooting
The evaluators we built for our experiments are also used as evals running in production via online jobs. This means we have continuous coverage—both during iteration and once a skill is live. If a skill starts to underperform, we typically notice an increase in failed evals. When that happens, we filter by the skill or trace type, dig into the traces, and begin troubleshooting.
The process is straightforward: once we identify an issue—whether with the prompt or function—we go directly from a trace to the Prompt Playground. The Playground is automatically loaded with the prompt template and variables, allowing us to quickly make edits and test if we can resolve the problem. If we have a dataset of problematic traces, we can load it into the Playground to test the new prompt across all examples, ensuring we’ve addressed the issue.
If the problem is with function calling, the Playground helps here too. We can load our router prompt and tool definitions, adjust them as needed, and test the router’s ability to call the correct function with the right arguments. Being able to replicate our exact environment within the Playground gives us confidence in the changes we make before pushing them to production.
Bringing It All Together: Code, Commit, Iterate
Once we’ve run our tests and are satisfied with the results, we commit the code, kicking off the entire process we’ve outlined. From Phoenix traces and Arize dashboards to experiments and the Prompt Playground, these tools allow us to continuously iterate, improve, and refine Copilot. Without them, we couldn’t operate with the same level of confidence or velocity.
Development isn’t a linear process. We use these workflows as essential parts of both development and production, constantly looking for ways to improve the user experience. By sharing these workflows, we hope to inspire you to take a similar approach in your own development processes.