
The Playbook to Monitor Your Model’s Performance in Production

Aparna Dhinakaran
Co-founder & Chief Product Officer
As Machine Learning infrastructure has matured, the need for model monitoring has surged. Unfortunately this growing demand has not led to a foolproof playbook that explains to teams how to measure their model’s performance.
Performance analysis of production models can be complex, and every situation comes with its own set of challenges. Unfortunately, not every model application scenario has an obvious path to measuring performance like the toy problems that are taught in school.
In this piece we will cover a number of challenges connected to availability of ground truth and discuss the performance metrics that are available to measure models in each scenario.
The ideal ML deployment scenario, often what they teach you in the classroom, is when you get fast actionable and fast performance information back on the model as soon as you deploy your model to production.
This ideal view looks something like this:
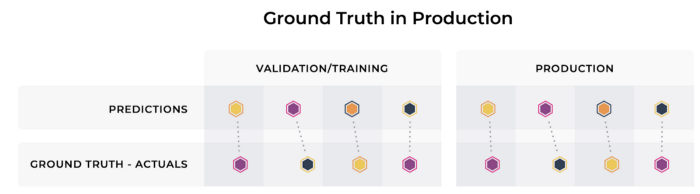
In this example ground truth is surfaced to you for every prediction and there is a direct link between predictions and ground truth, allowing you to directly analyze the performance of your model in production.
There are many industries that are lucky enough to face this ideal scenario. This is the case in digital advertising where a model attempts to predict which ad a consumer is most likely to engage with. Almost immediately after the prediction is made, the ground truth, whether they clicked or not, is determined.
For another example of this ideal scenario we can take a look at predicting food delivery estimates. As soon as the Pizza has arrived at the hungry customer’s house, you know how well your model did.
Once you have this latent ground truth linked back to your prediction event, model performance metrics can easily be calculated and tracked. The best model metric to use primarily depends on the type of the type of model and the distribution of the data it’s predicting over. Here are a few common model performance metrics:
Accuracy: General overall accuracy is a common statistic useful when classes are balanced.
Recall: Useful for unbalanced classes. What fraction of overall positives did I get correct.
Precision: Useful for unbalanced classes. What fraction of positive identifications were correct.
F1: Useful for unbalanced classes and allows for analysis of trade off between Recall and Precision.
MAE or MAPE: Regression or Numeric Metric performance analysis. MAPE can be good when the percent of how far off you are matters.
Once a model metric is determined, tracking this metric on a daily or a weekly cadence allows you to make certain that performance has not degraded drastically from when it was trained or when it was initially promoted to production.
However as you have surely predicted by now, this ideal scenario is the exception and not the rule. In many real world environments access to ground truth can vary greatly, and with it the way the tools you have at your disposal to monitor your models.
While many applications enjoy realtime ground truth for their model’s predictions, many model application scenarios have to wait a while to know how their model should have behaved in production.
Imagine you are trying to predict which of your customers are credit worthy and which ones of them are likely to default on a loan. You likely won’t know if you made a good decision until the loan is paid off or the customer defaults. This makes it tricky to ensure that your model is behaving as expected.
This delay in receiving ground truth can also not have a fixed time scale. Take, for example, trying to classifying which credit card transactions are fraudulent. You likely won’t know if a transaction was truly fraudulent until you get a customer report claiming that their card was stolen. This can happen a couple of days, weeks, or even months after the transaction cleared.
In these cases, and a number of others, the model owner has a significant time horizon for receiving ground truth results for their model’s predictions.
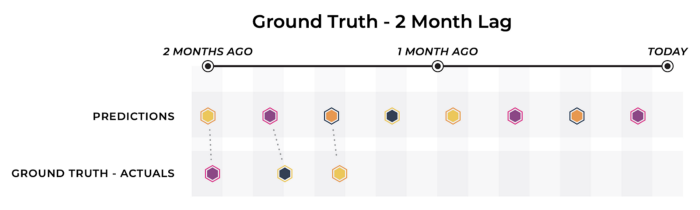
In this above diagram, while we do see that ground truth for the model is eventually determined, the model’s predictions over the last month have not received their corresponding outcomes.
When this ground truth delay is small enough, this scenario doesn’t differ too substantially from real time ground truth, as there is still a reasonable cadence for the model owner to measure performance metrics and update the model accordingly as one would do in the realtime ground truth scenario.
However, in systems where there is a significant delay in receiving ground truth, teams may need to turn to proxy metrics. Proxy metrics are alternative signals that are correlated with the ground truth that you’re trying to approximate.
For example, imagine you using a model to which consumers are most likely to default on their credit card debt. A potential proxy metric for success in this scenario might be the percentage of consumers you have lent credit that make a late payment.
So while you don’t have access to ground truth yet, you can start to see how the proxy metrics that you can compute in the meantime change over time to measure how your model is performing.
Proxy metrics serve as a powerful tool in the face of delayed ground truth as they give a more up to date indicator of how your model is performing.
Case 3: Causal Influence on Ground Truth (Biased Ground Truth)
One important thing to note is that not all ground truth is created equal. There are some cases where teams receive real time ground truth; however, the model’s decisions substantially affect the outcome.
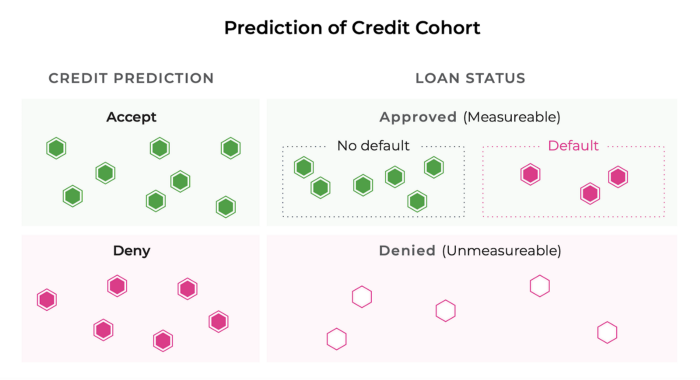
In this example, we are trying to predict who is credit worthy enough to receive a loan. This becomes tricky because when you decline someone credit, you no longer have any information about whether they could have paid you back.
In other words, only the people you decide to give a loan to will result in lead to outcomes that you can use to train future models on. As a result, we will never know whether someone the model predicted will default could have actually paid the loan back in full.
This may lead you to throw your hands in the air and accept that your ground truth is just going to be biased; however, you do have some tools at your disposal.
Something you can do is create a hold-out set where you don’t follow your model’s predictions and compare the difference in prediction performance between this hold-out set and the set using the model’s predictions.
You can use these two sets that received different treatments to look for validate your models predictions and, in our example’s case, ensure that you’re not potentially missing a potential set of credit worthy people that your model was missing.
As someone working with data, you will most likely see this picture pop up often. No discussion of bias in data is complete without a reference to it.

As the story goes, engineers in WW2 created a heatmap of locations where bullet holes pierced the planes that came back from battle with the intention of determining where to fortify the armor. One day a statistician named Ahbrahm Wald noted that the heatmap was only created from planes that had made it back from their missions. So, in fact, the best place to put armor was probably where the empty space existed, such as the engines, as the planes that were hit in these locations never made it home.
TLDR: Always be conscious of the bias in your ground truth data
Case 4: No Ground Truth
This brings us to the worse case scenario for a modeling team: having no ground truth feedback to connect back to model performance.

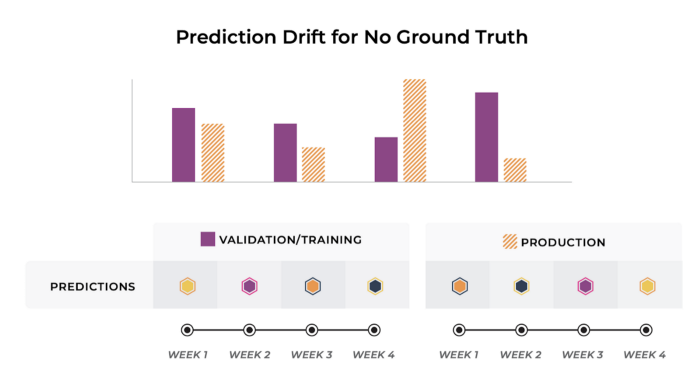
In the above example we have ground truth in our validation and training sets to link back to our model’s predictions; however in production, we have little to now feedback on how our model is performing.
Again in this scenario proxy metrics for ground truth can be extremely useful. In the absence of ground truth, if you can find something else that correlates to ground truth, you can still get a sense of how your model is performing over time.
Outside of proxy ground truth metrics, even when ground truth is hard to collect, it’s important for teams to find a way to collect a sample of ground truth data.
One way to acquire this ground truth data is to hire human annotators or labelers to provide feedback on their model’s performance. This approach can be expensive and time consuming; however, the reward for having a set of high-quality ground truth data is immense.
In the periods where ground truth is available or has been collected through manual annotation, performance or lagging performance metrics can be used. Though these lagging performance metrics are not quite as good at signaling a sudden model performance regression in a real time application, they still provide meaningful feedback to ensure that the models performance is moving in the right direction over time.
Drift is a Proxy for Performance
While these lagging performance metrics can’t immediately signal a change in a model’s performance, measuring the shift in the distribution of prediction outputs potentially can. A drift occurring in the output prediction can be used to alert the team of aberrant model behavior even when no ground truth is present.
Some metrics you can use to quantify your prediction drift are distribution distance metrics, such as: Kullback-Leibler Divergence, Population Stability Index (PSI), Jensen-Shannon Divergence, etc.
For more details on using statistical distances for drift monitoring, check out my detailed piece here.
Model Metric by Cohort
As much as Data Scientists like to deal with aggregate optimization statistics the reality is that models affect different people, customer segments, and business decisions differently.
Two candidate models with the same accuracies could affect particular sets of individuals dramatically differently, and these differences can be very important to your business.
Teams typically divide their data into “slices” or “cohorts”. These cohorts can be discovered over time or they are built on the fly to debug where a model is making a disproportionate amount of mistakes.
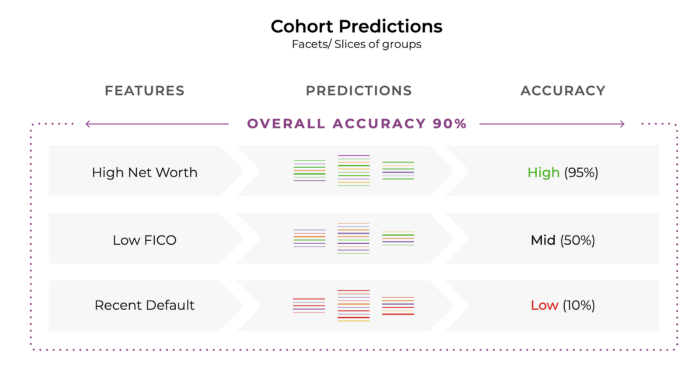
In this example above, we see that grouping data based on features such as high net worth, low FICO scores, and the presence of a recent default provides important information about how the model is performing for these particular cohorts.
Above the overall accuracy of 90% is really hiding the fact that the model is performing terribly at predicting credit worthiness for people who have recently defaulted.
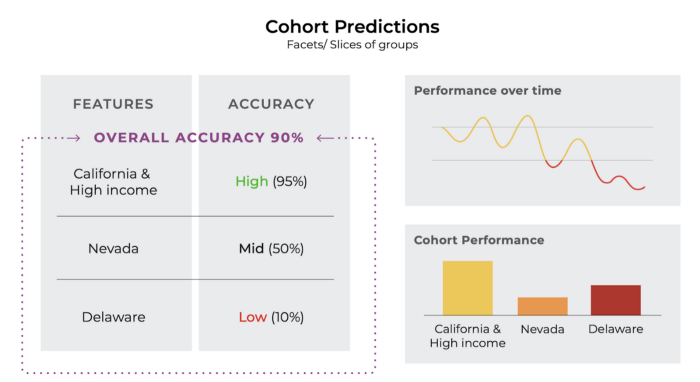
Measuring model performance across cohorts is similar to measuring model performance in aggregate. Performance should be measured for each cohort that is important to the business and an alert should be issued when performance drops below a threshold threshold defined by training or initial model launch.
Measuring Business Outcomes
Now that we have talked about measure model performance by selecting the right model metrics for your application scenario, let’s briefly talk about measuring business metrics.
Business metrics go hand in hand with the model metrics and when properly defined, they should be linked. At the end of the day, you aren’t shipping a F1 score to your customers, and as a result it’s important to keep in touch with how your models are affecting how each customer is experiencing your product.
Business metrics tend to not be well suited for traditional optimization, yet they provide key insights into a business goal. Since these metrics are not easy for a model to optimize for, the optimization problem will be set up using a parallel metric.
Turning to the credit worthiness example again, while your model might be optimizing for a traditional model metric such as accuracy or F1, a business metric you might want to be monitoring is the percentage of people you turn away from credit.
At the end of the day a product manager on your team might not care about MAPE, but will they will care about how your users are experiencing your product. Measuring model evaluation metrics doesn’t usually capture how many angry customers you might have.
As you may have picked up, identifying and measuring business metrics is an extremely important process for ensuring your effort is being well spent in improving your product, and I will be doing a deeper dive into this in a future piece!
Summary
In summary, measuring model performance is not one size fits all, and your business application may require some or all of these measurement techniques that we discussed.
While the path toward measuring your model’s performance is not always clear cut, what is clear is that correctly measuring model your performance is essential to ensuring you are shipping a consistent and effective product to your customers.