

Co-Authored by Duncan McKinnon, ML Solutions Engineer & Chris Cooning, Head of Product Marketing & Fuad Ali.
Coding agents are useful, but they’re still hard to debug.
You give Claude Code a task. It reads files, edits code, runs commands, retries after errors, and eventually returns a patch. Sometimes it works. Sometimes it fails in a subtle way. Either way, it’s hard to see what actually happened.
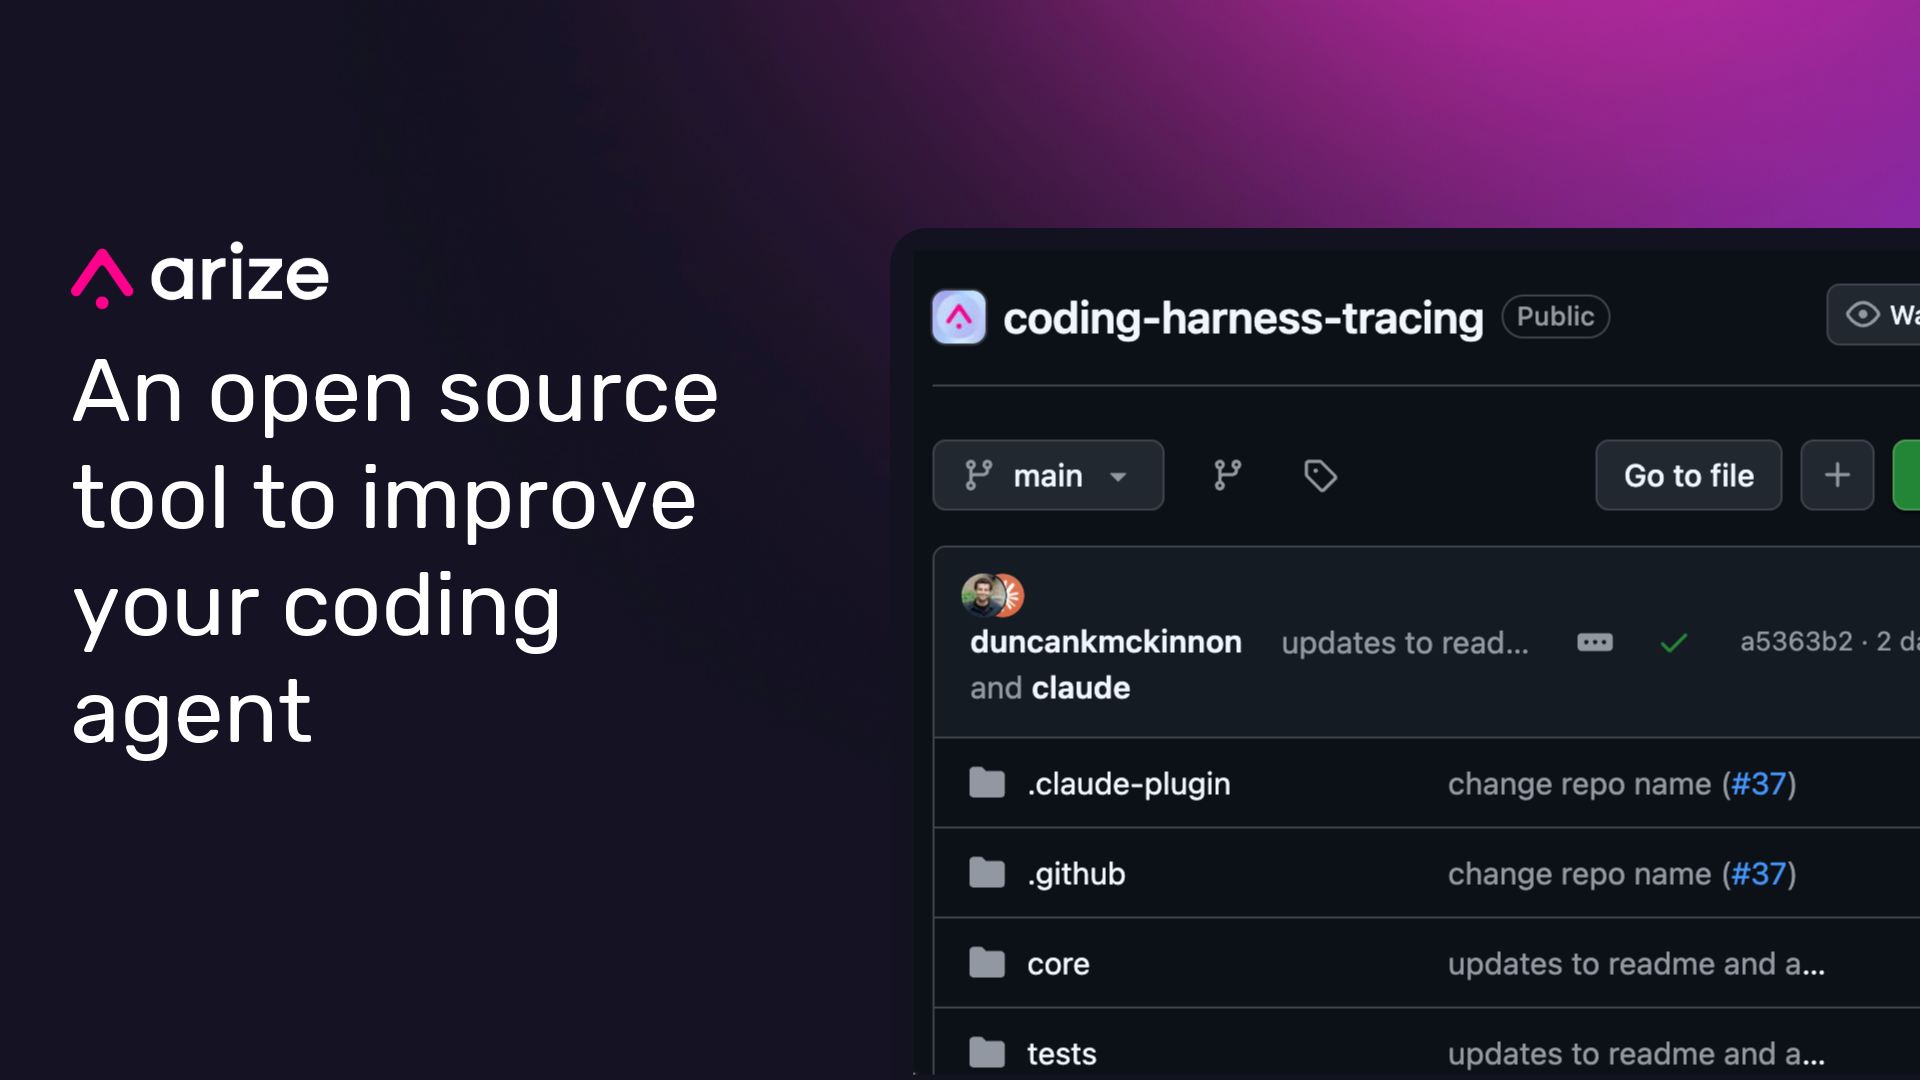
Today we’re launching coding-harness-tracing, an open source project for tracing coding agent workflows across Claude Code, Cursor, Codex, GitHub Copilot, and Gemini CLI.
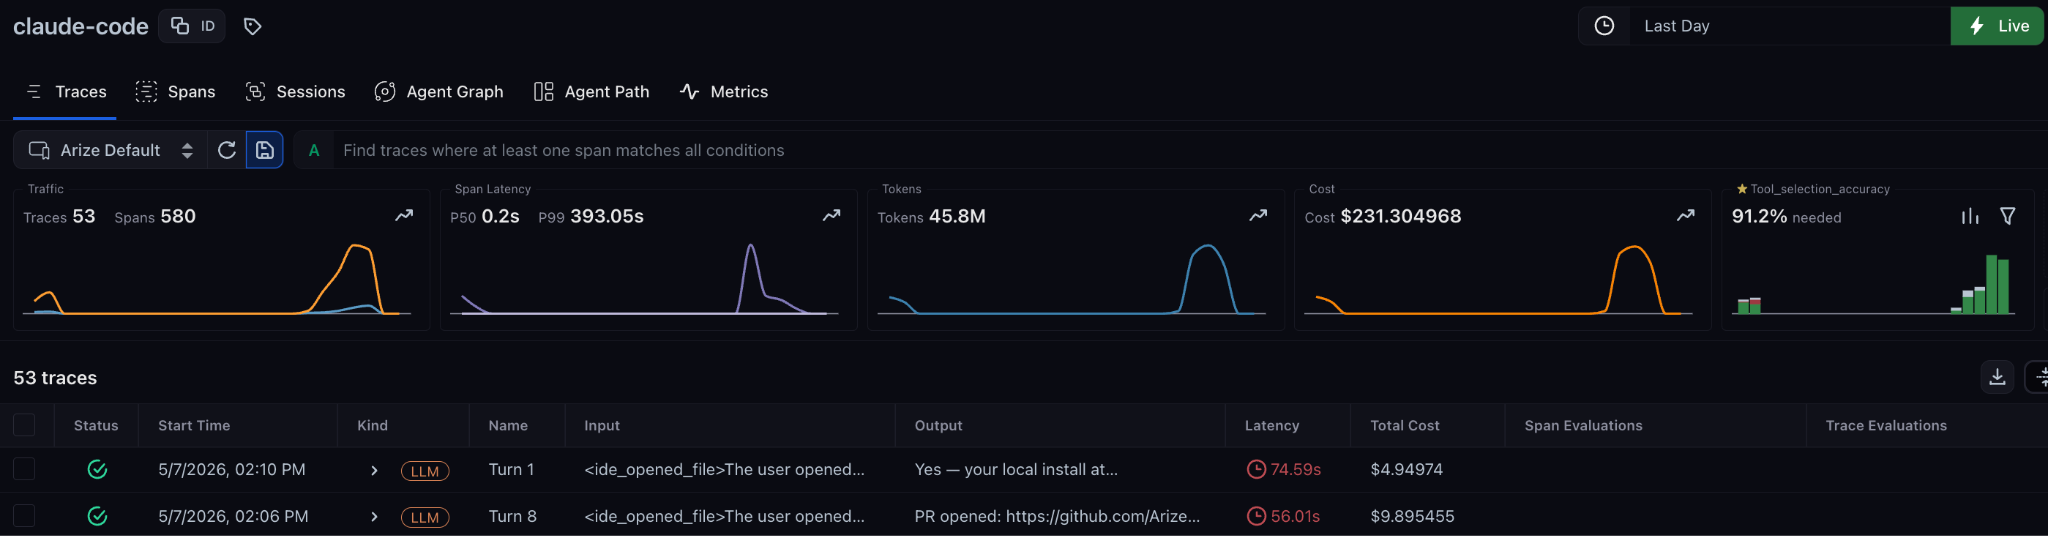
With harness tracing, you can inspect each run step by step: files read, tools called, commands run, retries, token usage, latency, and final outputs. From there, you can compare prompts, find wasteful workflows, build reusable skills, and measure which models or harnesses produce better results on your codebase.
Traces can be sent to Arize AX or Phoenix for inspection, replay, evaluation, experiments, and dashboards.
With coding harness tracing, you can now address those opportunities on the foremost agent development platform in the world.
What is coding harness tracing?
The open-source coding-harness-tracing project is free and instruments coding harnesses such as Claude Code, Codex, Cursor, GitHub Copilot, and Gemini CLI so you can capture agent steps, tool calls, prompts, responses, latency, token usage, and errors.
(We have documentation for getting started with your coding agent of choice.)
Those traces can be sent to either Arize AX platform or a self-managed instance of Phoenix, where you can inspect runs, build datasets, run experiments, evaluate behavior, replace agent sessions, and create dashboards for tracking improvements over time.
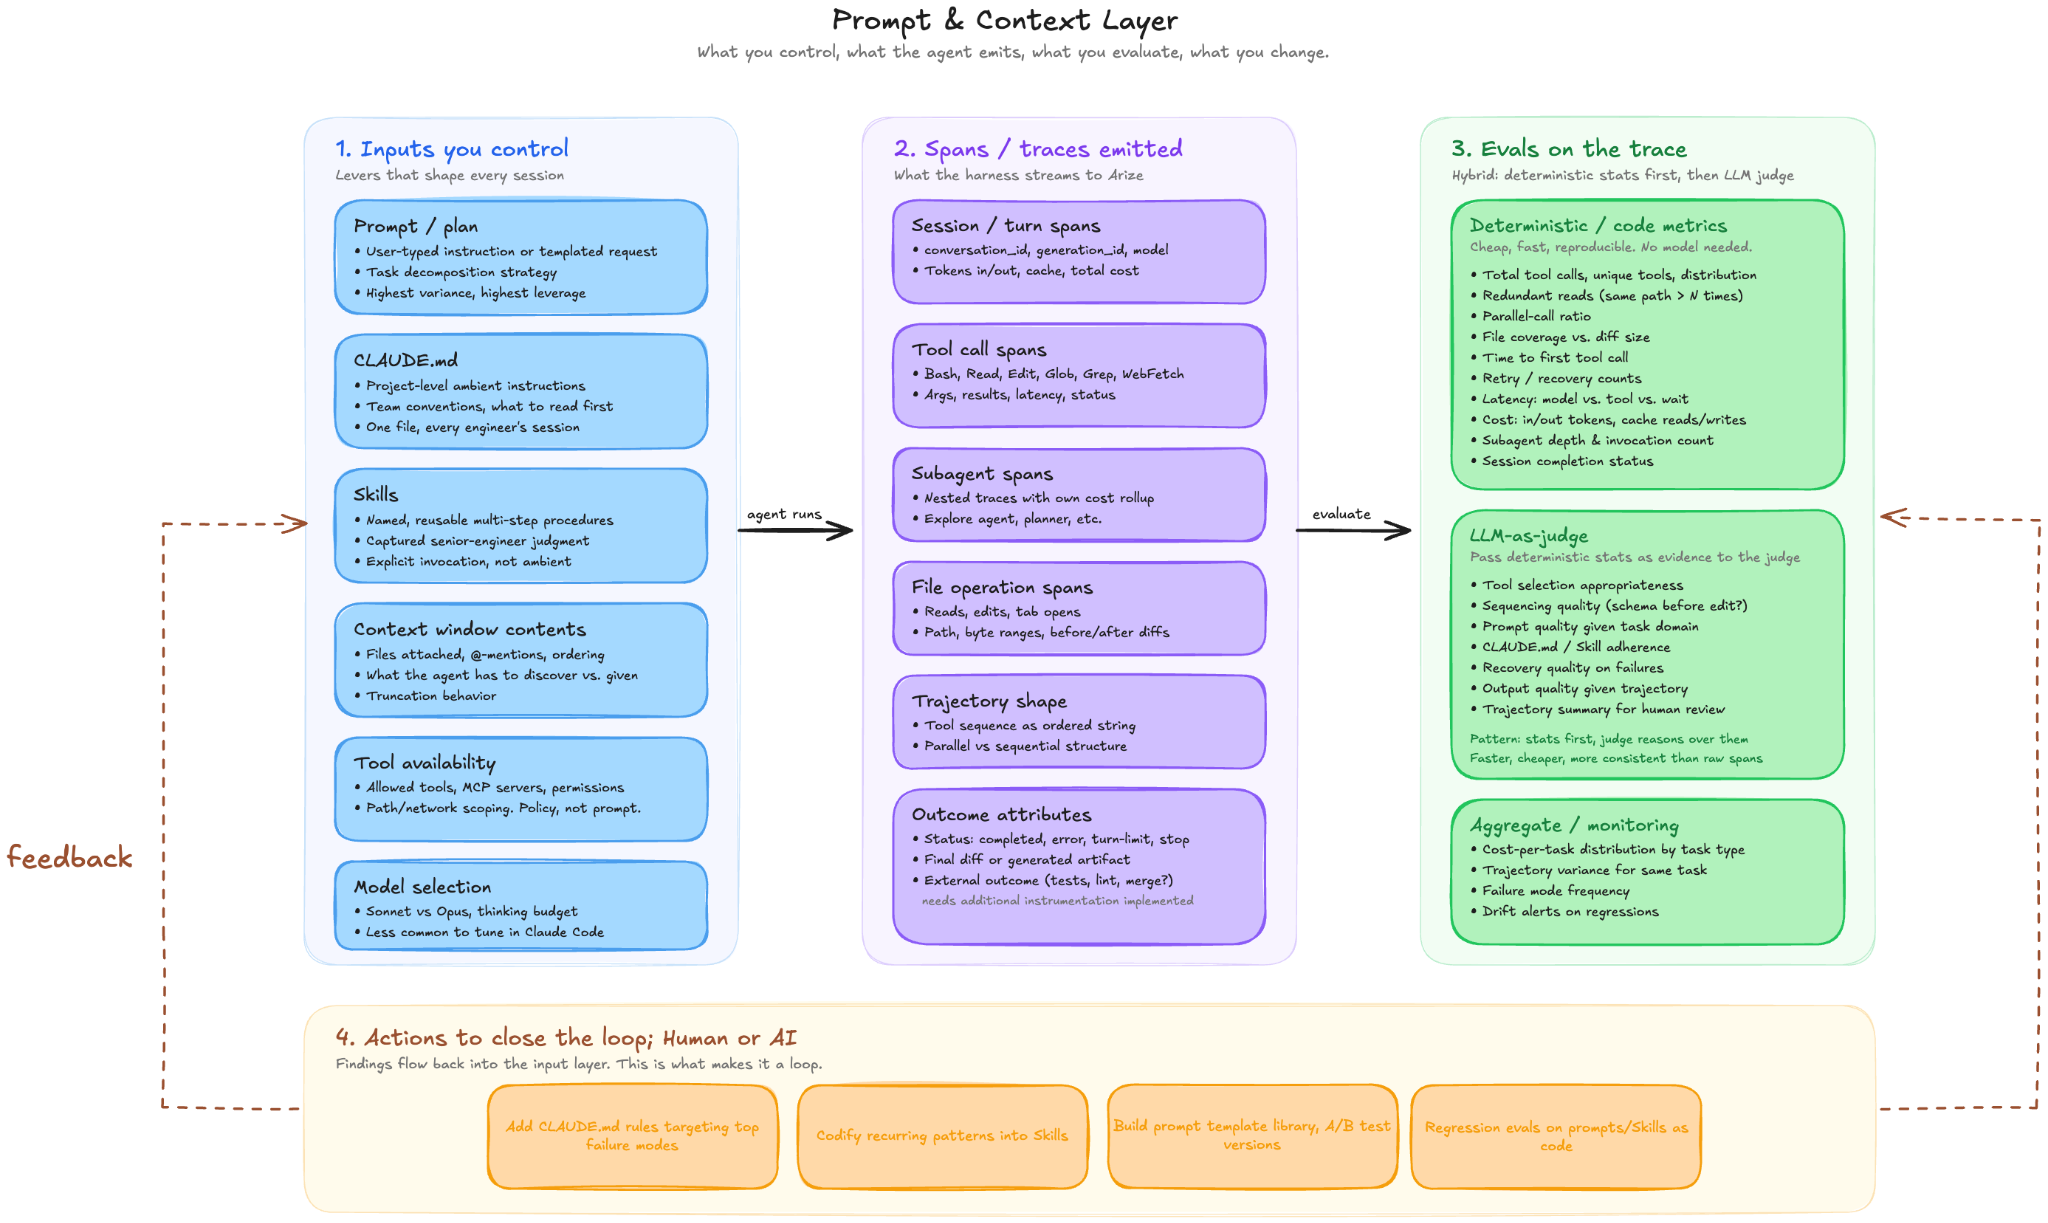
What you can inspect in a trace
A trace turns a coding agent session into a sequence of observable steps:
- the original user prompt
- model responses
- file reads and edits
- shell commands
- tool calls
- MCP server interactions
- errors, retries, and dead ends
- latency, token usage, and estimated cost
That helps you move beyond the basic question of “did the agent work?” and ask:
- Did it read the right files before editing?
- Did it run tests after making changes?
- Which tool calls were unnecessary?
- Where did it repeat itself?
- Did a different model or prompt reduce retries?
- Did the workflow improve across multiple runs?
Improving your coding agent workflow
Individual developers can use traces to understand how their coding agents work across real tasks. This is especially useful when comparing prompts, models, skills, tools, and MCP servers. By capturing every step the agent takes, coding harness tracing makes it possible to answer questions like:
- Which of the tool calls are actually necessary?
- Where is ambiguity causing my agent to hallucinate or bleed tokens?
- What repeated workflows can become reusable skills?
- Which coding harness/model combination performs best on correctness, latency, and token usage?
- Where should you add instructions, tests, or guardrails?
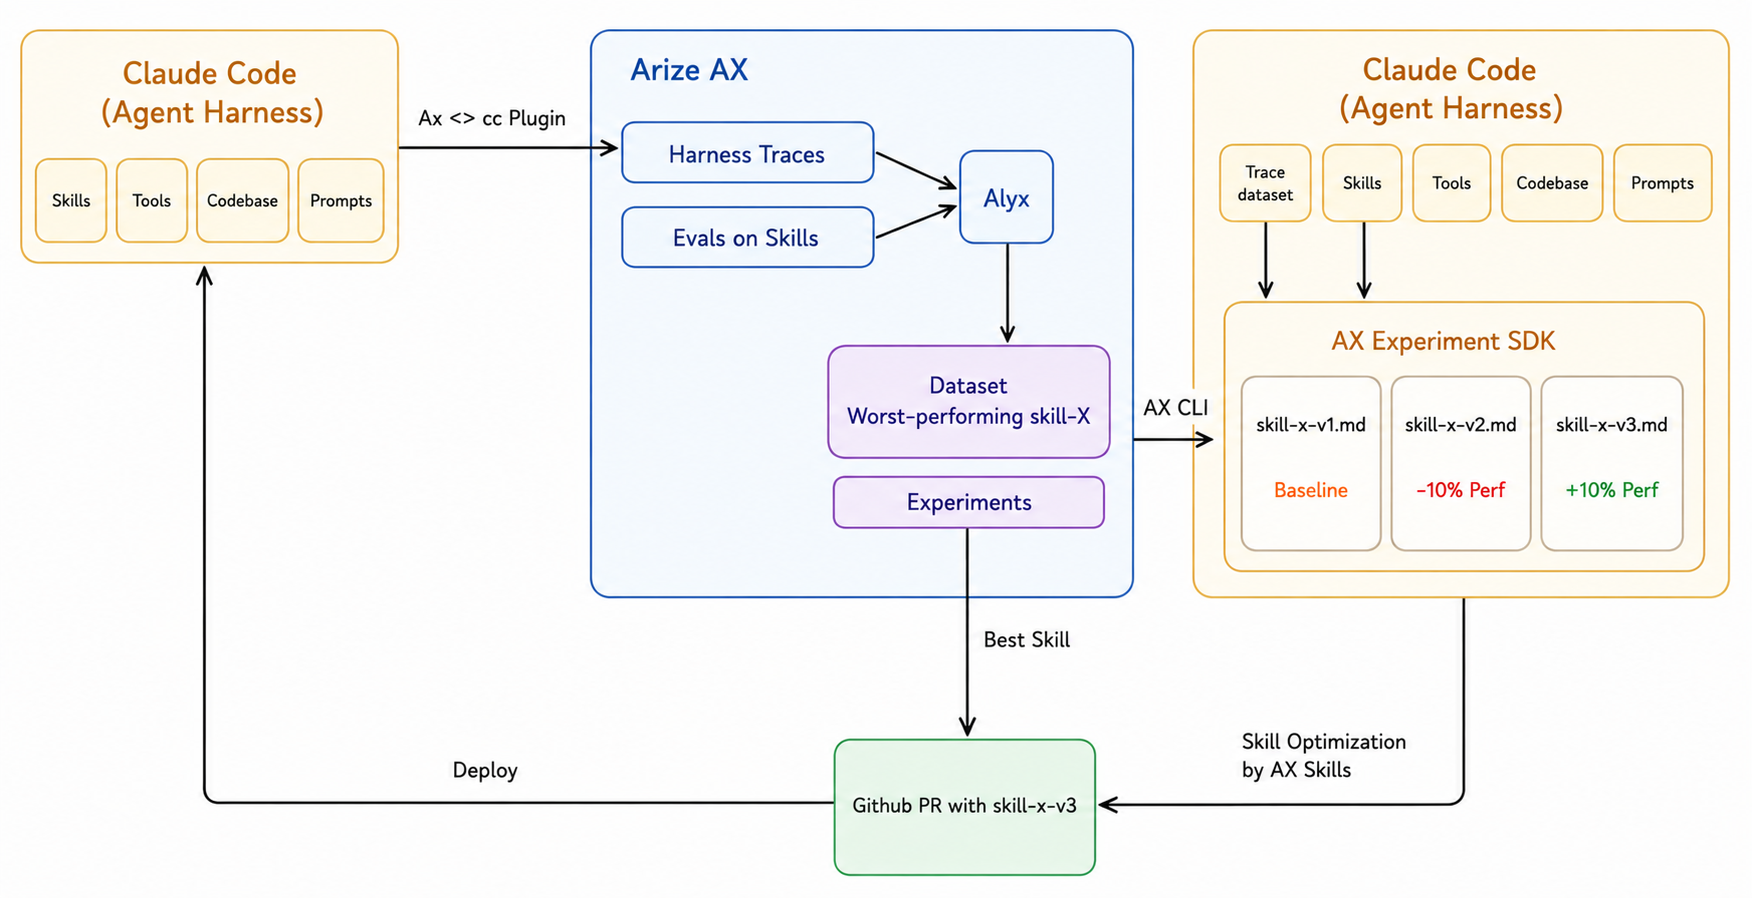
In Arize, you can collect datasets from specific operations or tool calls, such as shell commands, file edits, or command executions, then run side-by-side experiments to compare workflow changes. For example, you might collect traces from several bug-fix tasks and compare:
- Claude Code vs. Cursor on the same task set
- a short prompt vs. a structured prompt
- with and without a test-running MCP server
- with and without a project-specific skill
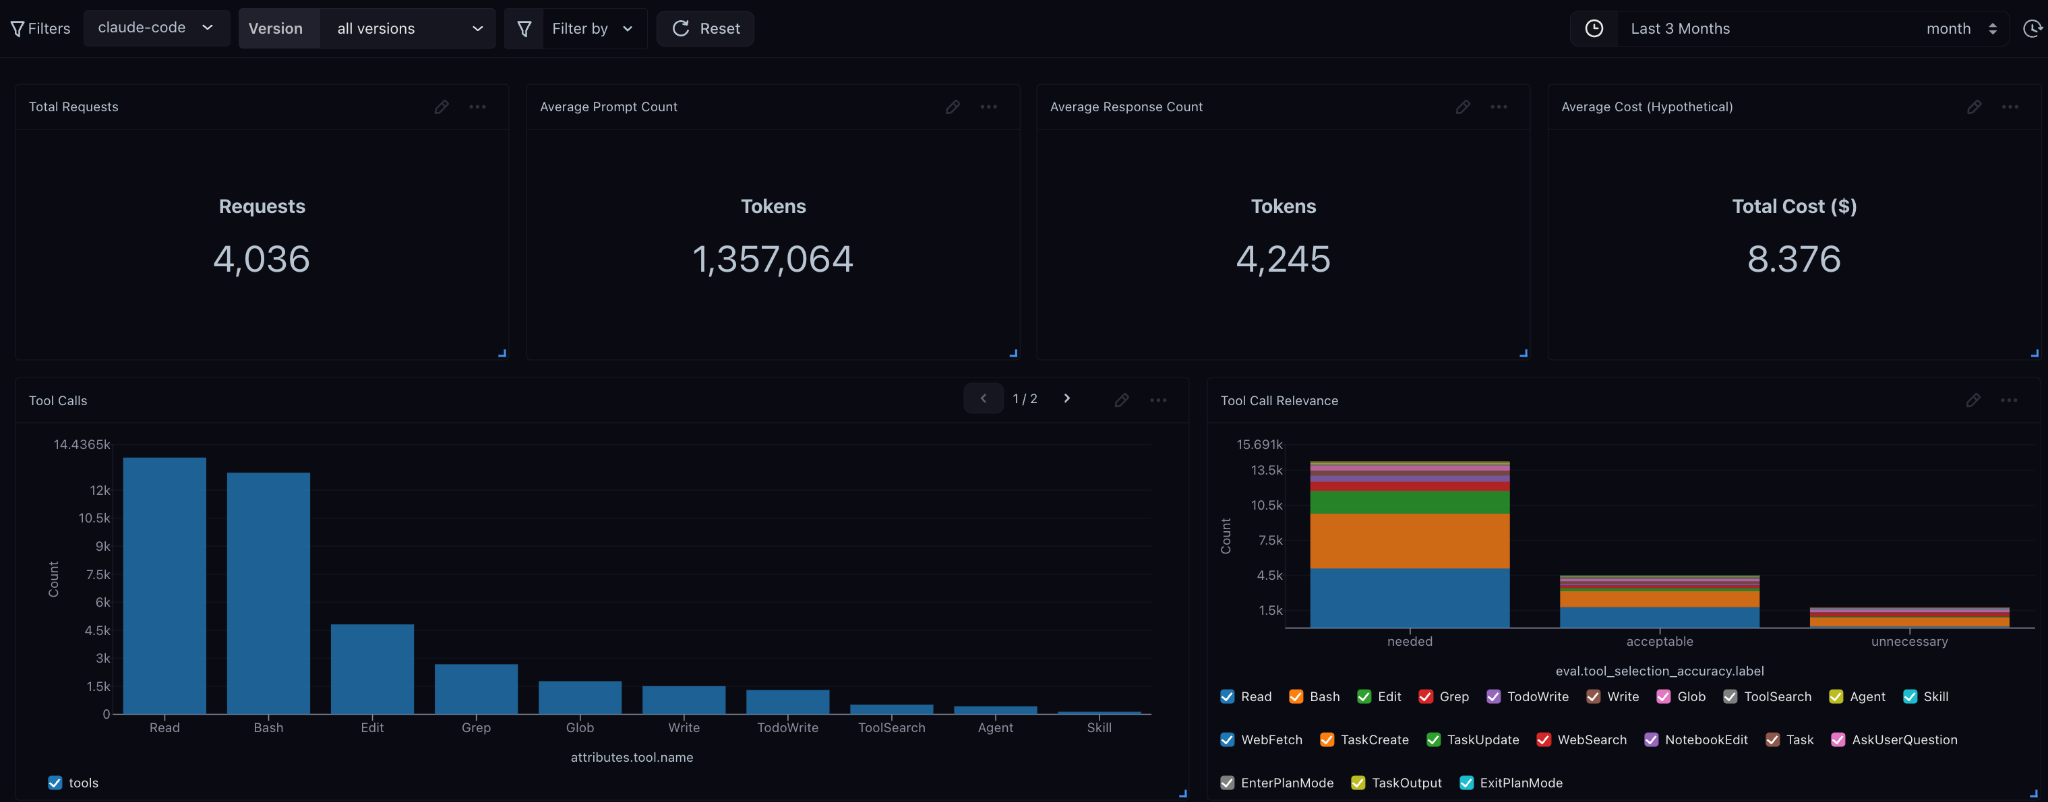
This is a relatively new and unexplored domain, so these are just examples. The insights you can capture with tracing data are solely dependent on how you make use of the tools. (For instance, you can track hypothetical cost of usage against token pricing since Arize hooks into the underlying APIs and pricing tables.)
From there, dashboards can help track practical metrics over time: latency, token usage, tool-call volume, estimated cost, retries, and correctness.
From individual workflows to team patterns
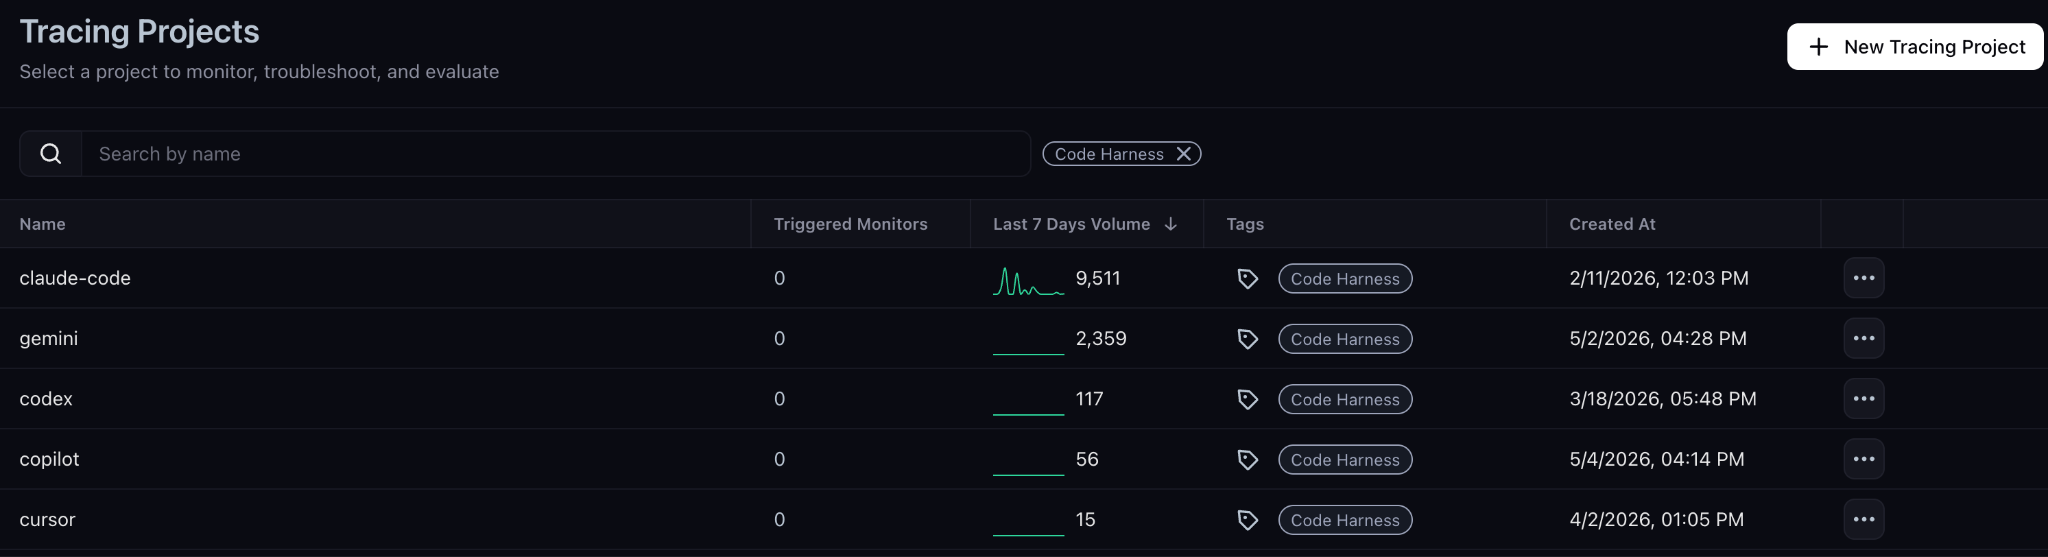
Once multiple engineers trace coding-agent sessions into the same project, teams can start identifying shared workflow patterns:
- which prompts or skills consistently work
- which workflows waste tokens or time
- where agents fail across similar tasks
- which tools improve correctness
- which practices should become team-wide defaults
This is most useful when treated as an engineering feedback loop as part of a DevEx practice with goals like improving shared workflows, building reusable skills, and increasing evaluation coverage.
Coding agents are becoming part of the software development stack. That means they need the same engineering discipline as any other system developers rely on: observability, evaluation, experimentation, and iteration.
With coding-harness-tracing, developers can move beyond anecdotal “this prompt felt better” debugging and start improving coding-agent workflows with traces, datasets, experiments, and dashboards.
Get started
Start by tracing one real workflow: a bug fix, refactor, test-generation task, or documentation update. Then inspect the trace, identify one failure mode, and run the same task again with a changed prompt, model, skill, or tool configuration.
Setting things up takes minutes. Documentation is available for each supported harness:
Want to try it yourself? Explore coding-harness-tracing on GitHub