


How To Troubleshoot LLM Summarization Tasks

Hakan Tekgul
ML Solutions Engineer
This blog is co-authored by Xander Song, Developer Advocate at Arize
Follow along in the Colab version of this blog
Introduction
Large language models (LLMs) are revolutionizing the field of AI, with over half of machine learning teams planning production deployments of LLMs over the next year. One of the most common use cases of LLMs is text summarization. From automatically summarizing clinical notes for an electronic medical record to helping attorneys condense lengthy depositions and legal filings, LLMs show tremendous promise and are already boosting human productivity in powerful ways.
Unfortunately, a lot can go wrong in production. This blog walks through how to find the root-cause of LLM performance issues for a summarization task by analyzing prompt-response pairs. To help with that task, we will be using Arize-Phoenix: an open source library offering ML observability in a notebook for surfacing problems and fine tuning generative LLM, CV and tabular models.
Large Language Model Summarization Task
Imagine you’re responsible for your media company’s summarization model that condenses daily news into concise summaries for a daily digest newsletter sent to all subscribers. Your model’s performance has recently declined, leading to negative feedback from readers around the globe.
Phoenix helps you find the root-cause of LLM performance issues by analyzing prompt-response pairs.
In this tutorial, you will:
- Download curated LLM data for this walkthrough
- Compute embeddings for each prompt (article) and response (summary)
- Calculate ROUGE-L scores to evaluate the quality of your LLM-generated summaries against human-written reference summaries
- Use Phoenix to find articles that your LLM is struggling to summarize
⚠️ This tutorial runs faster with a GPU.
Let’s get started!
Install Dependencies and Import Libraries
First, let’s install Phoenix and the Arize SDK, which provides convenient methods for extracting embeddings and computing LLM evaluation metrics.
!pip install -q "arize-phoenix" "arize[AutoEmbeddings, LLM_Evaluation]"Next, let’s import libraries.
from arize.pandas.embeddings import EmbeddingGenerator, UseCases
from arize.pandas.generative.llm_evaluation import sacre_bleu, rouge
import pandas as pd
import phoenix as px
Download the Data
Next, let’s download your production data — splitting it into two dataframes, one containing older baseline data and the other containing the most recent data. Inspect a few rows of your baseline data.
df = pd.read_parquet(
   "http://storage.googleapis.com/arize-assets/phoenix/datasets/unstructured/llm/summarization/llm_summarization.parquet"
)
baseline_df = df[:300]
recent_df = df[300:]
baseline_df = baseline_df.reset_index(
   drop=True
)  # recommended when using EmbeddingGenerator.generate_embeddings
recent_df = recent_df.reset_index(
   drop=True
)  # recommended when using EmbeddingGenerator.generate_embeddings
baseline_df.head()
The columns of the dataframe are:
- prediction_timestamp
- article: the news article to be summarized
- summary: the LLM-generated summary created using the prompt template: “Please summarize the following document in English: {article}”
- reference_summary: the reference summary written by a human and used to compute ROUGE score
Compute Rouge Score and LLM Evaluation Metrics
Compute ROUGE-L scores to compare the LLM-generated summary with the human-written reference summary. A high ROUGE-L score means that the LLM’s summary closely matches the human reference summary.
def compute_rougeL_scores(df: pd.DataFrame) -> pd.Series:
   return rouge(
       response_col=df["summary"],
       references_col=df["reference_summary"],
       rouge_types=["rougeL"],
   )["rougeL"]


baseline_df["rougeL_score"] = compute_rougeL_scores(baseline_df)
recent_df["rougeL_score"] = compute_rougeL_scores(recent_df)
Compute Embeddings for Prompts and Responses
Next, let’s compute embeddings for the articles and summaries.
generator = EmbeddingGenerator.from_use_case(
   use_case=UseCases.NLP.SUMMARIZATION,
   model_name="distilbert-base-uncased",
)
baseline_df["article_vector"] = generator.generate_embeddings(text_col=baseline_df["article"])
baseline_df["summary_vector"] = generator.generate_embeddings(text_col=baseline_df["summary"])
recent_df["article_vector"] = generator.generate_embeddings(text_col=recent_df["article"])
recent_df["summary_vector"] = generator.generate_embeddings(text_col=recent_df["summary"])
Launch Phoenix
Now, let’s define a schema to tell Phoenix what the columns of your dataframe represent (tags, prompts, responses, etc.). See the docs for guides on how to define your own schema and API reference on phoenix.Schema and phoenix.EmbeddingColumnNames.
schema = px.Schema(
   timestamp_column_name="prediction_timestamp",
   tag_column_names=[
       "rougeL_score",
       "reference_summary",
   ],
   prompt_column_names=px.EmbeddingColumnNames(
       vector_column_name="article_vector", raw_data_column_name="article"
   ),
   response_column_names=px.EmbeddingColumnNames(
       vector_column_name="summary_vector", raw_data_column_name="summary"
   ),
)
Next, create Phoenix datasets that wrap your dataframes with schemas that describe them.
baseline_ds = px.Dataset(dataframe=baseline_df, schema=schema, name="baseline")
recent_ds = px.Dataset(dataframe=recent_df, schema=schema, name="recent")
Finally, launch Phoenix. Follow the instructions in the cell output to open the Phoenix UI in the notebook or in a new browser tab.
session = px.launch_app(primary=recent_ds, reference=baseline_ds)Find the Root-Cause of Your Model Performance Issue
Leveraging Phoenix, finding the root-cause of your LLM’s performance issue is relatively straightforward.
Click on “article_vector” to go to the embeddings view for your prompts (the input news articles).

Select a period of high drift.

Then, color your data by the “rougeL_score” dimension. The problematic clusters have low ROUGE-L score in blue, the well-performing clusters have high ROUGE-L score in green.
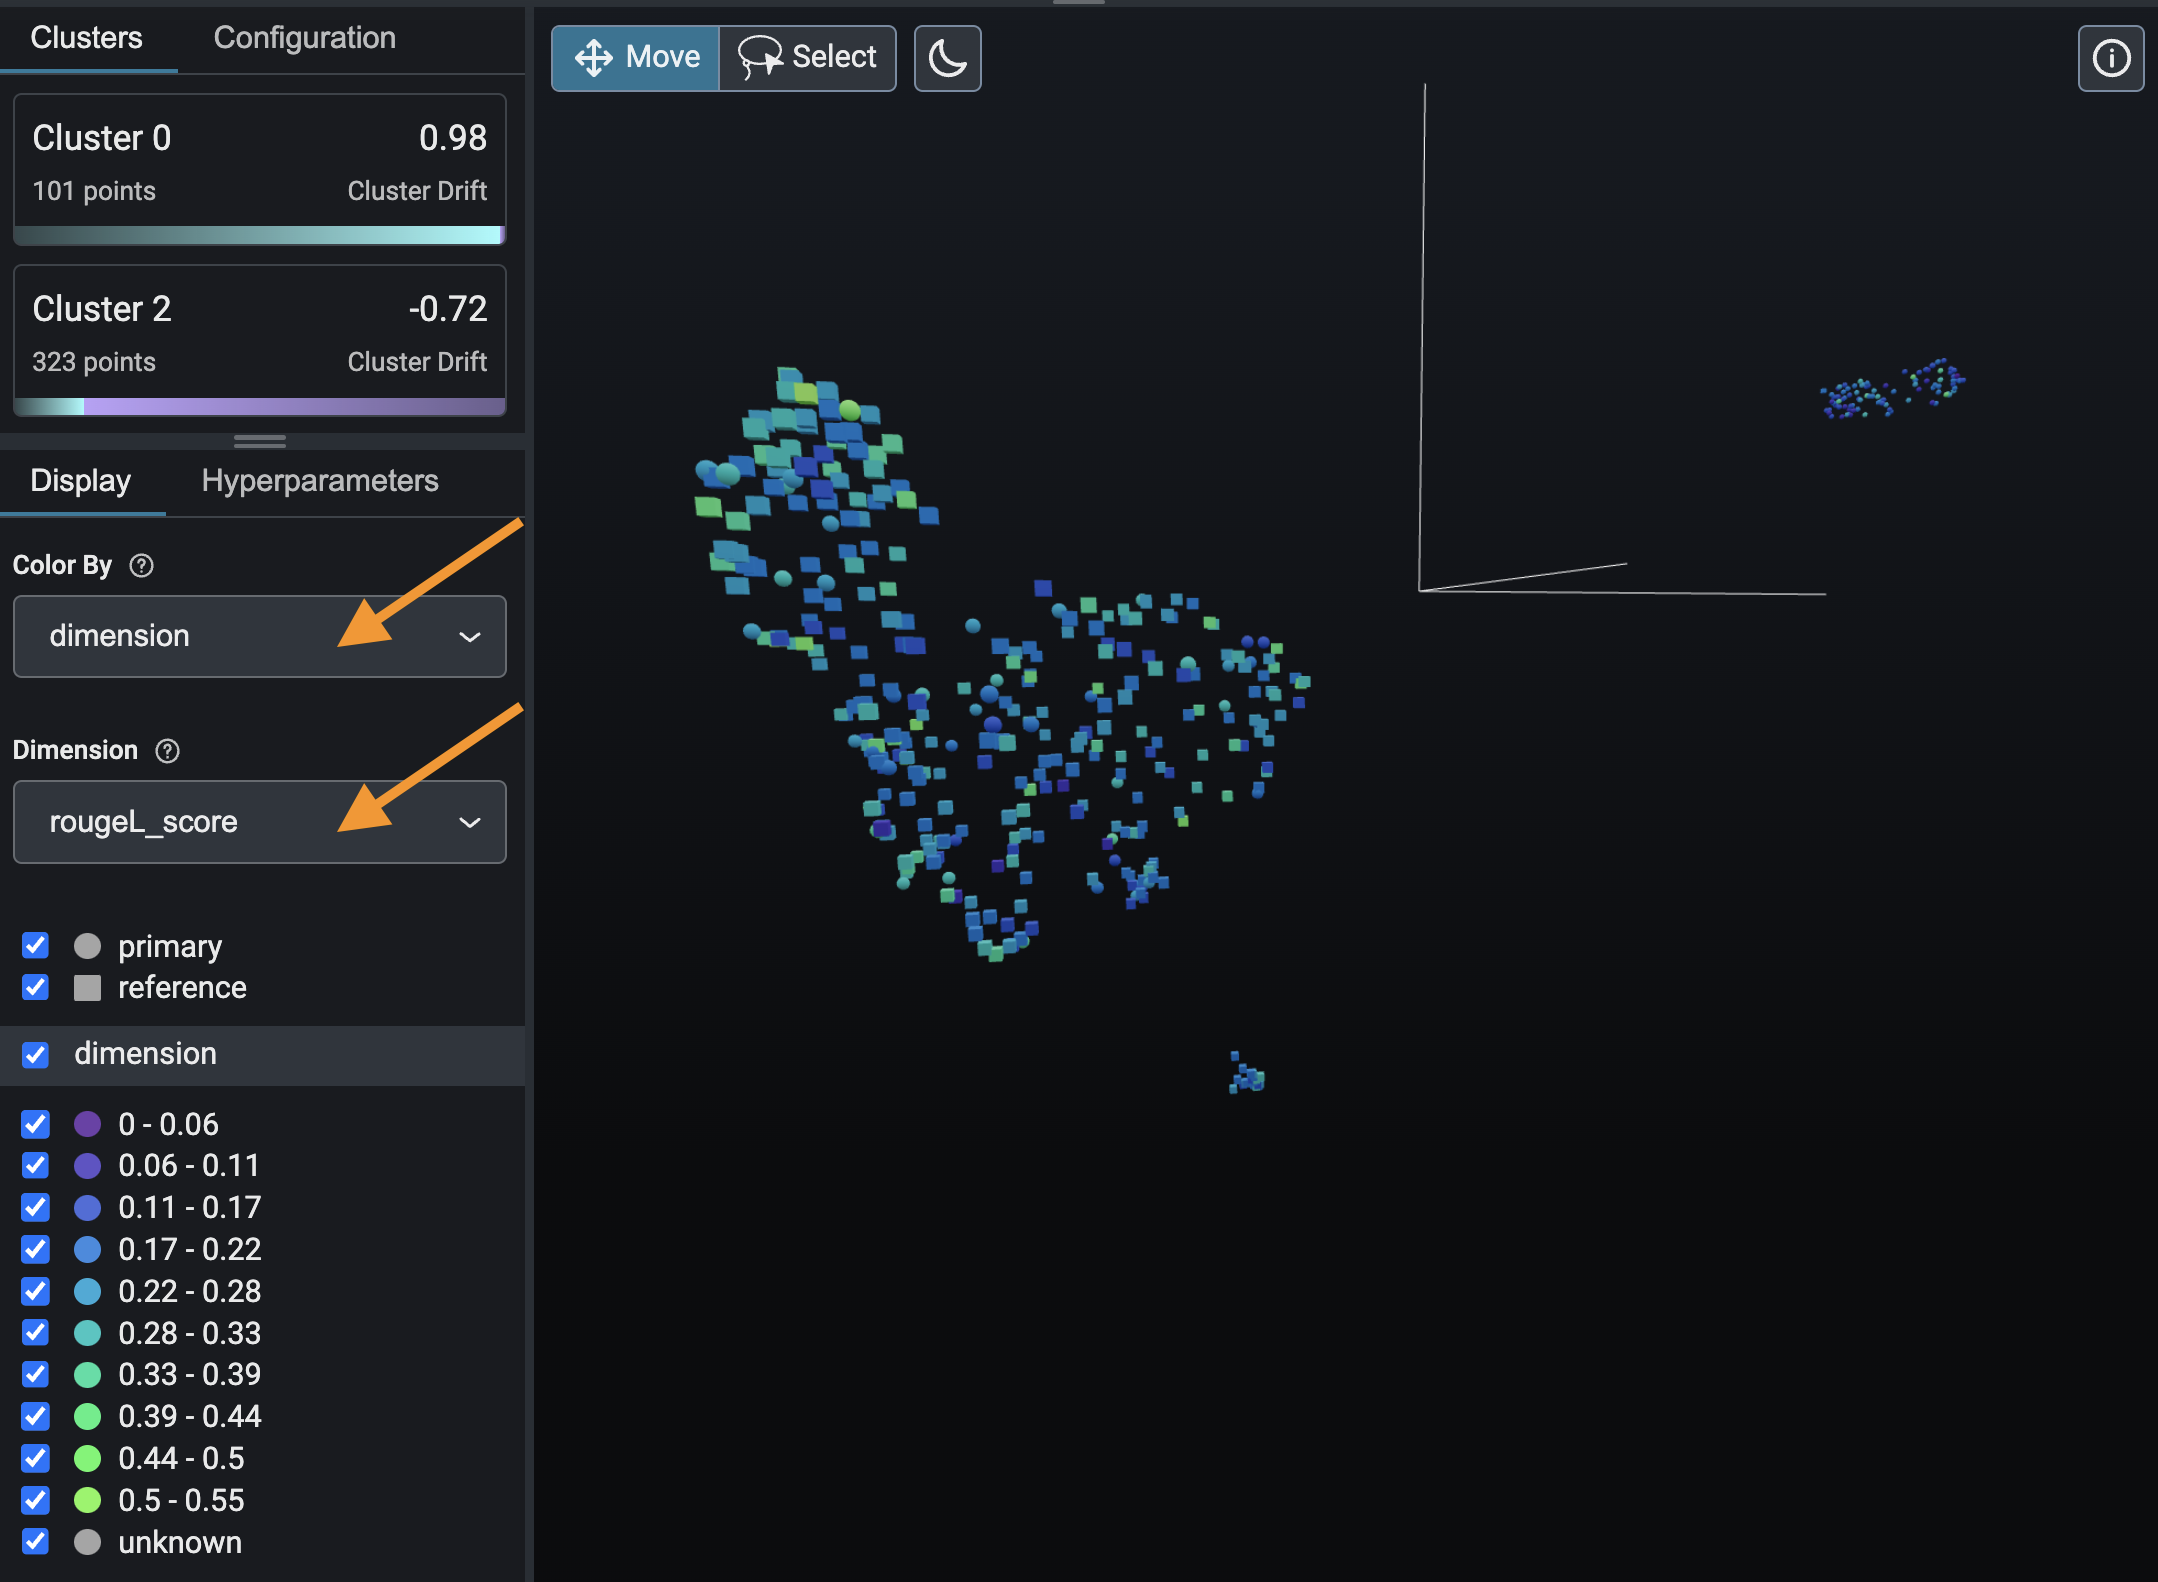
Next, use the lasso to select part of your data and inspect the prompt-response pairs.

From there, select each cluster in the left panel and look at the prompt-response pairs. Notice that the LLM is doing a good job summarizing the English articles in the green cluster (high ROUGE-L score), but is struggling to summarize Dutch articles in the blue cluster (low ROUGE-L score).

Congrats! You’ve discovered that your LLM is struggling to summarize news articles in Dutch. You should modify your prompt template to see if you can improve your ROUGE-L score for Dutch articles or exclude articles in Dutch from the daily newsletter for the time being.
Conclusion
To recap, this code-along blog explored the process of identifying performance issues in a large language model (LLM) for text summarization using Arize-Phoenix. By analyzing prompt-response pairs and evaluating ROUGE-L scores, we discovered that the LLM struggled to summarize Dutch news articles, leading to low scores. This finding highlights the importance of monitoring LLM performance and identifying specific areas of weakness. By modifying prompt templates, we can improve the model’s overall performance.