Evaluate multi-step agents with new query filters
June 22, 2026 New Evaluators When you create an online evaluation task on traces or sessions, you can now use multi-span queries, the same filter model as multi-span filters on the Tracing page, to define relationships between spans and choose which traces to evaluate. Instead of asking “does this trace contain a retriever and an LLM?” you can ask “did the retriever directly call the LLM?” or “did the agent call a tool before the final answer?” This is the same intuitive pattern-matching you already use when searching traces, now built into online eval tasks.- Span relationships — combine up to five named span filters with operators such as
=>(direct parent),->(happened before),AND, andORto express how spans connect, not just that they coexist. - Variable mapping by span role — map each evaluator input (for example, question, context, and answer) to the subquery that should supply it.
Easily view full sessions from labeling queues
June 22, 2026 New Annotations Labeling queue records now include a View Session action alongside View Trace whenever the underlying span carries a session ID. This means reviewers can open the complete session (every trace in the conversation) directly from a queue item, with the originating trace highlighted, so they can annotate with full context instead of judging a single trace in isolation.- View Trace or View Session — choose the level of context directly from the queue record’s source-data menu.
- Originating trace highlighted — the session view scrolls to and highlights the trace the queue record came from.
Fixes and improvements
June 18–24, 2026 Evaluators- Fix Session-level evaluators can now be run from the Use Evaluator slideover, which previously left the Run button disabled.
- Fix Online tasks running multiple span-level evaluators now stamp each eval span with its own eval name, so eval results filter correctly in dashboards.
- Fix Experiment runs launched from the playground no longer fail when template variables are supplied through per-example overrides.
- Improvement External audio attachments now play in the span view even when the waveform preview can’t be generated.
- Fix Clicking the text inside a rich-text table cell now activates the row, matching the rest of the row’s click behavior.
- Improvement Alyx now recovers gracefully from query timeouts with a retry prompt instead of failing.
- Fix Large synthetic datasets generated by Alyx now render their apply widget reliably instead of stalling.
- Improvement Alyx now asks follow-up questions through interactive prompts and places reference links at the end of its responses.
- Improvement The Python SDK’s
list_examples()method now supports cursor pagination, so you can export large datasets in batches instead of loading every example at once. See the Datasets client documentation. - Fix The Python SDK no longer writes datasets to the local cache when caching is disabled, restoring
list_examples()andlist_runs()on read-only filesystems such as AWS Lambda. - Improvement The annotation endpoints (
annotatefor spans, dataset examples, experiment runs, and annotation queues) graduated from alpha to beta in the Go and TypeScript SDKs. - Improvement The Python SDK now tailors its async-execution guidance to your Python version, recommending sync execution on Python 3.14+ where
nest_asynciois unsupported.
The Go SDK v2 is now generally available with full feature parity
June 17, 2026 New SDKs and REST APIs The Go SDK v2 has reached general availability and now covers every resource available in the Python and TypeScript SDKs — tasks, evaluators, prompts, experiments, datasets, annotation queues, spans, organizations, and more. Go teams can automate the full Arize workflow natively, without switching languages or reaching for the REST API directly. The code example below shows how to initialize the Go SDK v2 client:Populate annotation queues with traces
June 16, 2026 New Annotations You can now add whole-trace records to an annotation queue, not just spans and dataset examples. This unblocks trace-level human review, allowing you to queue every trace in a time window for annotation. Visit the labeling queues documentation to learn more.See active traces as they run with in-progress trace support
June 12, 2026 New Tracing and Sessions Traces that are still mid-flight, or missing a root span due to out-of-order ingestion, now appear in the Traces table. Long-running agent workflows are visible as they run, and orphaned spans no longer vanish while waiting for their root span to arrive.- Active traces — long-running workflows appear in the table while still executing, not just after they complete.
- Orphaned spans surface immediately — when the root span hasn’t arrived yet, the earliest span holds the row until it does.
- Status labels — each trace is clearly marked complete, in-progress, or orphaned.
Add Claude Fable 5 to your prompts and evaluations
June 10, 2026 New Models and Integrations Claude Fable 5 is now available in the model selector for Anthropic, so you can run prompts and LLM-as-a-judge evaluations on Anthropic’s latest model. You can adopt Claude Fable 5 across the playground and evaluators without custom model configuration, and cost tracking works out of the box.- Anthropic provider — select Claude Fable 5 anywhere you choose a model, backed by your Anthropic integration.
- Cost tracking included — input, output, and cache token pricing for Claude Fable 5 is preloaded for both Anthropic and Vertex AI.
Reuse Custom Metrics across models, projects and dashboards
June 10, 2026 Deprecation Custom Metrics Custom Metrics are now managed at the space level from a single Custom Metrics page, and the legacy per-model custom metrics flow has been removed. You can now define a metric once and reuse it across every model, project, dashboard, and monitor in the space, instead of recreating it per model.- Space-level management — create, edit, and browse all custom metrics from the Custom Metrics page in the sidebar.
- Per-model flow removed — the Custom Metrics tab on individual model and project overview pages, along with the per-model create and edit pages, is no longer available; recreate any metrics you still need at the space level.
Append runs to an existing experiment from the SDK
June 9, 2026 New Datasets and Experiments You can now append runs to an experiment that already exists, using the new append-runs method in the Python, TypeScript, and Go SDKs. This change allows you to incrementally add results to an experiment as they finish, instead of recomputing and re-logging the whole experiment each time.- Up to 1,000 runs per request — each run references an existing example by
example_idand supplies itsoutput, plus any extra fields you want to record. - Run IDs returned in order — the response includes the IDs of the newly created runs in input order.
- Python
- TypeScript
- Go
Manage evaluation tasks directly from the Go SDK
June 9, 2026 New SDKs and REST APIs The Go SDK adds a Tasks subclient with full CRUD and asynchronous run management, bringing evaluation-task automation to Go alongside the existing Python support. This means you can create, trigger, poll, and cancel online evaluation tasks programmatically from Go services, so you can score runs on a schedule or on demand without manual steps in the UI.- Full lifecycle — list, get, create, update, and delete evaluation and run-experiment tasks.
- Async run control — trigger runs over a chosen data window, poll until completion, and cancel in-progress runs.
Plan for the API key status rename from “deleted” to “revoked”
June 9, 2026 Breaking SDKs and REST APIs The API key status valuedeleted has been renamed to revoked across the REST API, SDKs, and UI. If you filter API keys by status, update your integrations: querying status=revoked now returns soft-deleted keys, and status=deleted returns an HTTP 400 error.
- Update filters — replace
deletedwithrevokedwherever you query or display API key status. - SDK enums updated — the
ApiKeyStatusenum in the Python, TypeScript, and Go SDKs now usesrevoked.
Create and edit labeling queues conversationally with Alyx
June 9, 2026 New Alyx Alyx can now list, create, and edit labeling queues from the chat, presenting an editable queue form you confirm before any change is applied. Set up human review workflows by describing what you want in natural language, without leaving the conversation to configure queues by hand.- Conversational setup — ask Alyx to create or update a labeling queue and review the proposed configuration before accepting it.
- Jump to the queue — open the created queue directly from a link in Alyx’s response.
Edit and resend messages in an Alyx conversation
June 9, 2026 New Alyx You can now edit a message you already sent to Alyx and resend it, and the conversation will be updated in place. You can correct or refine a prompt without restarting the thread, so Alyx continues from your revised message.- Edit in place — hover any message to edit and resend it.
- Safe branching — when a response included a widget, editing forks the thread and archives the original so earlier results are preserved.
Fixes and improvements
June 8–10, 2026 Evaluators- Improvement Running a single evaluator now opens the run confirmation modal scoped to that evaluator instead of firing the run immediately.
- Fix The back button on the evaluator detail page returns to the previous page correctly.
- Fix Data quality monitors persist comparison-window filters even when the primary window has none.
- Fix Clearing a monitor’s evaluation-window input no longer resets it to zero.
- Fix Unsaved new widgets are discarded when the edit form is closed.
- Fix Session- and trace-level eval counts no longer overcount in span-level aggregations.
- Fix The
CONTAINSfilter on string-list columns matches list elements case-insensitively, so trace and dashboard counts agree.
- Fix You can remove a stuck prompt from Alyx’s context.
- Fix Alyx no longer emits runaway text when a model returns a stop signal as plain text.
- Fix Creating evaluators and fixing variable mappings works from the trace slideover and sessions page.
- Improvement The Python SDK
SDKConfigurationacceptsdefault_headersto attach custom headers to all HTTP, gRPC, and Flight requests. - Improvement
ax api-keys refreshaccepts--grace-period-secondsto keep the previous key valid during rotation. - Improvement Flight-backed export commands (
spans,datasets,experiments,traces) support--allunder OAuth authentication. - Fix Dataset ingest rejects raw binary columns with a clear error before upload instead of failing mid-import.
- Fix Triggering a task without a configured LLM integration returns HTTP 400 with a clear error instead of HTTP 500.
- Fix Corrected the
axCLI snippets shown in the in-app code modals.
- Fix Table-source ingestion jobs (Snowflake, BigQuery, Databricks) are no longer auto-paused prematurely when polling with no new data.
Continuously investigate production agent failures with Signal
June 5, 2026 New Agents Signal is an always-on AI worker that continuously reviews new production traces, identifies recurring failure patterns, and groups related traces into investigation reports. Each report includes a summary, root-cause analysis, estimated impact, and suggested next steps.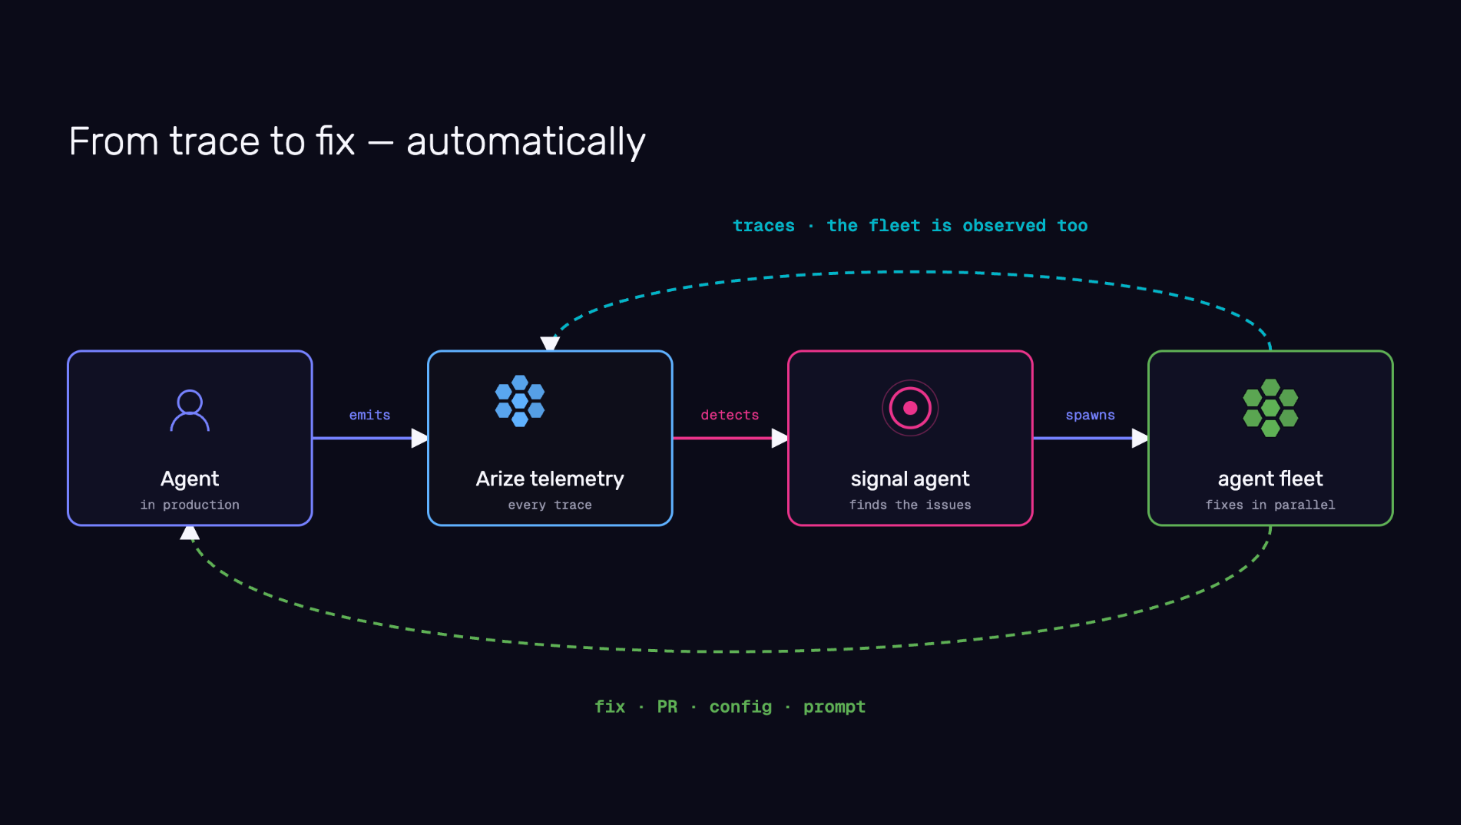
Orchestrate repo-aware managed agents across your engineering workflows
June 5, 2026 New Agents Arize AX now supports orchestrating long-running, repo-aware managed agents that inspect traces, access external systems, analyze code, create investigation artifacts, and propose changes as pull requests for human review. Teams can start with prebuilt workflows or build their own using configurable harnesses, sandboxes, repositories, skills, and automations. Repetitive investigation and analysis work, regression triage, debugging production behavior, dataset curation, eval generation, security reviews, and code remediation, can now be delegated to agents that gather evidence and propose actions, while engineers retain full control to review, approve, modify, or reject every proposal. Refer to the Agent Swarms documentation to learn more.Track managed agents in your organization from a single view
June 5, 2026 New Agents Agent Swarms provides a centralized view of managed agents in your space—active sandboxes, sessions, automations, transcripts, and trace links. As teams deploy more AI workers, visibility into what those agents are doing, how they are performing, and what resources they are consuming becomes essential. You can track long-running investigations, understand agent behavior over time, and manage your growing fleet without switching between surfaces. Check out the Agent Studio documentation to learn more.Agent Experimentation surfaces behavioral diffs across your complete agent system
June 5, 2026 New Agents Agent Experimentation lets you run curated datasets through your entire agent system and compare outputs, traces, and evaluation scores across runs. Production agents are systems made of tools, retrieval, routing, memory, models, fallbacks, application code, and business logic. A change in any layer can improve one behavior while breaking another. Each run surfaces the behavioral diff: whether tool use improved, latency shifted, retrieval quality held, or a fix for one failure introduced a regression elsewhere. Visit the agent experiments documentation to learn more.Adapt your evaluation criteria to emerging agent failures with Agent-as-a-Judge
June 5, 2026 New Agents Agent-as-a-Judge lets you describe good behavior, then uses an agentic judge to inspect traces, identify relevant spans, classify issues, and generate labels for future monitoring, evaluation, and experimentation. Traditional LLM judges work best when you already know what to measure. Agent failures are rarely that predictable. New failure modes emerge as agents interact with tools, users, and changing environments in production. Agent-as-a-Judge produces evaluation signal that adapts to what is actually breaking, not just what was anticipated. Refer to the Agent-as-a-Judge documentation to learn more.Observe, replay, and evaluate voice agent conversations natively
June 5, 2026 New Agents Arize AX now provides native support for observing, searching, replaying, and evaluating voice agent conversations. You can inspect audio sessions alongside transcripts and traces, analyze interruptions and time-to-first-audio, replay conversations end-to-end, and run evaluations directly against audio interactions. Voice agents introduce complexity beyond text. Audio streams, interruptions, speech latency, transcription quality, and multimodal interactions all become part of the agent experience. Native voice support brings voice conversations into the same observability and evaluation workflow as text agents, so you can debug, monitor, and improve conversational AI systems with the same rigor you apply to the rest of your stack. Check out the tracing and evaluating audio documentation to learn more.Design custom views for annotation queues with Alyx
June 5, 2026 New Alyx You can now give annotators exactly the view they need: describe the layout you want in plain language, and Alyx generates a custom React view for your annotation queue records with color coding, visualizations, or any presentation that fits your workflow. Views can surface specific attributes cleanly, and you can publish a view org-wide or push it to other queues. Custom Views are also available in the trace slideover for spans and traces.
Monitor org-wide traces, costs, and evals at a glance
June 5, 2026 Improvement Dashboards and Visualizations You can now monitor traces, errors, latency, cost, and eval scores across your entire organization from a single dashboard, with six new widgets, a logical two-column layout, and a customization panel that autosaves your changes.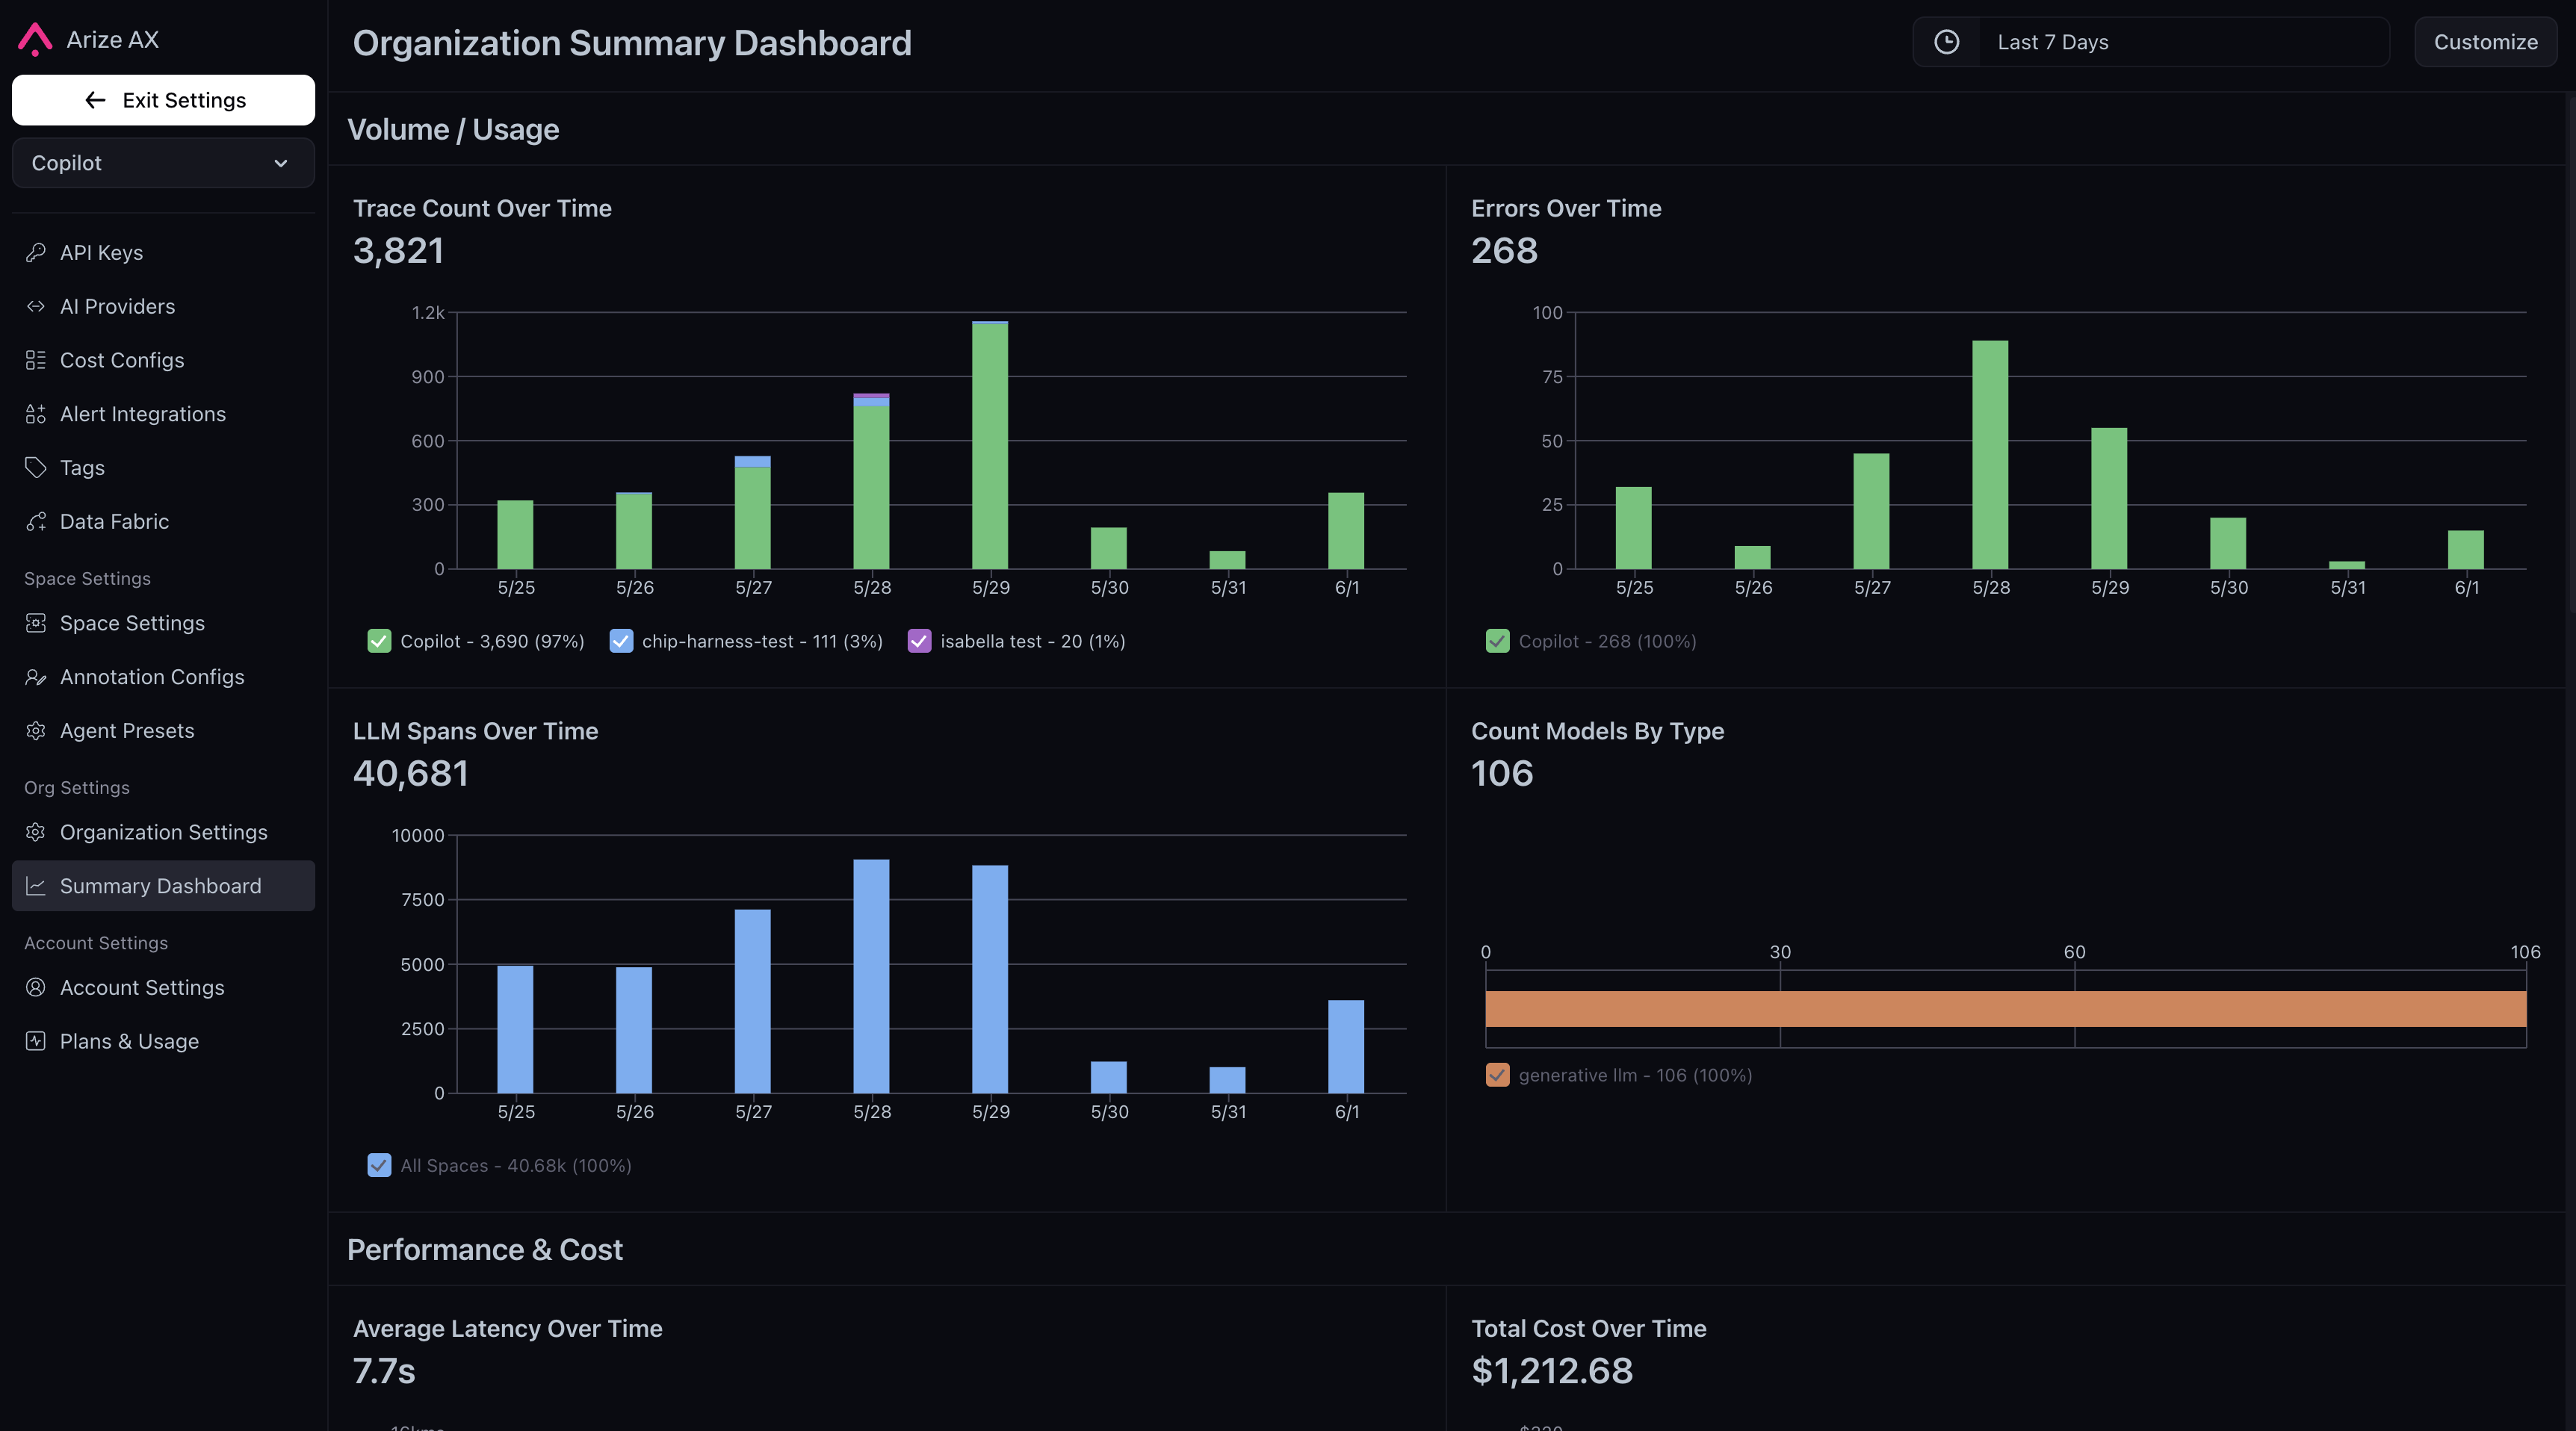
- Trace Count Over Time: stacked bar chart of root span volume across spaces, with per-day top-project tooltip drilldowns
- Errors Over Time: stacked bar chart of spans with
status_code=ERROR, broken down by space and top contributing projects - Average Latency Over Time: line chart of average latency by space with per-project tooltip drilldowns
- Total Cost Over Time: stacked bar chart of daily cost aggregates by space
- Average Eval Score Over Time: line chart with an org-level eval picker across all LLM projects
- Distribution of Eval Labels: bar chart of eval label distributions with eval and scope selection