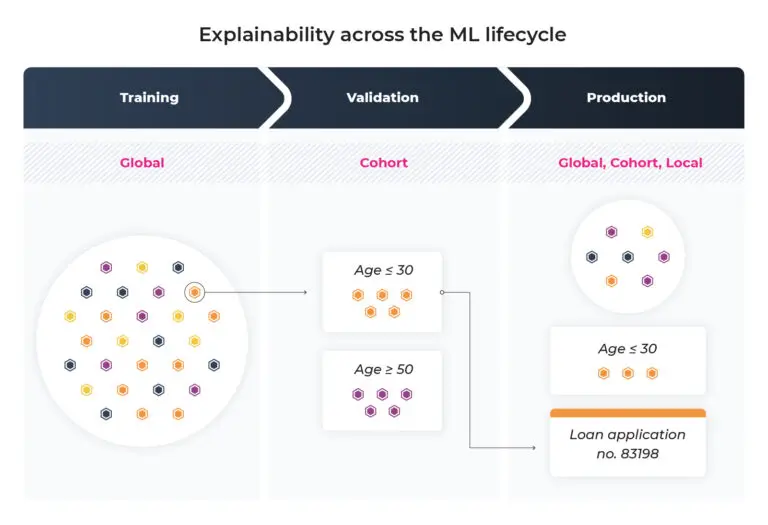
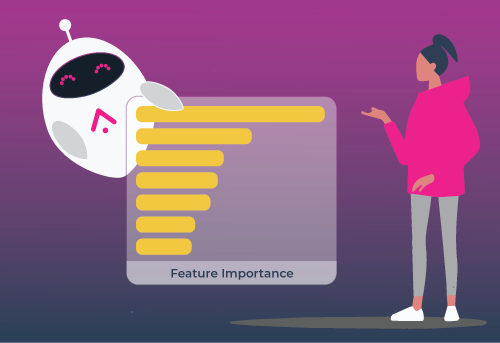
A feature performance heat map is a visual representation of the performance of each feature in a given model. It enables users to quickly see slices of performance or features that perform significantly better or worse than others for faster triangulation of issues. Heat maps color cells by metric value (error rate, SHAP magnitude, PSI) across features and cohorts so on-call engineers spot outliers without scrolling dozens of charts.
Key takeaways
- Heat maps matrix features (rows) against slices or time (columns) with color-encoded metrics.
- They accelerate triage when global metrics hide localized regressions.
- Cell definitions must match monitor math; changing bins breaks comparability across weeks.
- Pair heat maps with underlying counts to avoid chasing noise on small slices.
- Heat maps show symptoms; follow with attribution, drift, and label audits for root cause.
Typical layouts
Feature by cohort. Rows are model inputs; columns are regions, products, or user tiers; color is error rate or mean absolute SHAP.
Feature by time. Rows stay fixed; columns are weeks; color is PSI versus reference for drift review.
Feature by performance bucket. Columns are score deciles; color is label accuracy to see where inputs mislead the model.
Choose diverging color scales centered at neutral (zero SHAP, target accuracy) so direction is obvious.
Building trustworthy heat maps
Fix feature ordering (importance rank or domain grouping) so readers learn layout once.
Suppress or gray out cells with insufficient sample size.
Tooltips should show numeric value, numerator, denominator, and window dates.
Export the same data as tables for postmortems; screenshots alone lose reproducibility.
How teams use them in incidents
When accuracy drops, scan for dark cells on high-traffic cohorts intersecting high-importance features.
When drift fires, cross-reference PSI heat maps with performance heat maps to see if shifted features align with errors.
When launching in a new market, compare heat maps to training regions before trusting global metrics.
Guides on AI model lifecycle management describe where visualization layers sit in monitoring architecture.
Classification launch posts such as shipping image classification models with confidence promote slice dashboards that heat maps summarize.
Multi-stage LLM systems can heat map tool failure rates by feature tags using patterns from LLM and agent evaluation platforms.
Pitfalls
Overplotting hundreds of sparse categorical levels creates unreadable grids; aggregate rare levels.
Autoscaling color per column hides cross-column comparison; use shared scales when comparing cohorts.
Treating SHAP heat maps as causal maps leads to wrong remediation.
Stale model version labels on historical columns misattribute fixes.
Tooling integration
Export heat map underlying tables to notebooks for statistical tests on cell differences. Visual patterns should lead to quantified comparisons.
Automate weekly PNG or dashboard snapshots for compliance archives where slice stability must be demonstrated.
Colorblind-safe palettes and text annotations on extreme cells improve accessibility for incident reviews.
Connecting to retrain decisions
Use heat maps to prioritize labeling spend: cohorts with dark error cells and high traffic rank first for annotation budget.
Practitioner checklist
Before changing production settings, confirm labels, thresholds, and monitor windows match the definitions used in your last offline eval. Snapshot dashboards when incidents start so postmortems compare apples to apples.
Run slice-level reviews on high-traffic cohorts weekly even when global metrics look flat. Many failures appear first in one locale, product line, or prompt route.
Document model version, featurizer hash, and data window in every incident ticket. Future you needs that context to interpret drift charts.
When metrics disagree (offline vs online, precision vs recall), write down the business cost of each error type before picking a fix. Metrics are proxies; costs are the decision.
Share eval harness links in release notes so support and PM teams know which golden tasks must pass before they announce improvements.
FAQ
Is a feature importance heat map the same as SHAP summary plots?
Related but not identical. Summary plots rank global importance; heat maps add a second dimension such as time or cohort.
What metrics belong in cells?
Use the metric tied to the investigation: accuracy for performance, PSI for drift, mean |SHAP| for attribution.
How many features should I show?
Enough to cover top importance and known risk fields, typically tens not thousands. Aggregate the long tail.
Can heat maps monitor LLM apps?
Yes for structured metadata features (language, route, tool name) even when raw text is high dimensional.
Should alerts fire from heat map cells?
Optional for critical slices. Many teams use heat maps for human review while scalar monitors page on-call.