- Phoenix OSS
- Pricing
- Docs
-
Learn


Quickstart guide
Overview
If you’re new to Arize, this document will be a great reference for you as you get started. Feel free to skip sections that don’t apply and go straight to the ones that pertain to you.
We hope you enjoy observing your models and find cool insights with Arize, if you get stuck or have any questions, feel free to reach out to us on our community slack channel in #arize-platform-support for assistance.
Objective
This tutorial will familiarize you with the necessary steps to start using Arize. Upon completing these steps, you will have set up your first model and gained familiarity with Arize’s core capabilities.
Step 1: Sending data
- 1.1 Identify Data to Send
- 1.2 Send Your Data
- 1.3 Verify Your Data
- 1.4 Verify You Data (cont.)
Step 2: Configure your model
- 2.1 Set Your Model Baseline
- 2.2 Set Your Default Performance Metric
Step 3. Find Insights
- 3.1 Inspect Your Model Performance Over Time
- 3.2 Explore Performance Tracing
- 3.3 Explore Drift Troubleshooting
Step 4: Set Up Monitors
- 4.1 Bulk Monitor Creation
- 4.2 Custom Monitors
Step 5: Set Up a Dashboard
- 5.1 Gain Insights
Step 1: Sending Data
1.1 Identify Data to Send
It’s important to note that Arize does not ingest your model itself; rather, it ingests the data surrounding your model. Arize can ingest training, validation, and production data, and you can send in some or all of these datasets depending on your use-case.
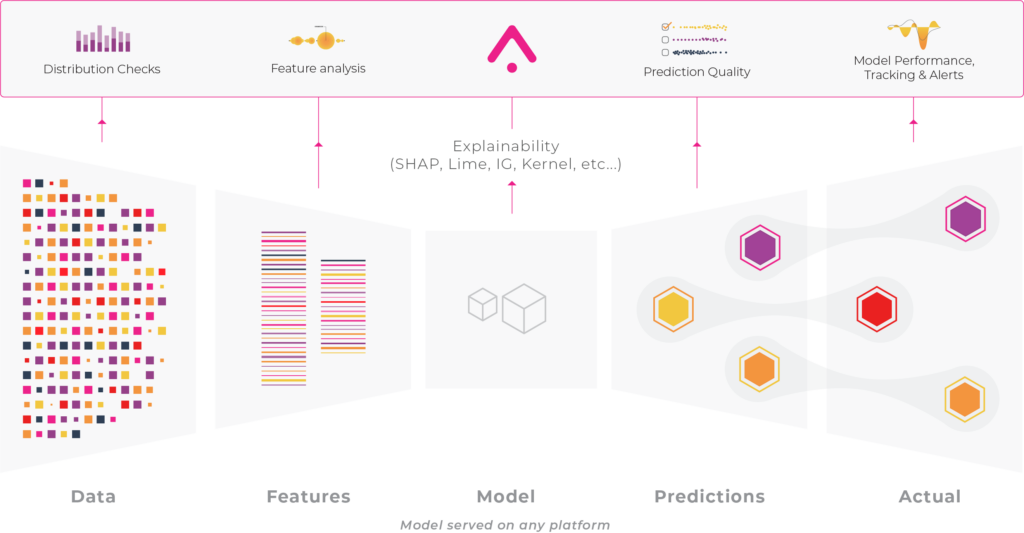
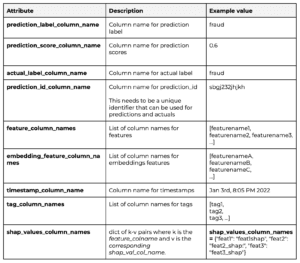
You will need to define the data columns within your dataset so Arize knows how to interpret each column (i.e. arize differentiates between predictions and features). The following model data can be sent to Arize:
(Please refer to our model schema documentation to learn about the data types)
- Model Name
- Model Version
- Model Type
- Environment
- Prediction ID
- Timestamp
- Features
- Feature Importance
- Tags
- Prediction Score / Prediction Label / Prediction Value
This table helps you map your data columns to the data schema expected by Arize.
1.2 Send Your Data To Arize
Send your data to Arize using the SDK or File importer.
SDKs
The first method of getting data in is through our SDKs. You can think of these as wrappers around our REST API, where you are pushing data via a HTTP POST. Whether you want to send data in batch or real time, both architectures are supported.
File Importer
The second method is for those teams that persist inferences in a data lake style architecture. If you store your data in a cloud bucket, you can set up a file import job (which is probably the preferred choice at Spotify) to ingest data to Arize.
⚡ Pro Tip: No matter what method you choose, continuously send your model data into the platform through a recurring data ingestion pipeline. This way, Arize receives your most up to date model data as it becomes available for real-time feedback.
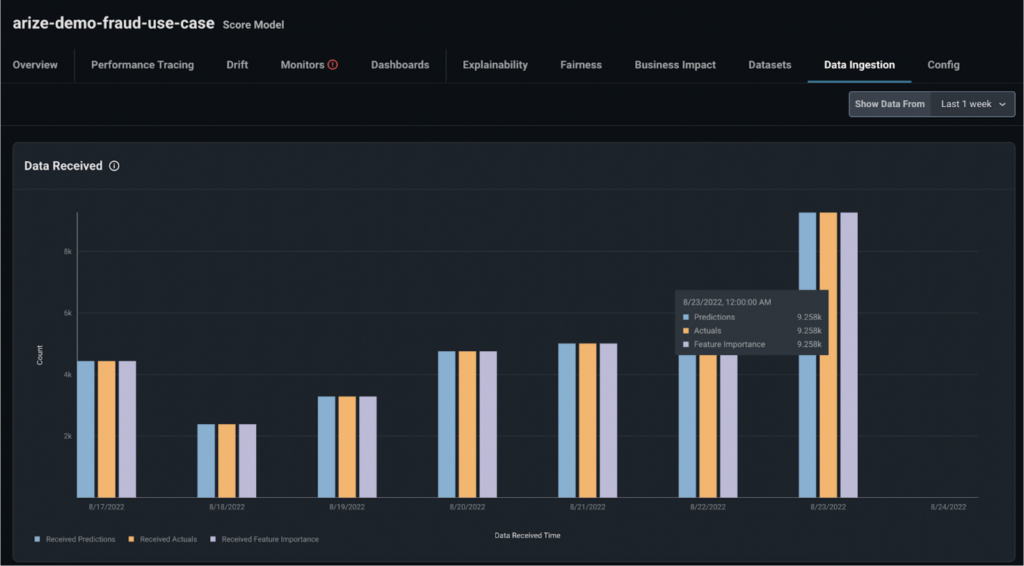
1.3 Verify Your Data in Arize
Once you send your data into the platform, verify that your data was correctly received by navigating to the ‘Data Ingestion’ tab. From there, cross check your expected values with what’s showing on the platform.
Coffee break! ☕
Once you confirm Arize received your data, sit back and relax! Your data will take a bit to be processed and indexed by Arizer before it appears everywhere in the platform. You can return after a few minutes to continue working through this tutorial.
During this time, Arize indexes and processes the data before it will show up anywhere else in the platform.
1.4 Verify Your Data (cont.)
After about 10 minutes, verify your data within the ‘Datasets’ tab.
⚡ Pro tip: We recommend uploading a small sample of data so you can verify the data looks correct in the platform before uploading larger datasets.
Keep An Eye Out
Here are some things to ask yourself as you verify your data:
- Features and Tags: What features and tags have been ingested?
- Data Type: Do the data types (numeric and categorical) and data ranges look as expected?
- Missing Values: Are there any missing values that are not expected?
- Timestamp: Does the prediction timestamp look correct?
If the data does not look right, it’s likely an issue with the data schema you sent to arize. You can jump into our model schema documentation to easily resolve the issues.
Meaningful Insights
While looking at the ‘Datasets’ tab, you may have noticed a few things that can help you set up monitors and reduce time to resolution. Some context clues include:
- Unexpected missing values in your data
- Keep this in mind when we set up data quality monitors
- Specific expectations around missing data
- Set up alerts if these expectations are violated.
Step 2. Configure Your Model in Arize
Once you set up your data ingestion pipeline, you’ll need to choose a baseline and configure your model’s performance metric. Both these things are set up in the ‘Config’ tab within your model.
Arize helps you surface, resolve, and improve your models. This takes the form of setting monitors (performance, drift, and data quality), alerting you when your models trigger, and an easy root cause analysis workflow with performance tracing. The first actionable step in the platform to achieve this is to set a baseline and pick your performance metric.
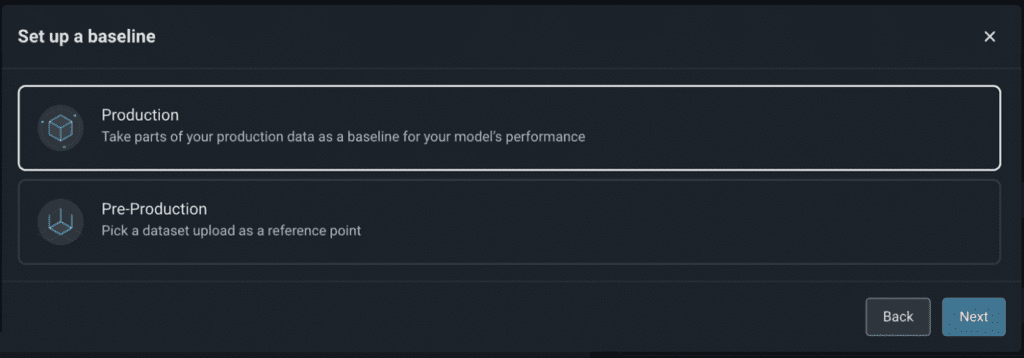
2.1 Set Your Model Baseline
A model baseline is a reference data set of either training, validation, or prior time periods in production. A baseline is a dataset used to compare against your current data. Once you set a baseline, the Arize platform can automatically detect drift, data quality issues, and anomalous performance degradations.
Your model is preset with a baseline defined by a moving time range of your model’s production data for 2 weeks delayed by 3 days. However, you can set a custom model baseline by navigating to the “Config” tab. Learn when to choose a different baseline here.
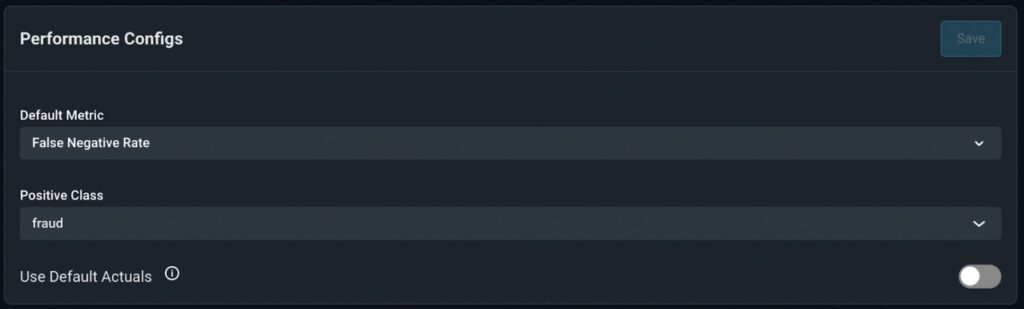
2.2 Set Your Default Model Performance Metric
Performance metrics compare how well your model should behave with how it’s actually behaving, and helps break down poor performing areas of your model for an in-depth understanding of your model’s behavior.
Under the ‘Model Baseline’ card in the ‘Config’ tab, navigate to the ‘Performance Configs’ card to choose a default performance metric for your model.
Typically, you will want the default metric to be the metric you used when training your model. Arize offers many common model performance metrics to choose from, and your default metric manifests in the performance over time chart and your performance monitor.
Step 3. Find Insights In Your Model
Once you’ve sent data into the Arize platform, set up a model baseline, and configured your default performance metric – gain immediate model insights with Performance Tracing and the Drift Tab.
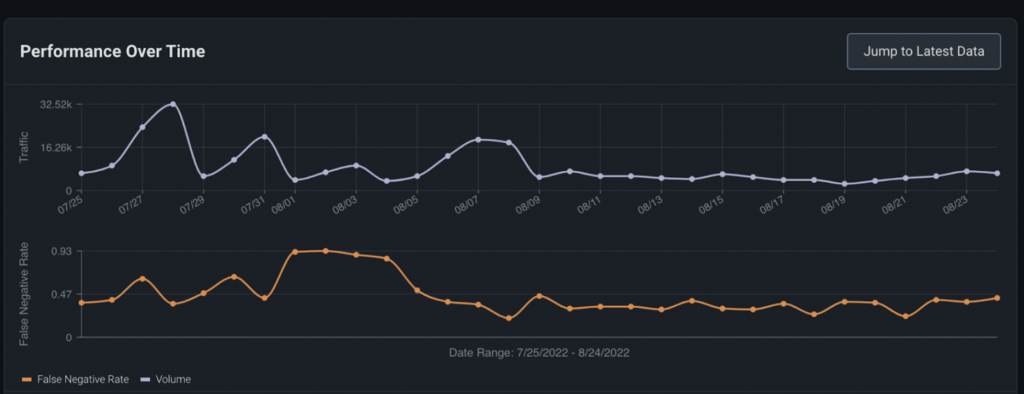
3.1 Inspect Your Model Performance Over Time
The Model Overview page gives you key model health metrics and visualizes your performance over time for at-a-glance observability. This will be the first page you land on whenever you click on a model from the home page, so get familiar with key metrics that matter to you!
Navigate to the ‘Overview’ tab to see your model performance metric plotted overtime overlaid with a timeseries chart of your prediction volume.
Pro Tip: Look for trends in your performance metric chart over time. This can help you better understand problematic areas for further analysis.
3.2 Explore Arize Performance Tracing
Performance Tracing gives you a wealth of information to resolve and improve your models. From surfacing your worst performing slices to visualizing your performance breakdown by feature and tags, this functionality in the platform helps you easily uncover areas to retrain or rebuild.
From the ‘Overview’ tab, navigate to the ‘Performance Tracing’ tab to uncover insights on your mode’s performance:
- Visualize model performance over time
- Compare model performance on multiple datasets
- Break down model performance across different cohorts within feature and tag data
Pro tip: We use ‘Cohort’ and ‘Slice’ interchangeably. They are just segments within features and tags data.
Performance tracing is a highly flexible feature that can help you drill down into specific cohorts of your model. Some useful performance workflows include:
- Comparing your production performance against your training performance
- Comparing training/validation versions against each other
- Determining which slices are affecting performance the most
* You don’t have to worry about all of these workflows now, just note that they’re there once you need them in the future. We’re also happy to help you navigate the best way to use performance tracing for your use case, just reach out to us on slack!
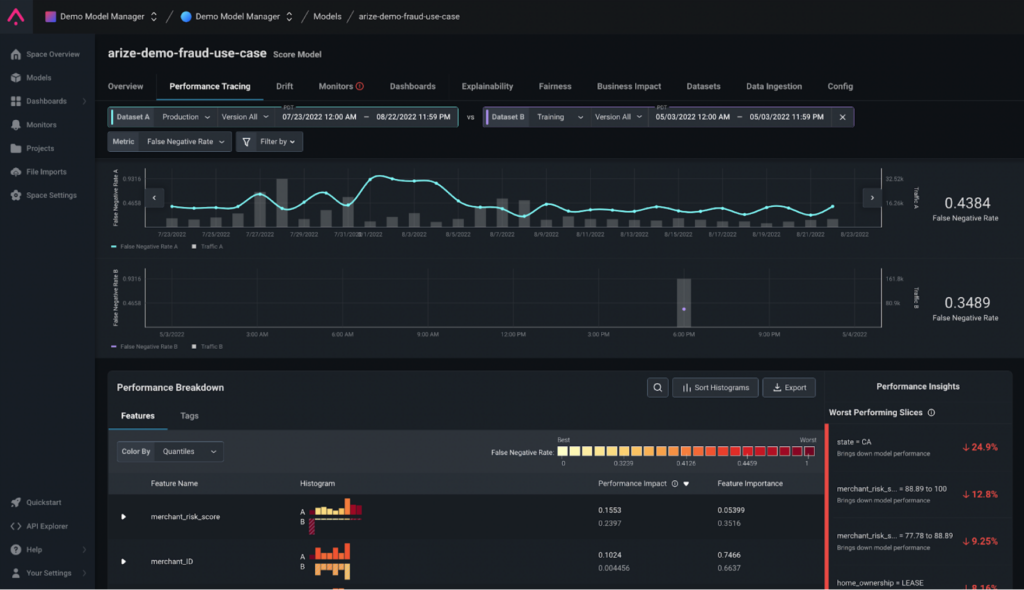
Pro tip: If you notice cohorts where your model performance is unusually high or low – this might indicate:
- An area to continually monitor (more on monitoring in the next step)
- A possible area to retrain your model with additional data improvements
3.3 Explore Arize Drift Troubleshooting
When ground truths are not present or come at a severe lag time, drift is often a great proxy metric to assess risk to a model. Not only can we look at drift at the model output level, but we can also break down drift at the feature level. In the Arize platform, we also rank up the most drifting features by weighting the feature drift, by feature importance values.
Pro Tip: ‘Ground truth’ and ‘actuals’ can be used interchangeably.
Navigate to the ‘Drift’ tab to visualize PSI plotted for your model performance. Use the Arize Drift tab to discover any drift in your data.
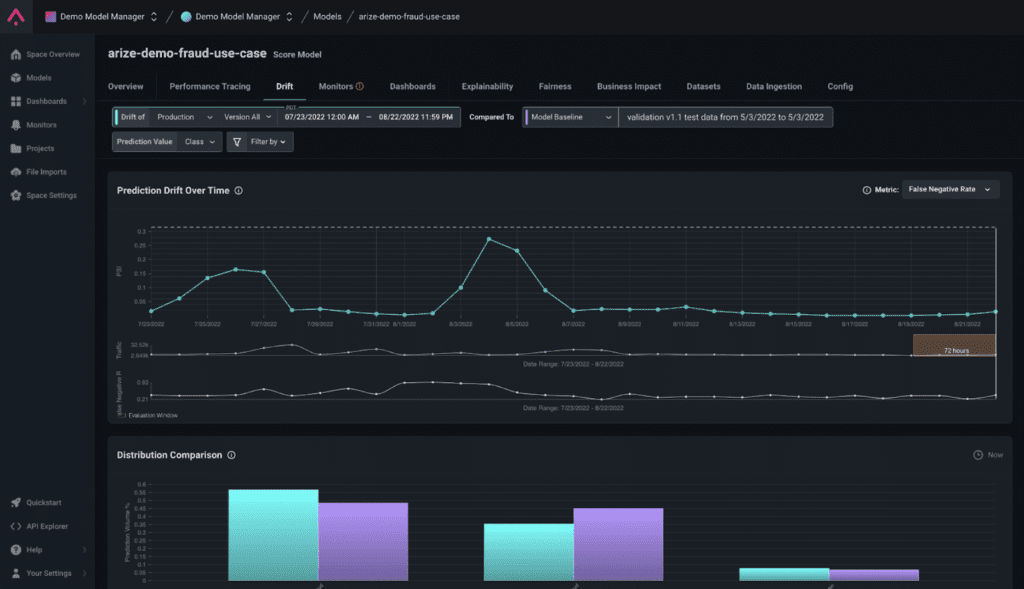
Pro Tip: Our visualizations help you easily identify where drift occurs. Click on a point in the graph in red, and scroll down to surface a distribution comparison for that point. From there, scroll down to the ‘Feature Drift’ card to uncover which features affect your model the most.
Pro Tip: If you have actuals in your data, performance tracing will be the most helpful guide. If you do not have actuals, use drift monitoring as a proxy for detecting performance degradation in your data.
Step 4. Set up Monitors
Now that you’ve taken a few notes down on some areas within your model you want to keep an eye on, and are familiar with how Arize can help you get to the root cause of your problems, let’s set up the way we catch your problems in the first place!
Even if your model performed as expected last week, yesterday, and today – monitors guarantee your model continues to predict as expected by quickly and automatically alerting you when something goes wrong. This way, you don’t have to second guess that the ball might drop any second.
Arize has three different categories of monitors.
Performance Monitors
Performance monitors allow you to troubleshoot your models performance with granularity down to the hourly level, enabling a deep understanding of your model’s problematic areas. If you receive ground truth, performance monitoring will be your bread and butter monitor to better understand how to resolve your model issues at a glance.
<a href=”https://docs.arize.com/arize/product-guides/monitors/performance-monitors”>Docs</a>
Drift Monitors
Drift monitors detect changes in data distributions. Drift can occur in both your features and in your predictions, so it’s important to account for both when analyzing how drift impacts your model. As we mentioned before, drift monitors act as a proxy metric for performance when you don’t have ground truth.
Pro tip: In most cases, use PSI as your metric to measure drift, but you can also use KL Divergence in the case that your distributions have large variance, or JS Distance if your distributions have low variance.
<a href=”https://docs.arize.com/arize/product-guides/monitors/drift-monitors”>Docs</a>
*As always, feel free reach out to us on our community slack channel in #arize-platform-support if you need help picking a drift metric.
Data Quality Monitors
Very often, bad data can be the sneaky culprate to your ML model woes. Data quality monitors ensure clean and accurate data is sourced to your model. We do this by monitoring changes in cardinality and other data quality elements to make sure your data conforms with what is expected.
Pro tip: Remember the ‘Model Overview’ page? Return to that page for at-a-glance data quality metrics.
<a href=”https://docs.arize.com/arize/product-guides/monitors/data-quality-monitors”>Docs</a>
Step 5. Set up a Dashboard
Now that you have a general understanding of how your model behaves, what to look out for, and Arize’s core functionalities – aggregate your key metrics and visualizations with dashboards.
Pro Tip: Use dashboards to answer specific questions you may have about your model. Dashboards are great assets to share across your team since you can have multiple models, metrics, and visualizations all in one place.
Create dashboards from scratch or with one of our templates. To create a new Dashboard, click the ‘Dashboards’ tab and select ‘Create Dashboard’ then click ‘Create blank dashboard’. From there, you can select between three widget types: Time Series, Distribution, and Statistic.

Time Series
Use the time series widget to graph key metrics (evaluation and data) over time to help you understand your model’s behavior.
https://docs.arize.com/arize/product-guides/dashboards/widgets/timeseries-widgets
Distribution
Choose the distribution widget to visualize the distribution of any feature, prediction, and actuals, and compare distributions against each other.
https://docs.arize.com/arize/product-guides/dashboards/widgets/distribution-widgets
Statistic
Select the statistic widget to represent an aggregate of the metric you picked. The value shown represents what you would get if you summed up all the time series data points.
https://docs.arize.com/arize/product-guides/dashboards/widgets/statistic-widgets
5.1 Gain Insights
Once you create the dashboard, you can filter your dashboard to analyze a specific cohort for an even more granular approach. To do this, select the model you want to filter by under your dashboard name, and pick between all your model versions and model dimensions.
Once you’ve identified areas to fix or improve, export your data via email to retrain, rebuild, or start anew. Cick on the ellipses icon in the top right corner of each widget and click on ‘Export data’. From there, an email will be sent to your user email with a link to your data.
Step 6: Continue Exploring Arize
Congrats on completing this tutorial! We hope you found some great model insights along the way.
This tutorial is just scratching the surface of our platform’s capabilities, continue to explore the platform by referring to our documentation: https://docs.arize.com/arize/
Please refer to the FAQ sections to search for common questions:
- https://docs.arize.com/arize/data-ingestion/data-ingestion
- https://docs.arize.com/arize/product-guides/product
Pro Tip: We’re always here to help! Work with your Arize representatives directly if you have any questions along the way, or have feedback to share.
We love collaborating with our customers! <3