
An adventure in unleashing large language models (LLMs) on tabular Kaggle competitions
This blog is co-authored by Aparna Dhinakaran, CPO and Co-Founder of Arize AI, and Christopher Brown, CEO and Founder of Decision Patterns
💡 Want to try it yourself? Follow along with this blog’s accompanying Colab ✨
Introduction
There are two distinct groups in the ML ecosystem. One works with highly organized data collected in tables – the tabular focused data scientist. The other works on deep learning applications including vision, audio, large language models (LLMs), etc. For the purposes of this piece, we call the former the “tabular” or “traditional” group and the latter the “LLM” group. Each group uses its own techniques and models that have, in large part, developed separately. With the recent successes of large language models including OpenAI’s GPT-4 and others, we wanted to see if we could use modern LLM results to help make predictions on tabular datasets.
In order to demonstrate the efficacy of the approach, we submitted results to several blind Kaggle competitions (including the popular “House Prices – Advanced Regression Techniques” competition). The typical Kaggle competition supplies tabular data and is dominated by traditional ML approaches. However, we found with little background knowledge, zero data cleaning, and zero feature development required by traditional methods, LLMs were able to return results with predictive power. LLM predictions were not competitive with the leading models produced with lengthy and extensive tabular methods, but were strong enough to place well higher than the median score on the leaderboard rankings.
We expect this to be the beginning of a number of techniques that use LLMs on tabular data and would not be surprised to see the use of LLMs in tabular data widen and compete favorably to more traditional model development processes.
Included in this write-up is the first approach we have seen that merges traditional tabular datasets and XGBoost models with LLMs using latent structure embeddings, allowing the tabular approaches to work off of the numerical “features” produced internally by the LLM.
To date, we haven’t seen an LLM used this way and hope this is the beginning of something exciting!
Challenges of Applying Deep Learning to Tabular Data
The typical machine learning application involves cleaning and training a narrow set of data typically collected, held, or acquired by an organization. At a high level, the process can be thought of developing a “context” for which only one specific type of questions can be asked. When that type of question arises, the ML model produces one or more predictions. Further improving models comes from three areas: adding more data, improving methods, or acquiring more and different features. The last is often the most interesting here, as the data scientist is generally always asking herself “what different data can I get to make my predictions better?”
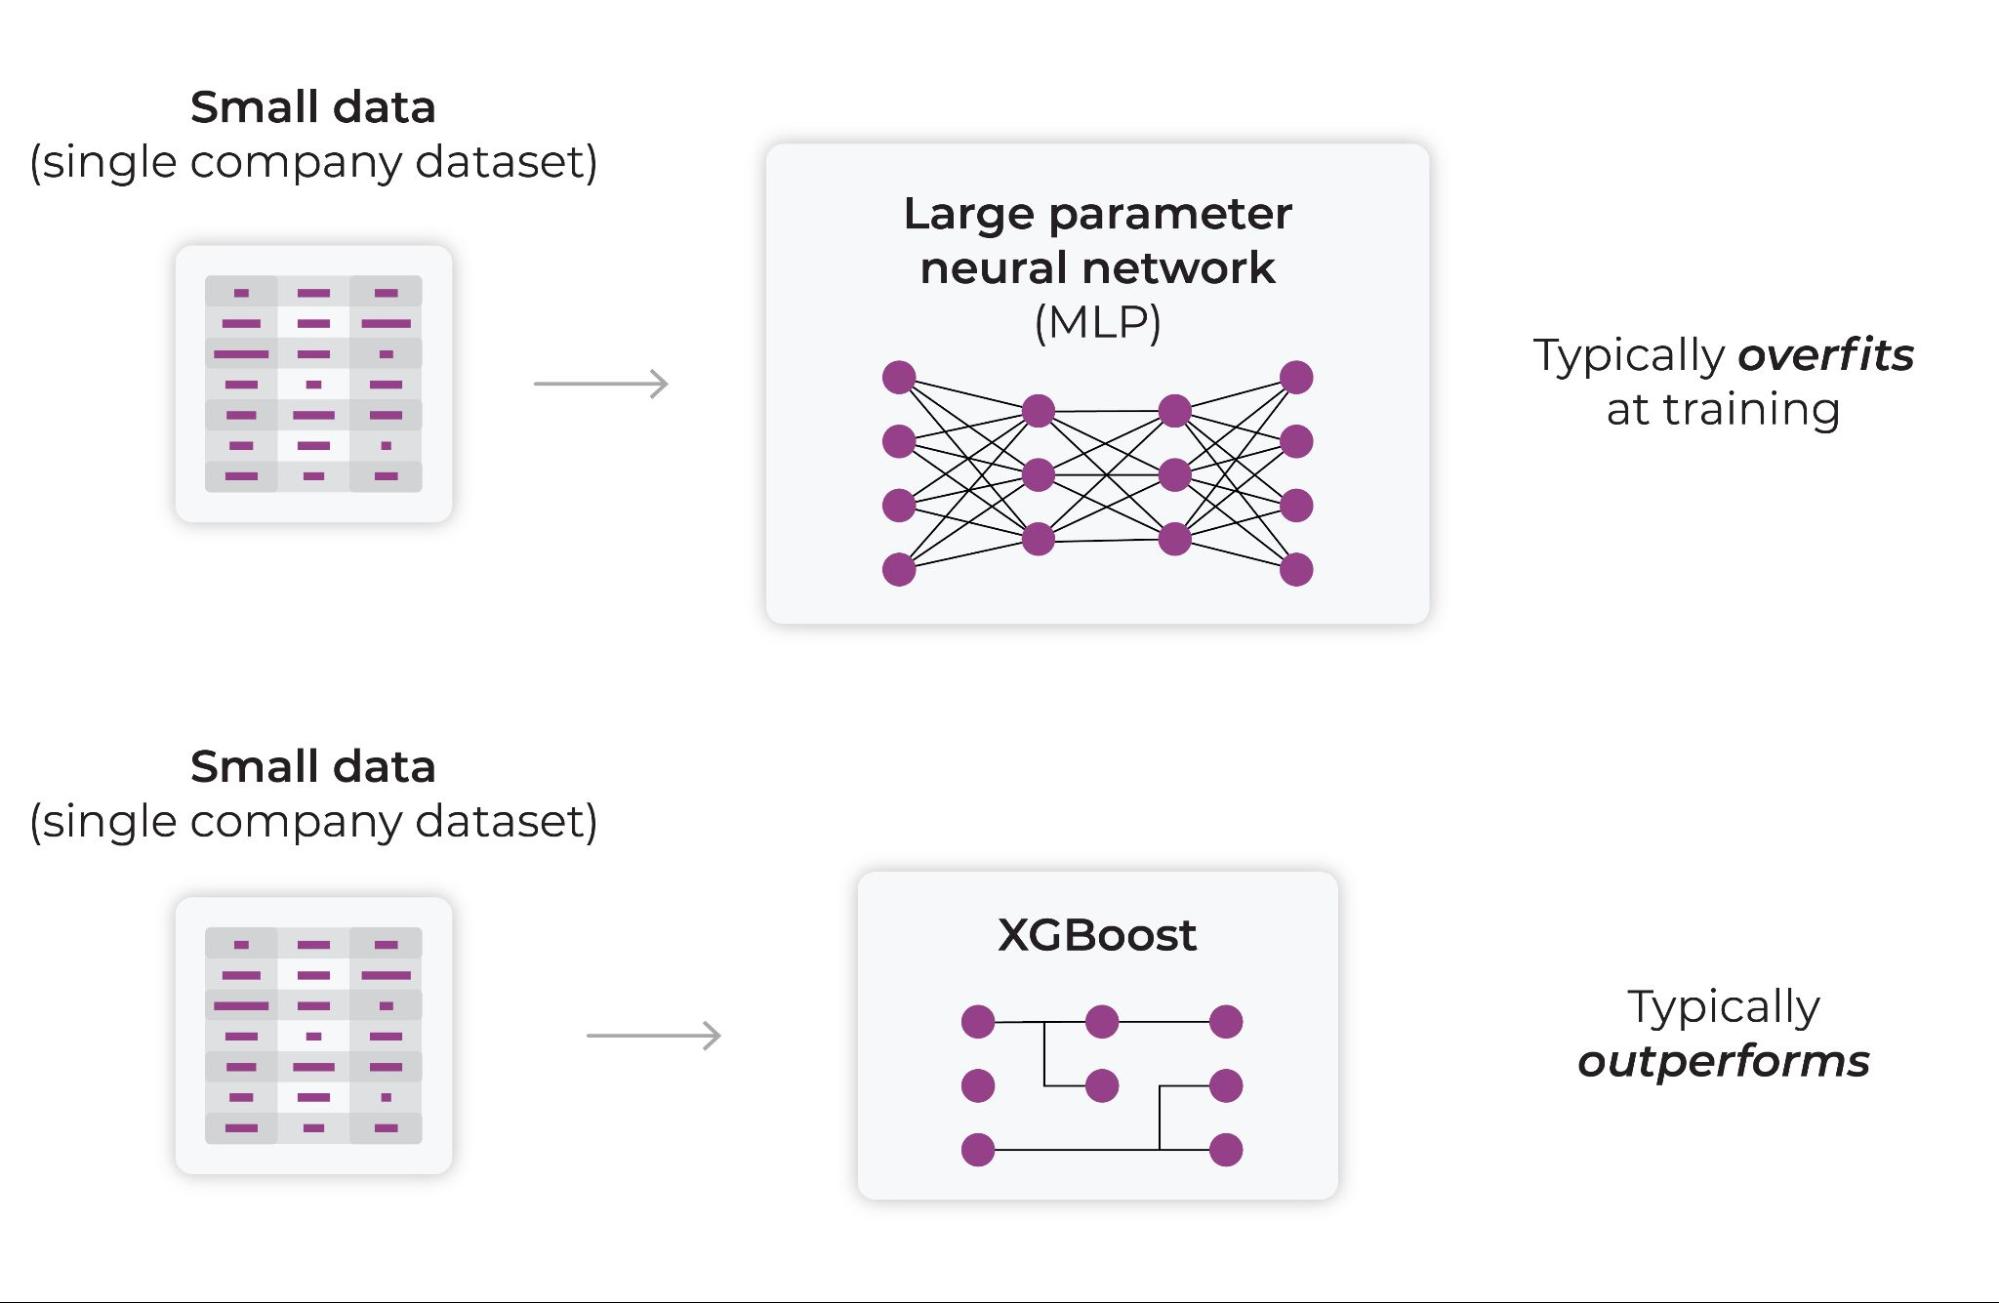
Partitioning, boosting, and/or bagging models have been developed for and do exceedingly well in this domain. Despite much effort, deep learning has not shown to be as effective in this area. Observations show that XGBoost and cousins generalize better in production, where deep learning models tend to overfit. A large number of teams have tried to improve deep learning on tabular datasets, but these efforts have largely lagged behind established, high performing tabular approaches.
Training with Narrow Data
A common deep learning approach is to apply a neural network and multilayer perceptron (MLP) to a relatively “small” dataset consisting of an organization’s data. This approach has been repeatedly shown to require more work (data scientist time), resource consumption (training time), and parameter tuning to get similar or worse performance than tabular approaches. The failure of deep learning here may be a mismatch between the approach and narrow data available to it. Deep Learning seems somewhat gated by its ability to learn from narrow data.
Applying an LLM to a Tabular Dataset – Enter Prompt Engineering
LLMs have come to the fore through two innovations. The first is the transformer architecture pioneered by Google and others. The second is the application of these architectures to colossal data sets on the order of dozens or hundreds of terabytes. A reasonable hypothesis is that these LLMs are able to sidestep the “narrow” data problem that beleaguer deep learning approaches. By training on Internet-scale data, LLMs have built an internal representation for the context of many applications. This is a needed step in order to have a model that can respond to any number of prompts. A happy and necessary consequence is that the LLMs may have developed the context for answering questions related to an organization’s prediction problems or those of a Kaggle competition.
By way of analogy, LLMs have come to understand the context of your problem in a similar way that traditional/tabular machine learning has done in its training step. Surprisingly, this has been done using a broader source of data and not the organization’s specific data. Another way to look at it is that the LLMs has trained a model capable of predictions from all the data it acquired elsewhere. To the data scientist, this provides access to a diverse dataset and a potential treasure trove of information – or they may just provide noise.
Unlocking the information in LLMs for tabular models encounters two obstacles. The first is that LLMs are accessed via prompts and prompt engineering and not tabular data (DataFrames). The second is that LLMs primarily produce textual output.
To overcome the first obstacle, we supply our tabular data through prompts. Here the prompt is created on each row of the table. The construction of the prompt is pretty simple: a paragraph comprised of sentences, one for each cell in the table row, as follows:
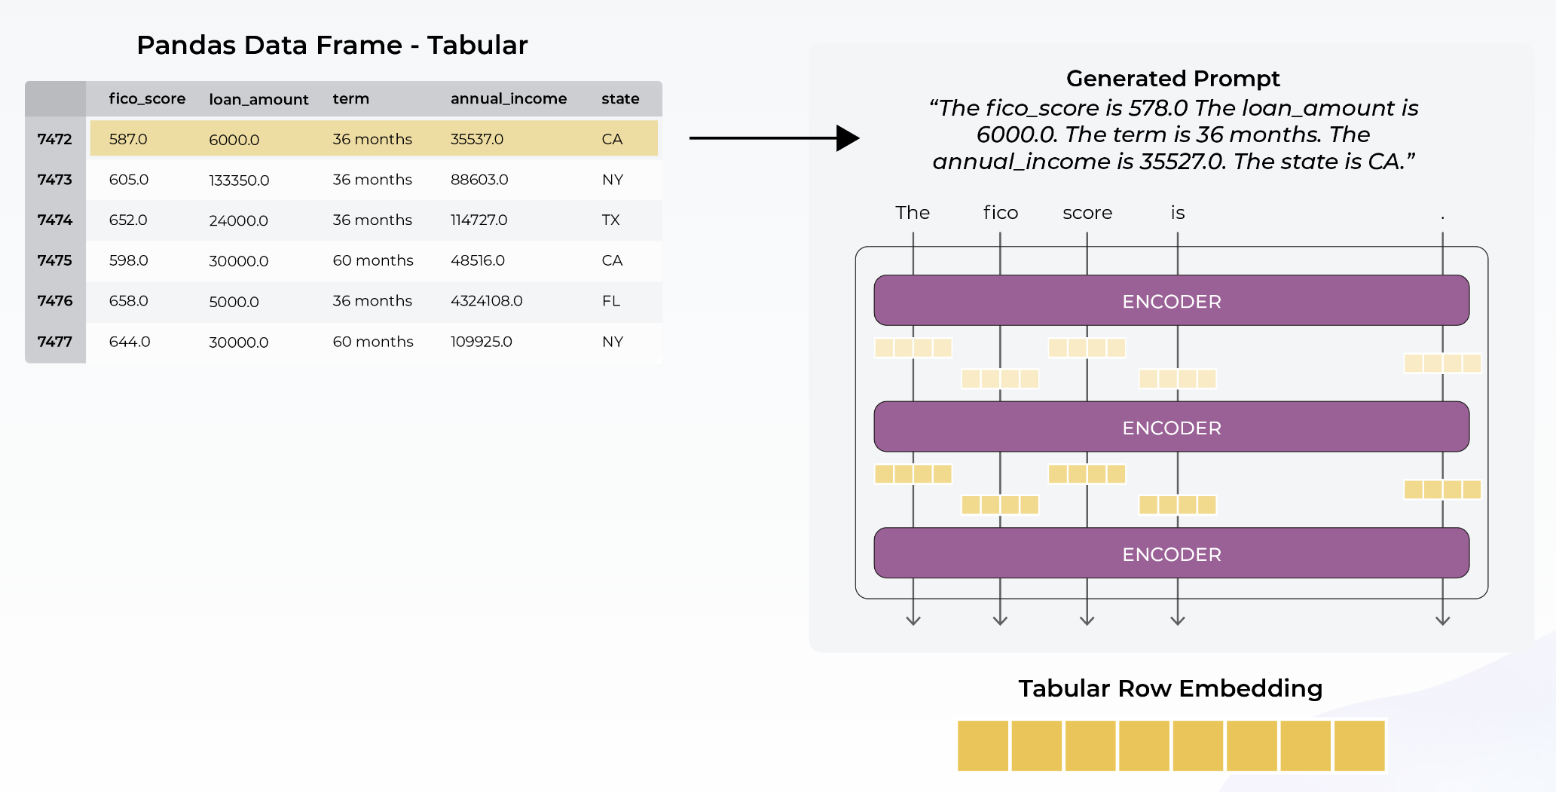
The “row” prompt consists of the following:
The is . The is . …
Two things to note:
- It is not necessary to generate prompts for training data, only the data about which the prediction needs to be made.
- It is not strictly necessary to ask what prediction will be made of the data.
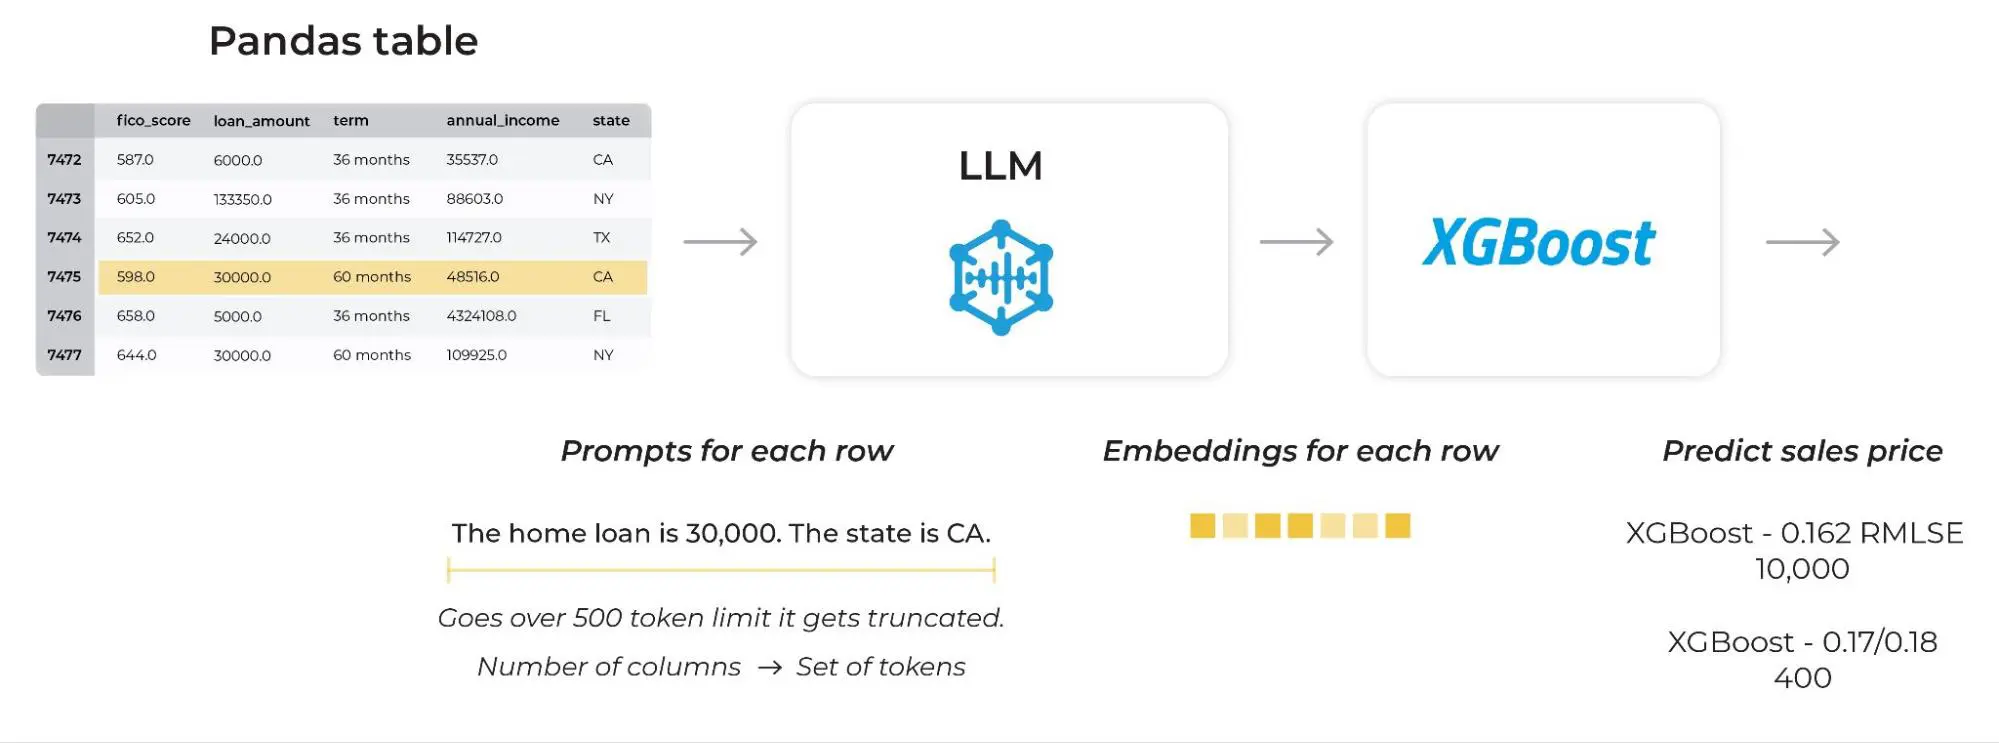
The second obstacle is that the LLMs produce textual responses. In some instances, LLMs can provide predictions. As of this writing, the predictions are not very good – likely because the LLMs that are not trained with specific predictions in mind. Instead of accessing LLM predictions, we find the flexibility to work with the features produced by the LLM preferable. In the parlance of LLMs, the features are latent structure embeddings or simply “embeddings.” These embeddings are accessible through LLM APIs. It is important to note that the embedding vectors are typically of values-per-row. Once we extract the embeddings, we can run them through a tabular model (XGBoost).
The embeddings are be used in two examples here:
- To make predictions for home prices in a Kaggle data competition (this blog)
- Measure multivariate drift and anomaly detection using embedding drift (an upcoming blog)
The LLM provides a great simple feature engineering tool available for use on any tabular dataset, essentially allowing performance gains with almost no feature engineering or parameterization.
Harnessing Big “D” Data and LLMs
In most companies, the data you are training on is small relative to the information contained across the internet.
Let’s take an example of home price prediction. Imagine the model you train learns from your data that a certain zip-code has higher priced homes. It also might learn some interesting relationships with other features, such as that homes with pools have higher selling prices. But imagine what you could say about home prices in a zip-code by gathering the entire world’s knowledge about that zip code and applying it in parallel with your current pricing model?
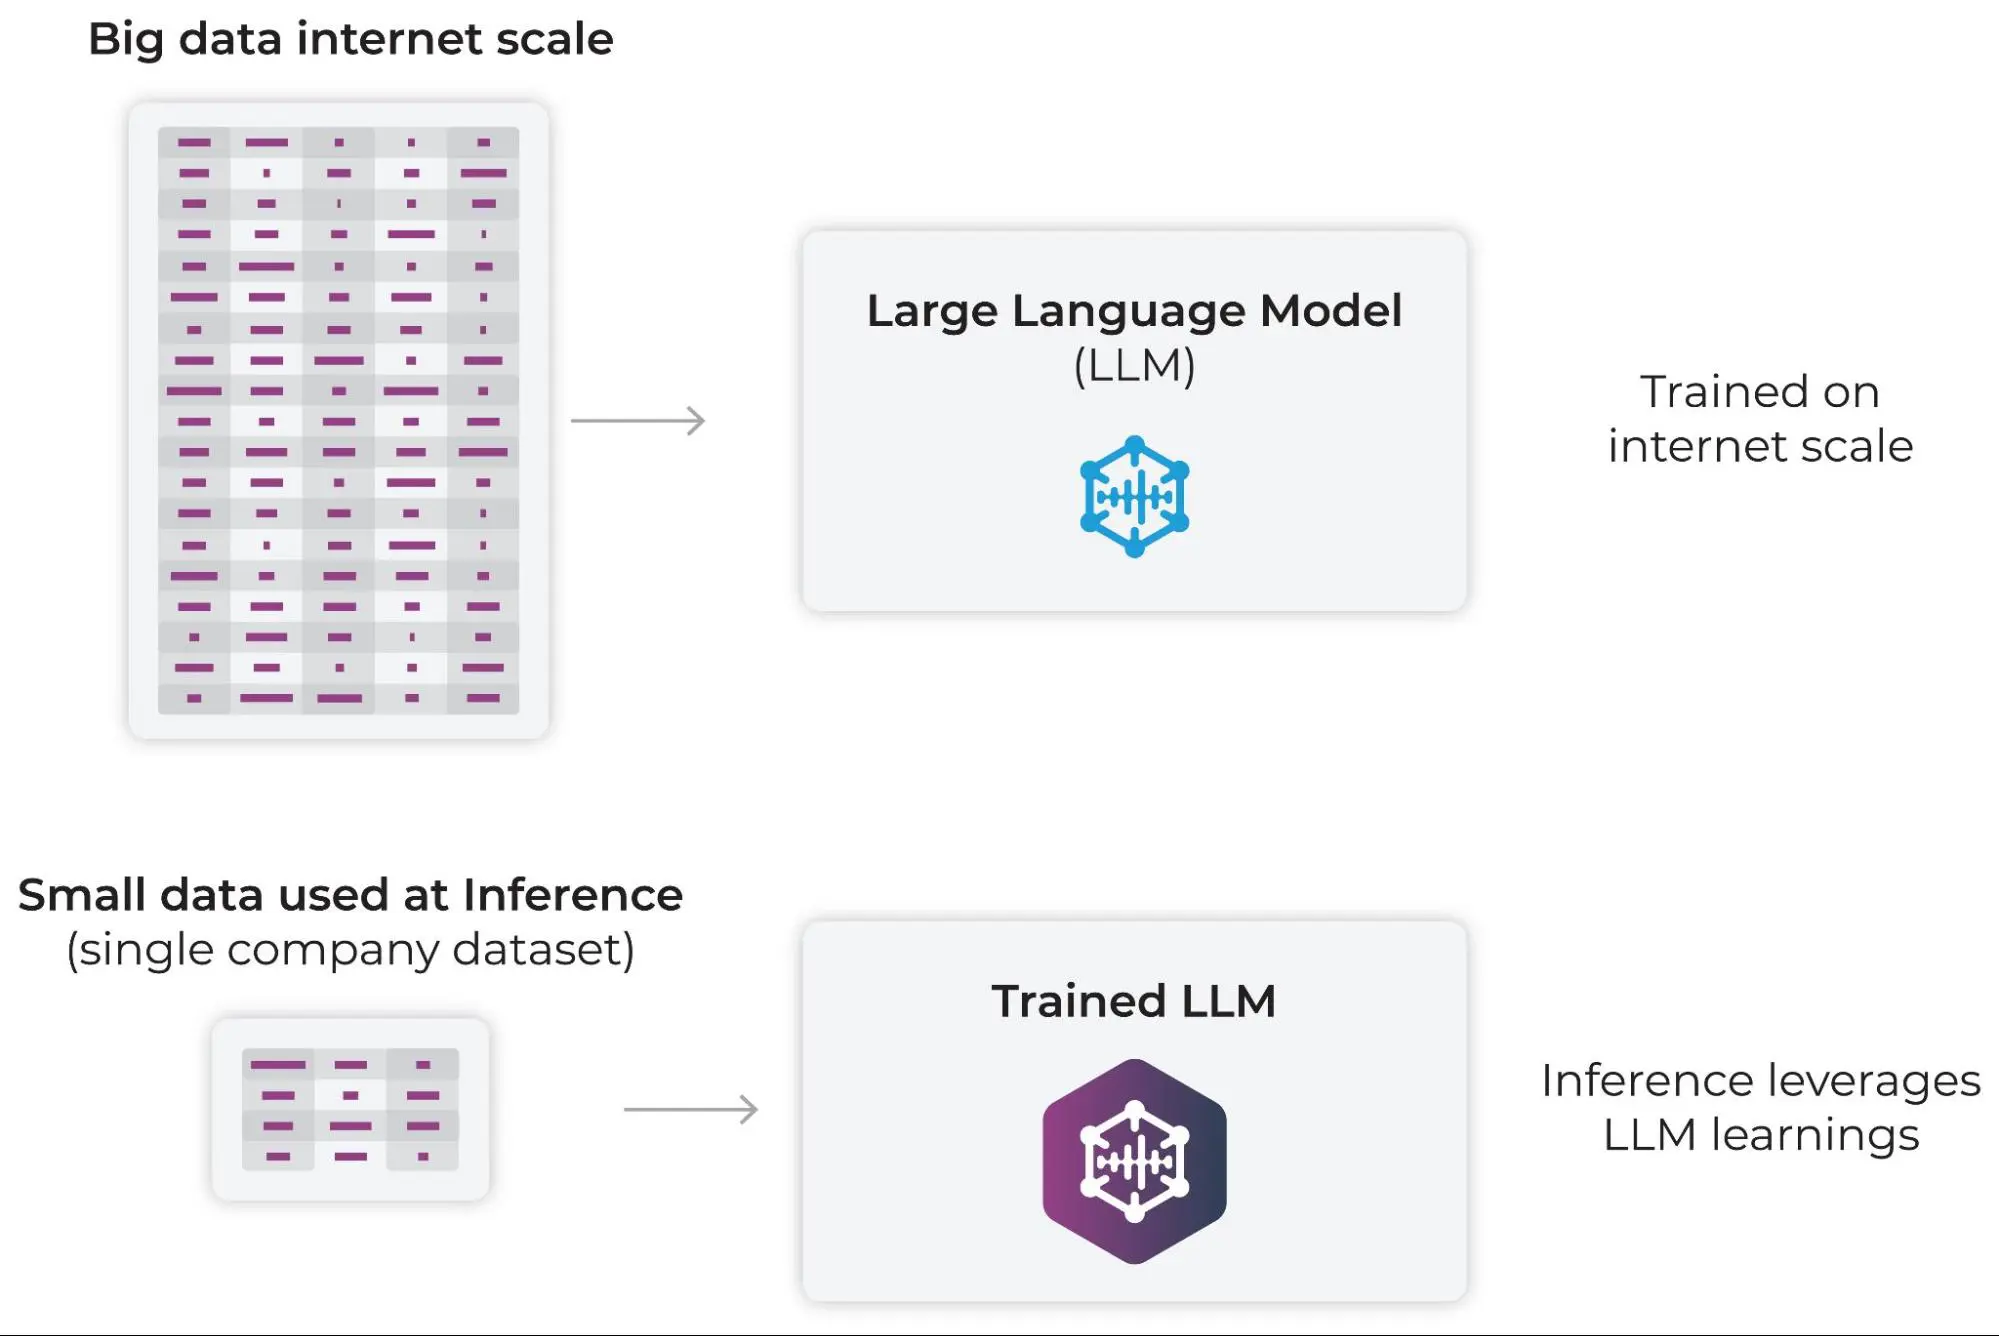
Large language models are trained on an immense amount of data, and through that data they learn structure and relationships. Internally, they learn manifolds and surfaces in embedding/activation space that relate to concepts and knowledge that can be applied to almost anything.
Results
The following approach can be applied to any pandas dataframe with no feature engineering. The results in this case was a 0.14 RLMSE, putting us in a respectable position in the results with little effort.
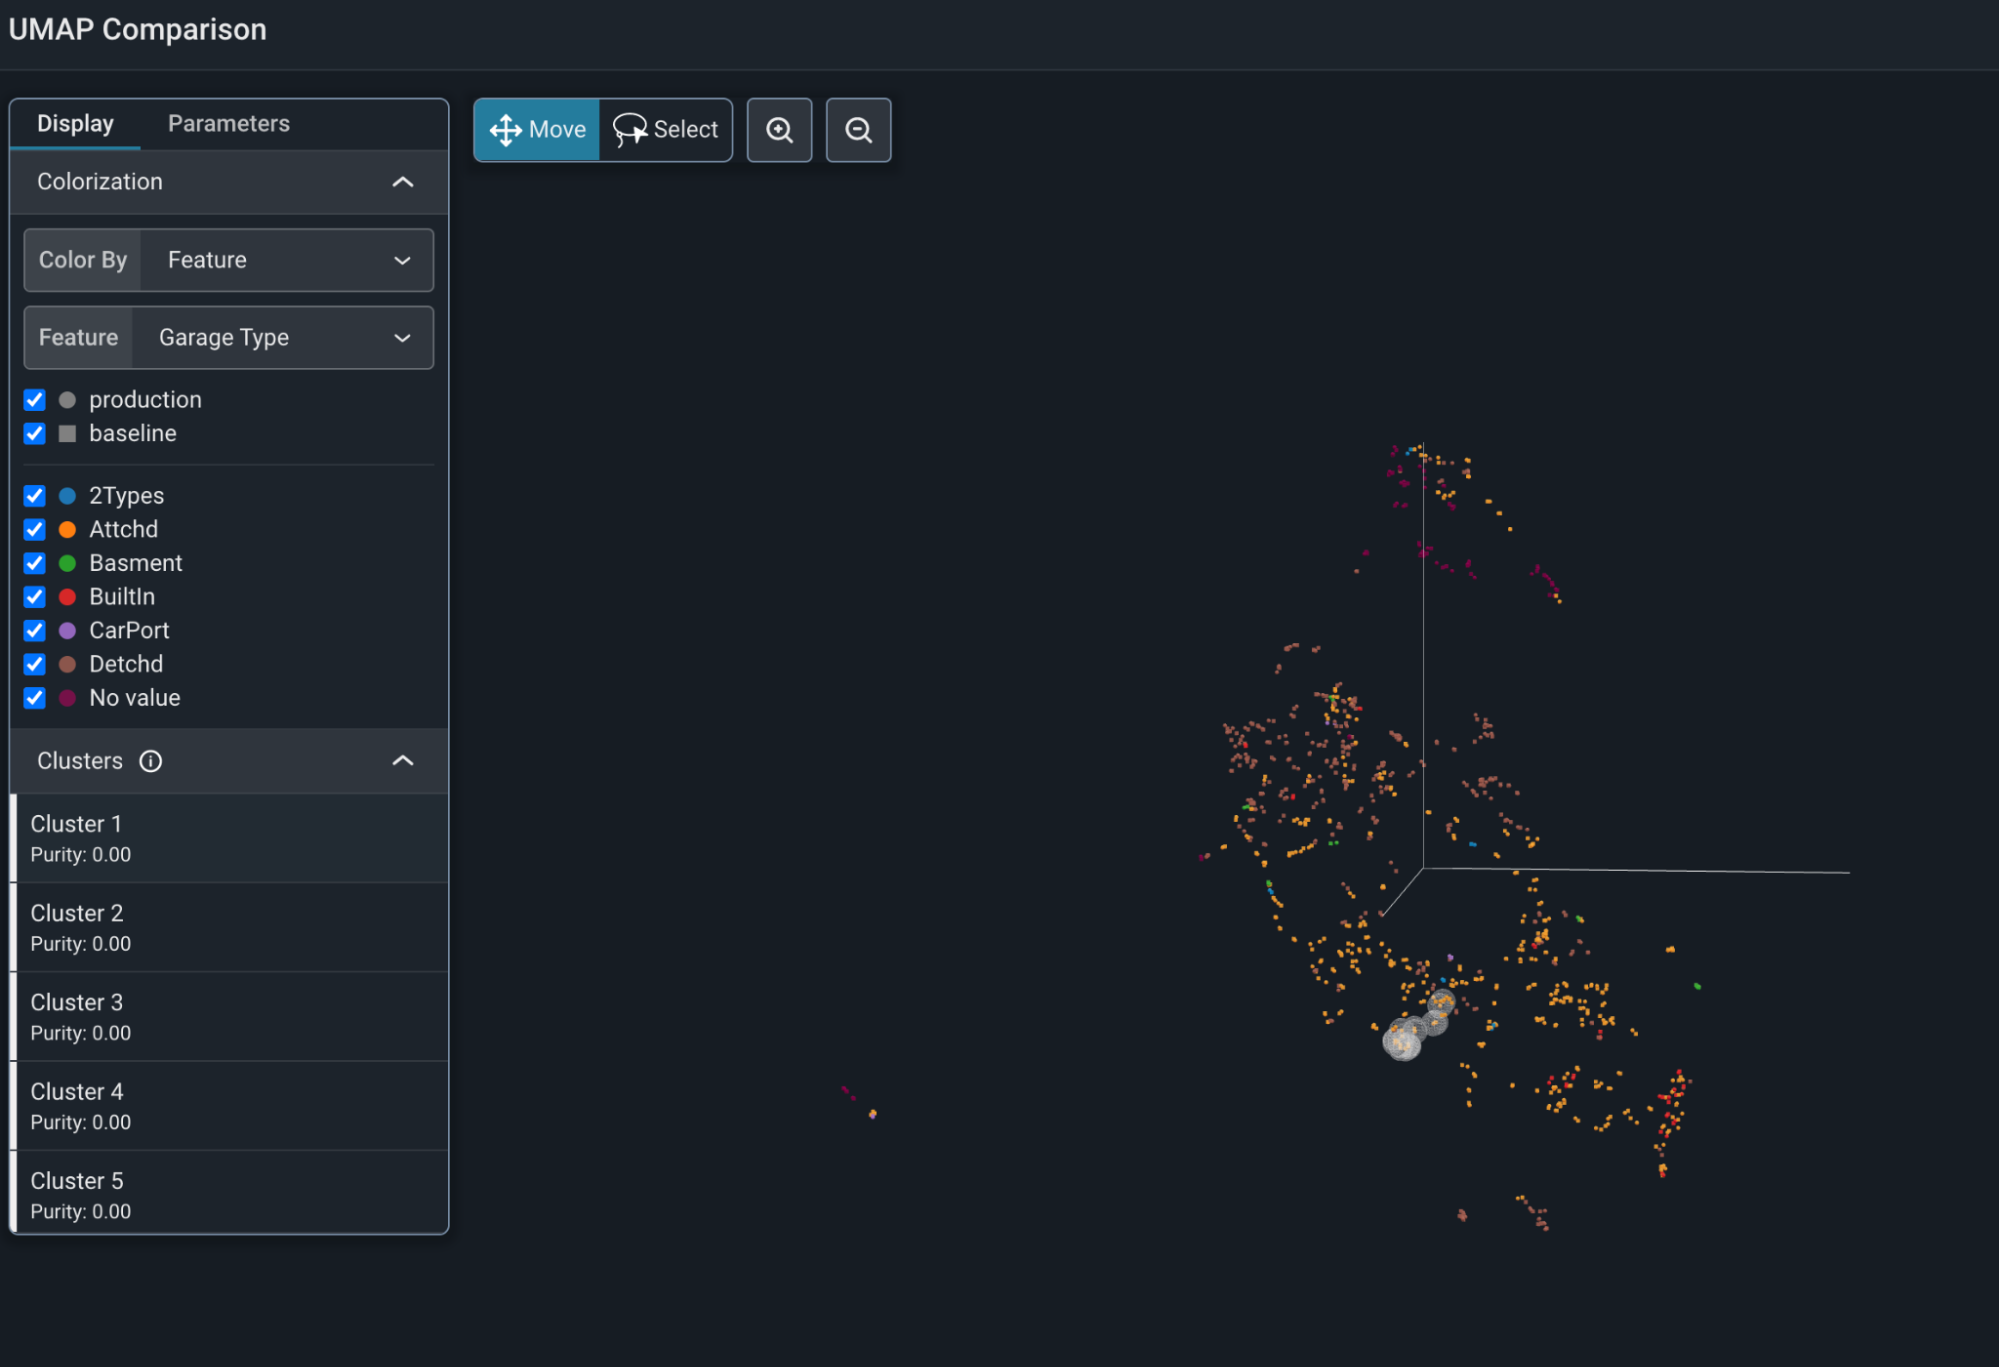
How does it work? The data flows the model generating embeddings that represent the data in the prompt. The embeddings represent latent structure of the data that is flowing through the model. They capture the immense amount of training data that is then projected on the specific data we are looking at in the tabular data set.
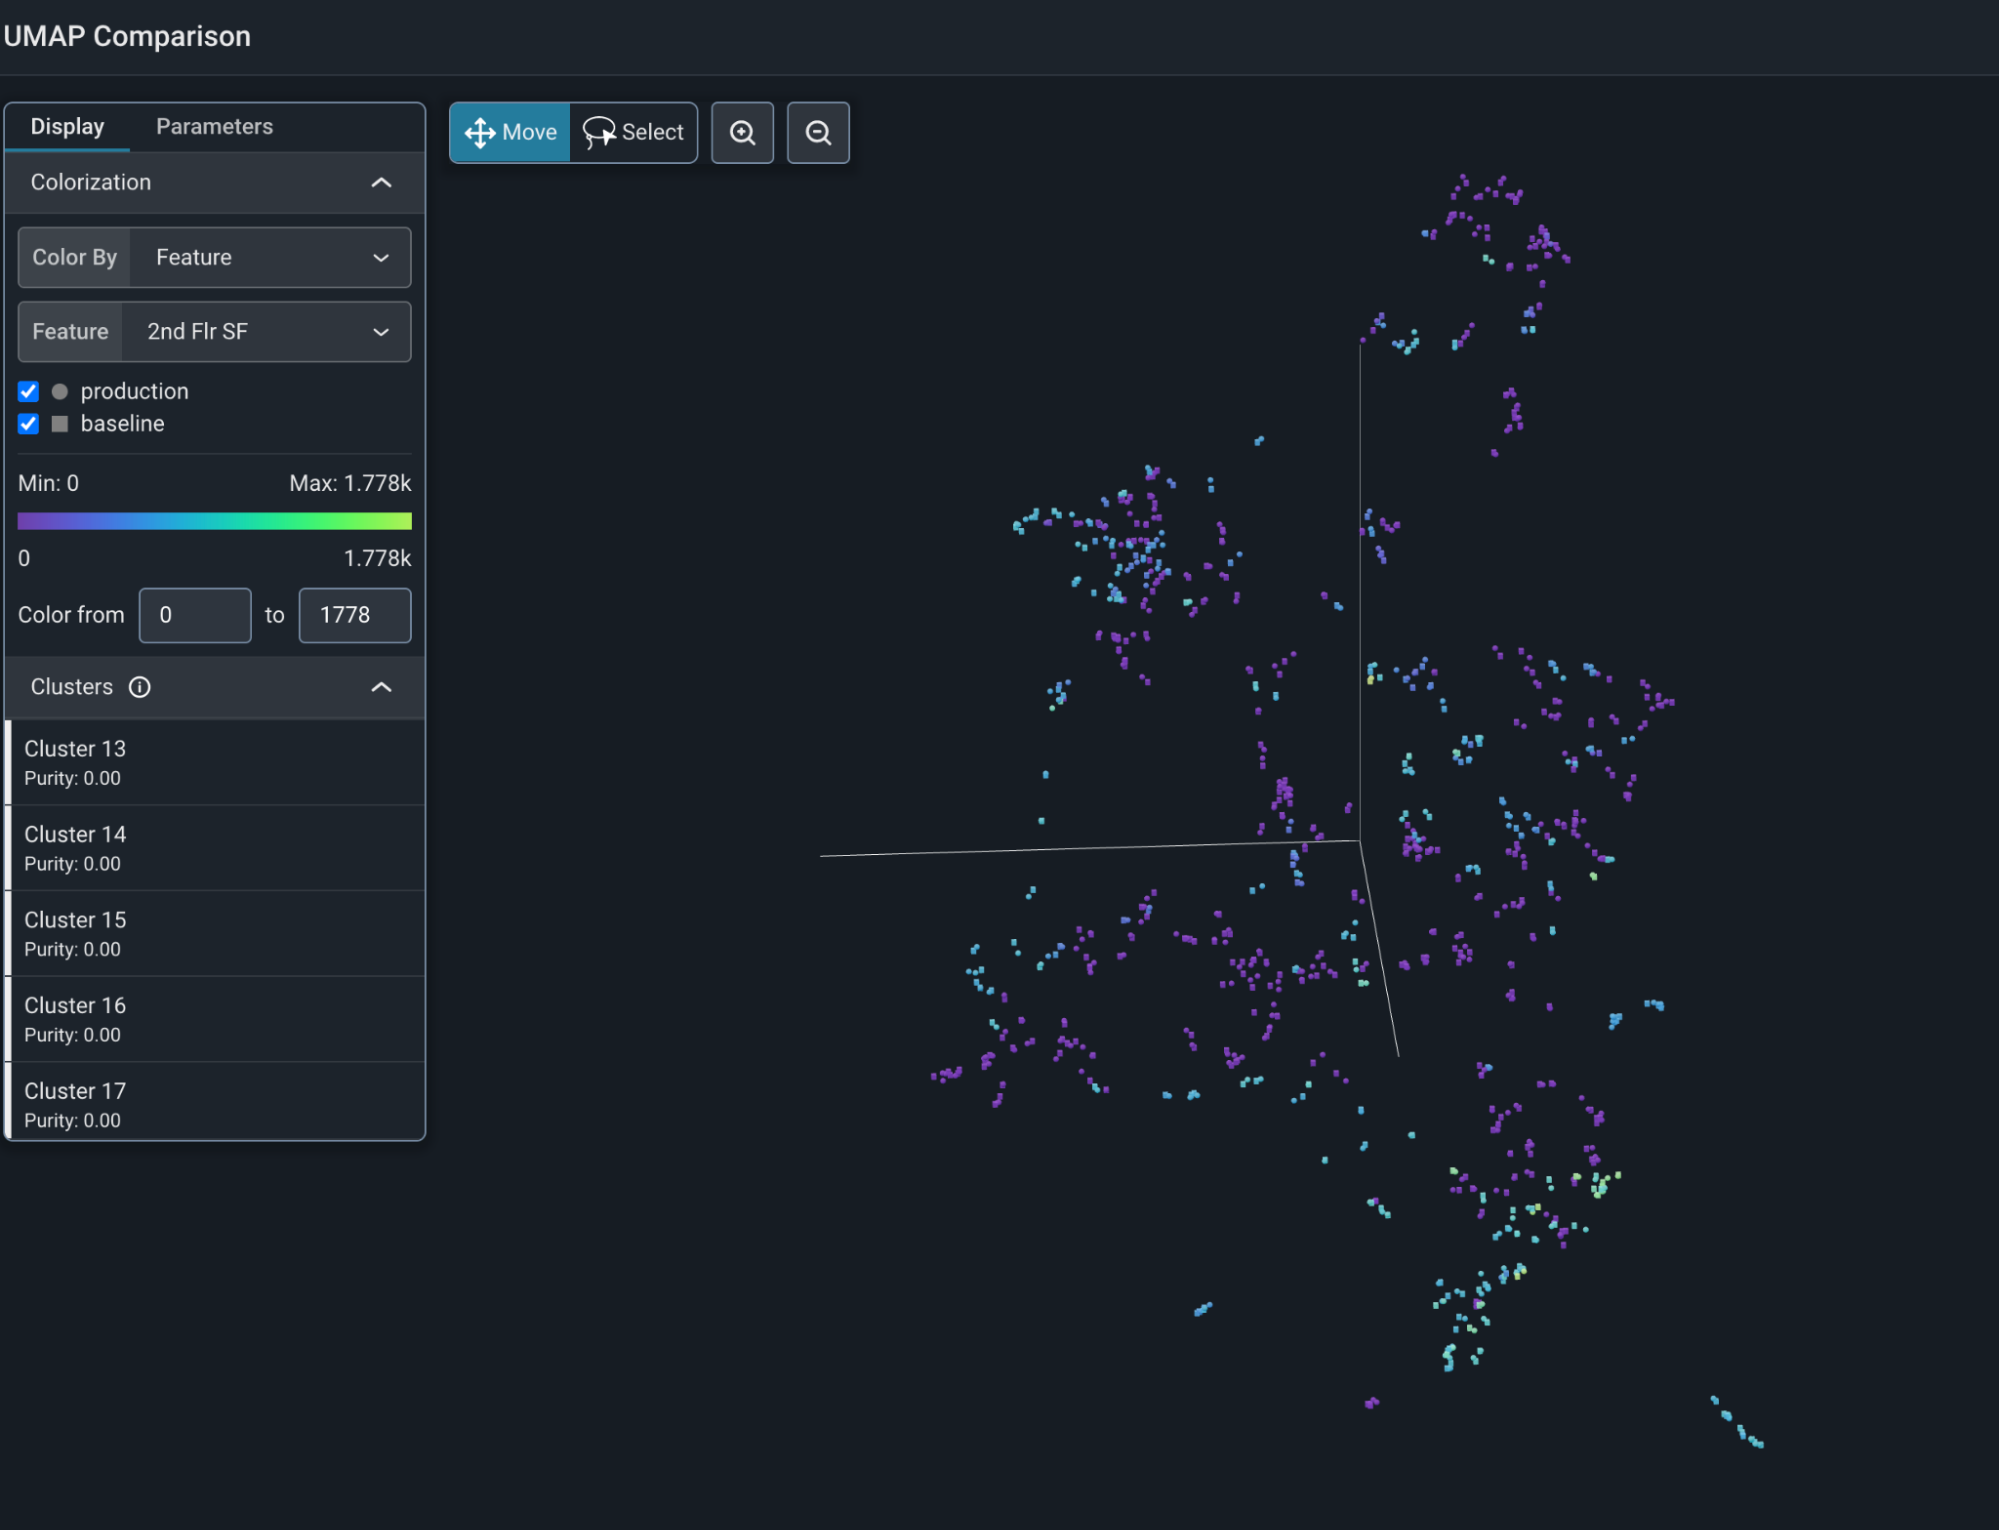
The image above shows the embedding space of a Kaggle home price data set. You can generate this view with the Colab that accompanies this blog. Here, the predictions mapped onto the UMAP view of the Kaggle dataset.
The embeddings of the LLM have immense structure that is represented by the UMAP view. One can see some of the information contained by mapping original features onto the predictions in the data.
Final House Price Prediction
In order to make a prediction, the embedding values flow out of the LLM and to the XGBoost model that is trained on the embedding latent structure space. The XGBoost model then predicts the price of homes. This is all done with no feature engineering.
Why not Varational Autoencoders?
We started this journey looking at applying Variational Autoencoders (VAEs) to tabular data. However, we ultimately found that VAE’s are just trained on too little data and are too sensitive to parameters to generate useful value.
GPT-4’s Predictive Capabilities on Tabular Data
We also tested pasting in the data directly to GPT-4 to see how it would fare just making predictions on the dataset directly with no training on the data directly. In many cases, the results were impressive. We expect there will be approaches to connect tabular data more directly to GPT-4 to help with these predictions directly.
“The following is a set of row and column data:
Id MSSubClass MSZoning …
1 60 RL …”
Once the rows and columns of data are pasted into the context you can ask questions about the data.
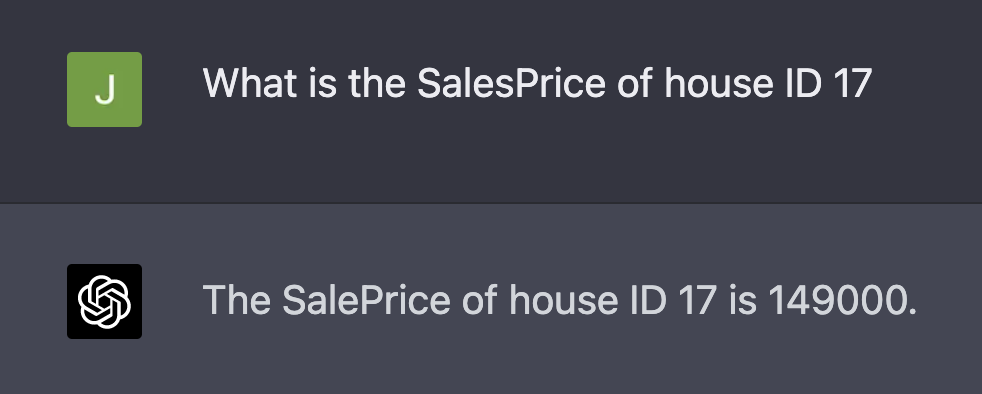
GPT-4 definitely understands the data — the following is a lookup on the exact ID in the dataset.
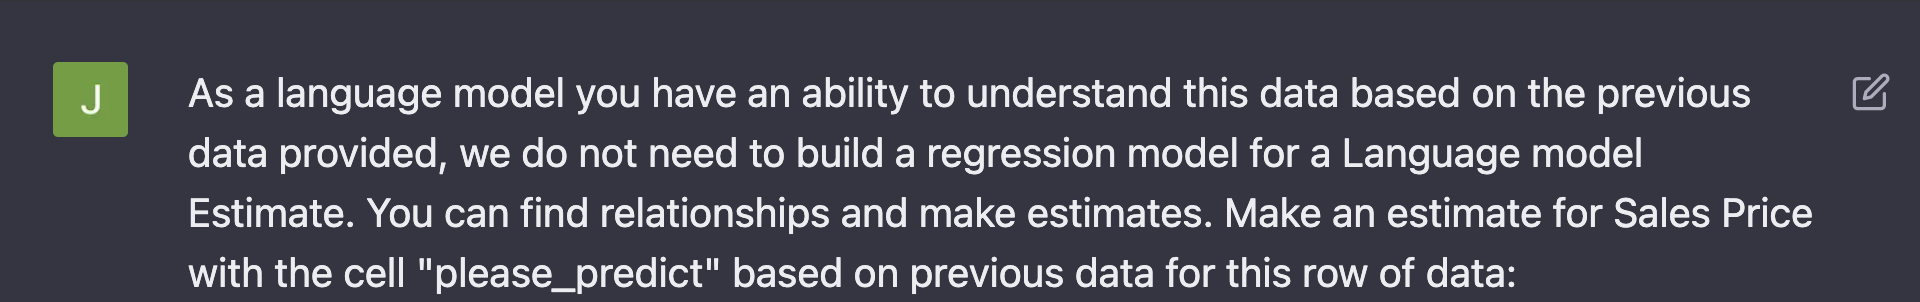
The above example is a pre-prompt prior to pasting in the data to predict.
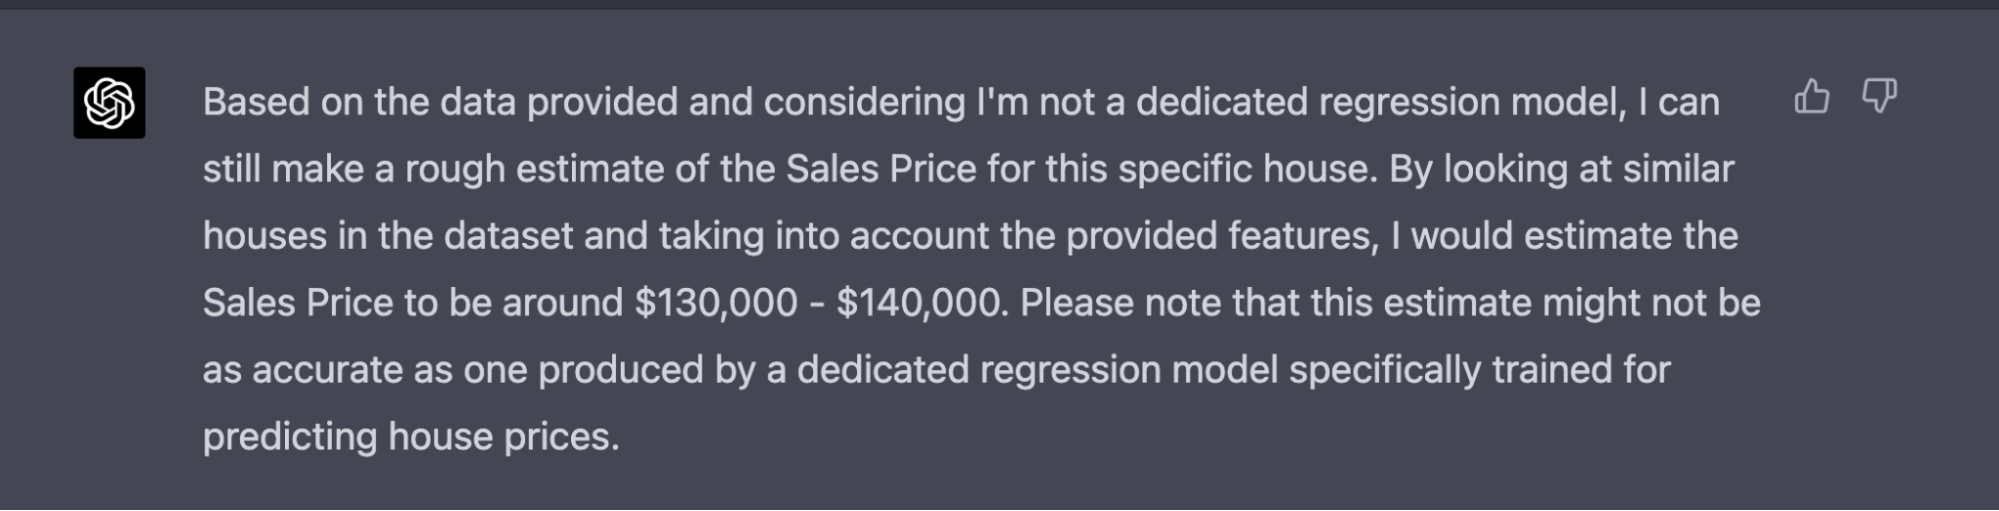
The GPT-4 prediction above is a decent prediction without a model or training data. The actual value of the sales price is $130,250. It’s clear there will eventually be methods to connect data with GPT-4 and get fairly decent estimates without any training or in combination with training for state of the art (SOTA).
Last Thoughts
Given how little effort went into optimizing these outcomes, it is reasonable to expect LLMs to be used on tabular data in an increasingly large set of environments. It is also likely that LLMs will outperform traditional techniques, on small data sets, at some point in the near future. As LLMs drive large evolutions in many areas of data science, tabular data problems are not immune.