


Co-Authored by Adam Mischke, Founder, AM2 & Alex Owen, Founder, Stealth Startup & Jason Lopatecki, Co-founder and CEO.
Claude Code is excellent for code generation and analysis. Once it lands in a real workflow, though, you immediately need visibility:
- Which tools are being called, and how reliably?
- How long do requests take end-to-end versus pure model latency?
- Where are prompts ballooning token counts (and cost)?
- How often do tool calls fail, and why?
Conventional logs often fall short here — they don’t capture streaming responses, nested tool invocations, or internal calls. Anthropic’s built-in monitoring surfaces usage metrics like request counts and latency, but not the underlying content of traces.
Dev‑Agent‑Lens is an open proxy‑based layer for Claude Code that routes requests through LiteLLM, emits OpenTelemetry and OpenInference spans, and sends them to Arize AX or to Phoenix locally. The repo includes a wrapper script so the standard Claude Code CLI works unchanged.
Check out the repo to get started.
Architecture At a Glance
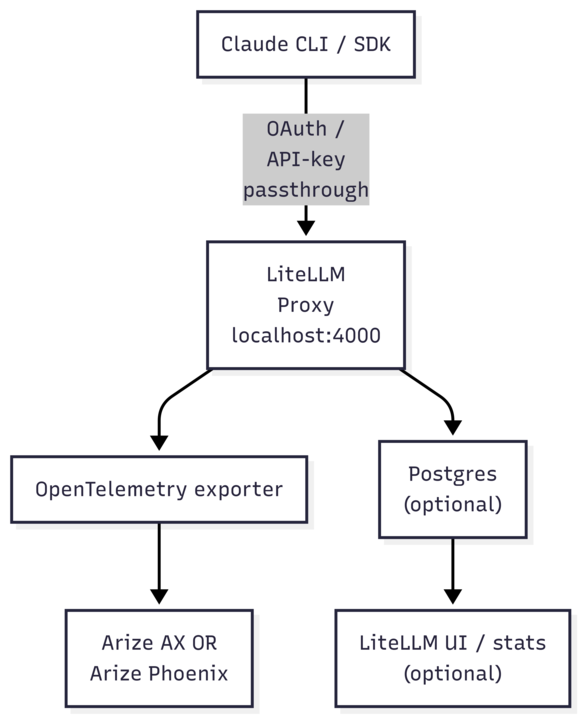
Proxy control with LiteLLM: centralize model routing, auth, rate limits, and cost tracking. LiteLLM exposes OpenTelemetry hooks and supports callbacks for observability.
We use OpenInference, the open-source standard for LLM observability built by the Arize team, on top of OpenTelemetry to capture rich trace data – far beyond what conventional monitoring systems provide.
Once traces are flowing you can attach evaluations and monitors:
- Trace‑level and session‑level evals: grade correctness, relevance, or end‑to‑end success for a workflow. Configure in the UI or log with code.
- Online evals: run continuously as data streams in and tag spans automatically.
- Production monitors: alert on custom span properties or eval metrics including latency SLOs.
Instrumenting the Python SDK
Point the SDK at the proxy and let the middleware handle tracing:
from claude_code_sdk import ClaudeSDKClient, ClaudeCodeOptions

options = ClaudeCodeOptions(
    system_prompt="You are a helpful assistant.",
    max_turns=10
)

async with ClaudeSDKClient(options) as client:
    await client.query("Explain tail-call optimization.")
    async for chunk in client.receive_response():
        print(chunk)
Under the hood, each SDK method triggers spans such as:
LLM/raw_gen_ai_request– the raw request sent to the modelLLM/Claude_Code_Internal_Prompt– internal prompt construction and token countsTOOL/Claude_Code_Internal_Tool– internal tool callsTOOL/Claude_Code_Tool– external tool calls (success or failure)LLM/Claude_Code_Final_Output– final model output assembled
Tool Calls in Action
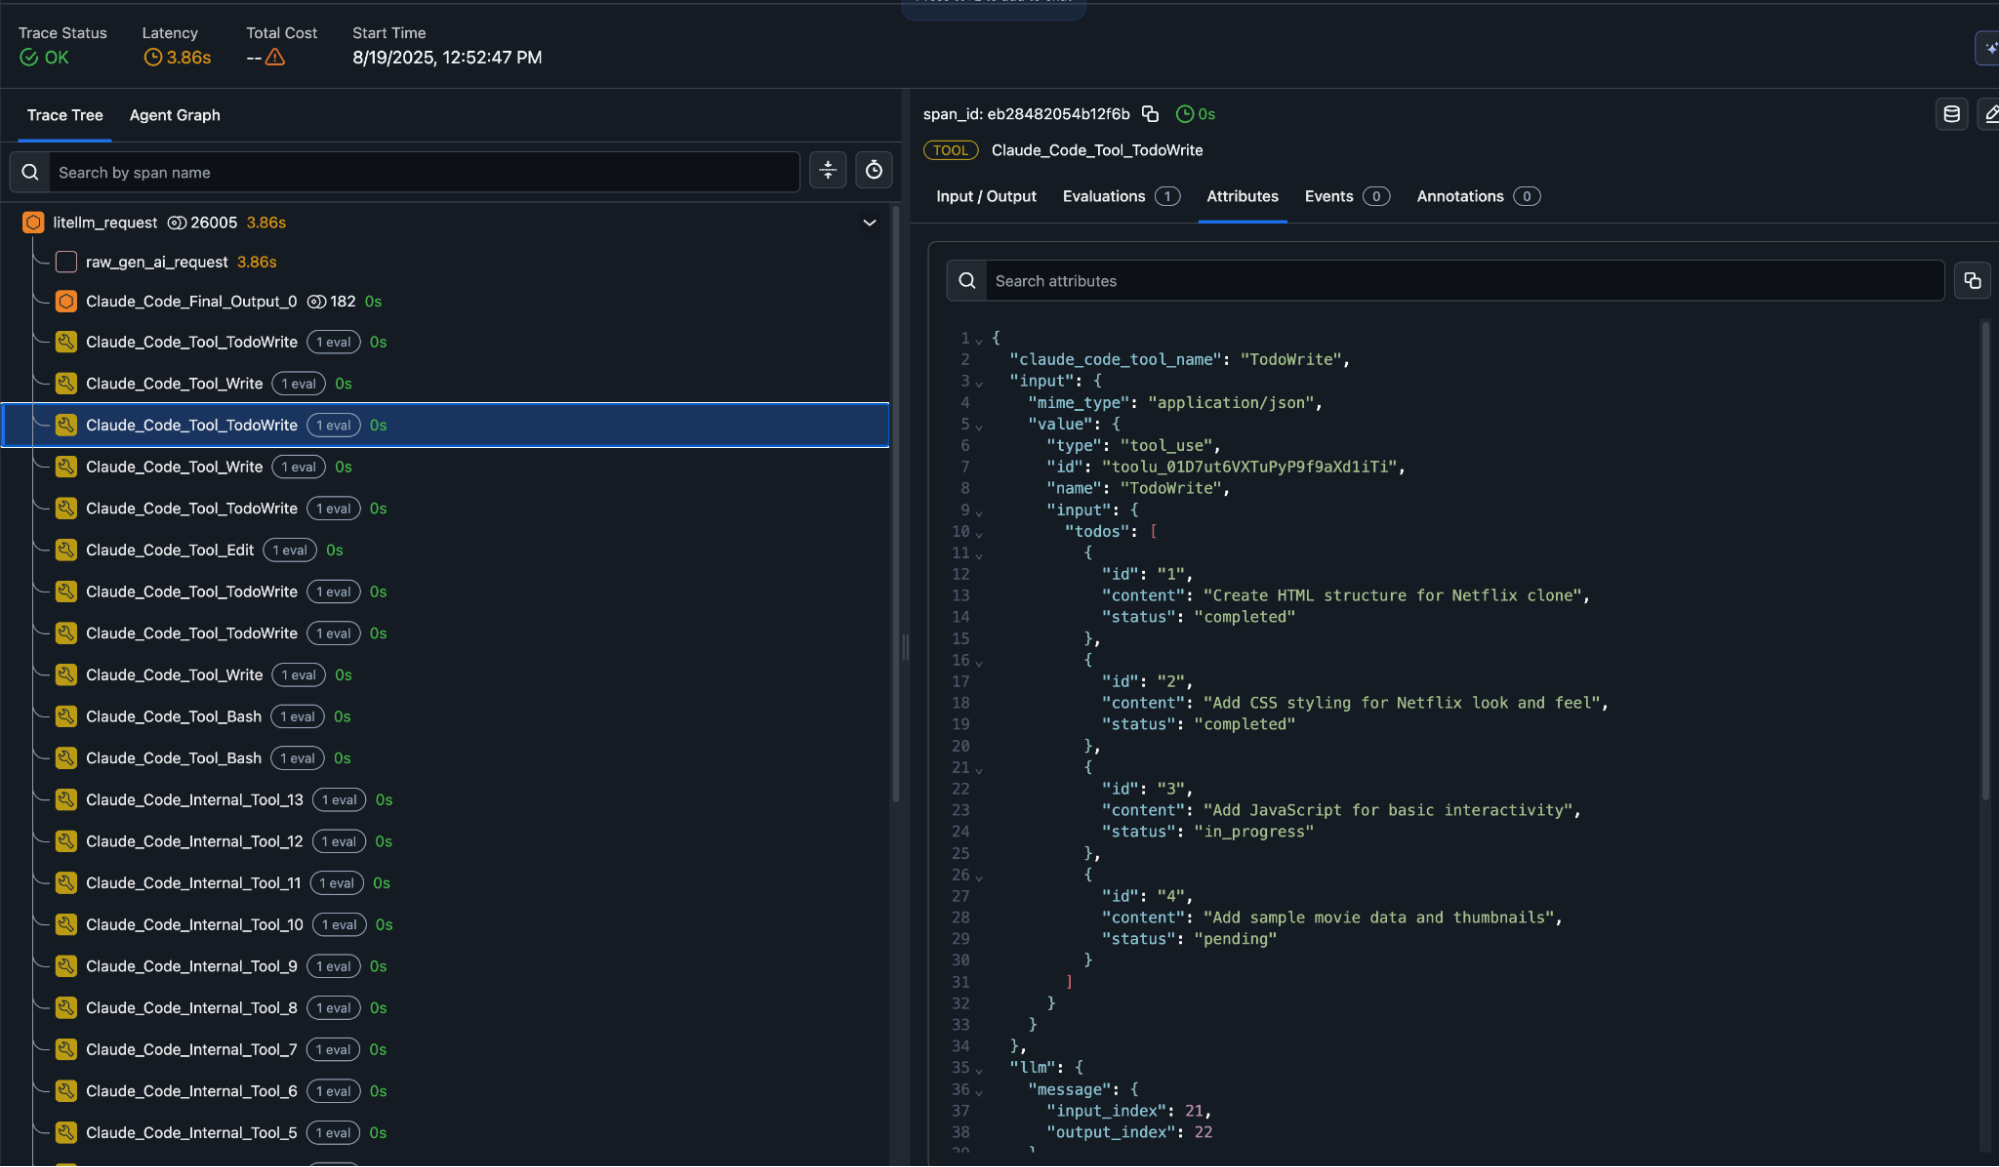
In practice, these traces let you see exactly what each tool did. For example, a span from a TodoWrite tool call shows the structured JSON input and output, including task IDs, statuses, and content like “Create HTML structure for Netflix clone” or “Add CSS styling for Netflix look and feel.” This makes debugging far easier, since you can correlate model prompts, tool inputs, and tool results side-by-side.
On top of that, you can run evals directly on spans to automatically catch errors in tool calls—for instance, invalid JSON responses, missing required fields, or latency SLA violations. Beyond correctness checks, evals can score tool outputs for completeness or relevance, ensuring agents behave reliably across different workflows.
Real-World Use Cases Included In the Repo
Several are included in the repo:
- Security Analysis Agent: Detects vulnerable code and suggests patches (Latency SLA: 3s average).
- Incident Response Agent: Ingests metrics & outputs root-cause analysis (Tool chain: DB lookup → LLM → Slack webhook). Traces show exactly where time is spent.
- Code Review PR Bot (TS): Same telemetry via the TypeScript SDK.
Find Causes of Claude Code Cost Spikes
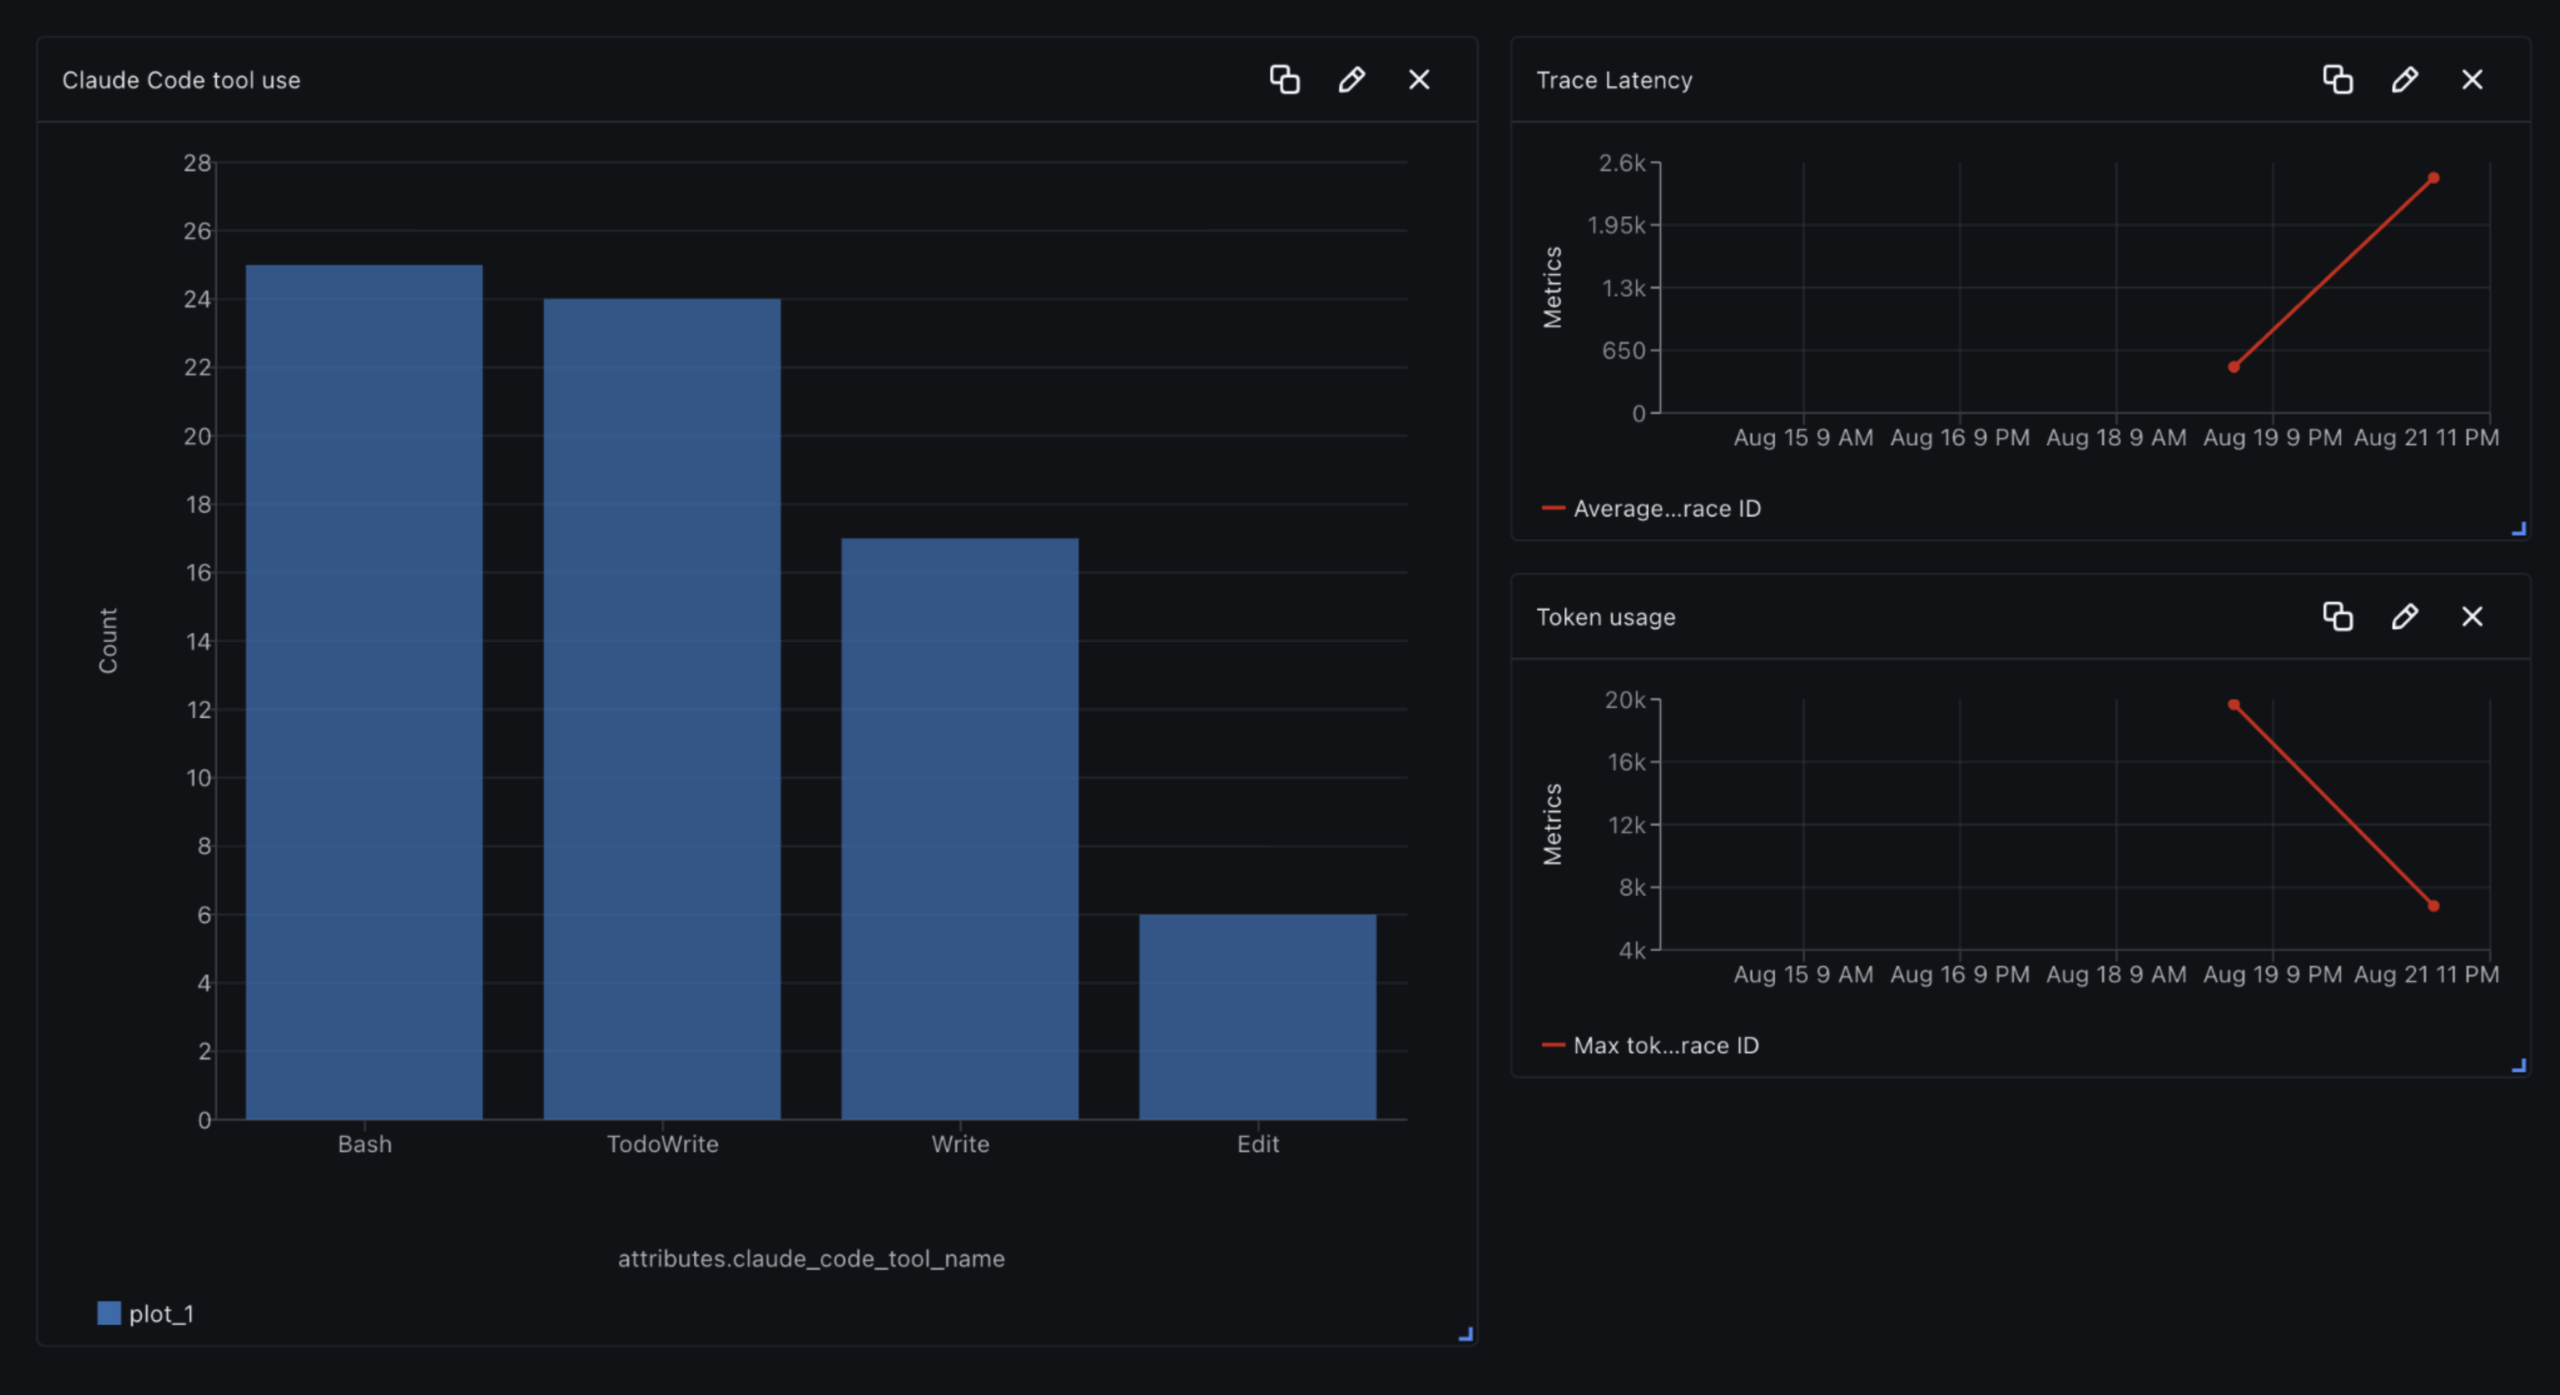
One other use case that is a common pain point is around getting to the bottom of Claude Code cost overruns. For many, it’s easy to get into trouble with a department head for ballooning costs quickly as Claude Code gets to work – but it’s tricky to understand where your major cost drivers are. With tracing, you can dissect specific obese prompts or workflows.
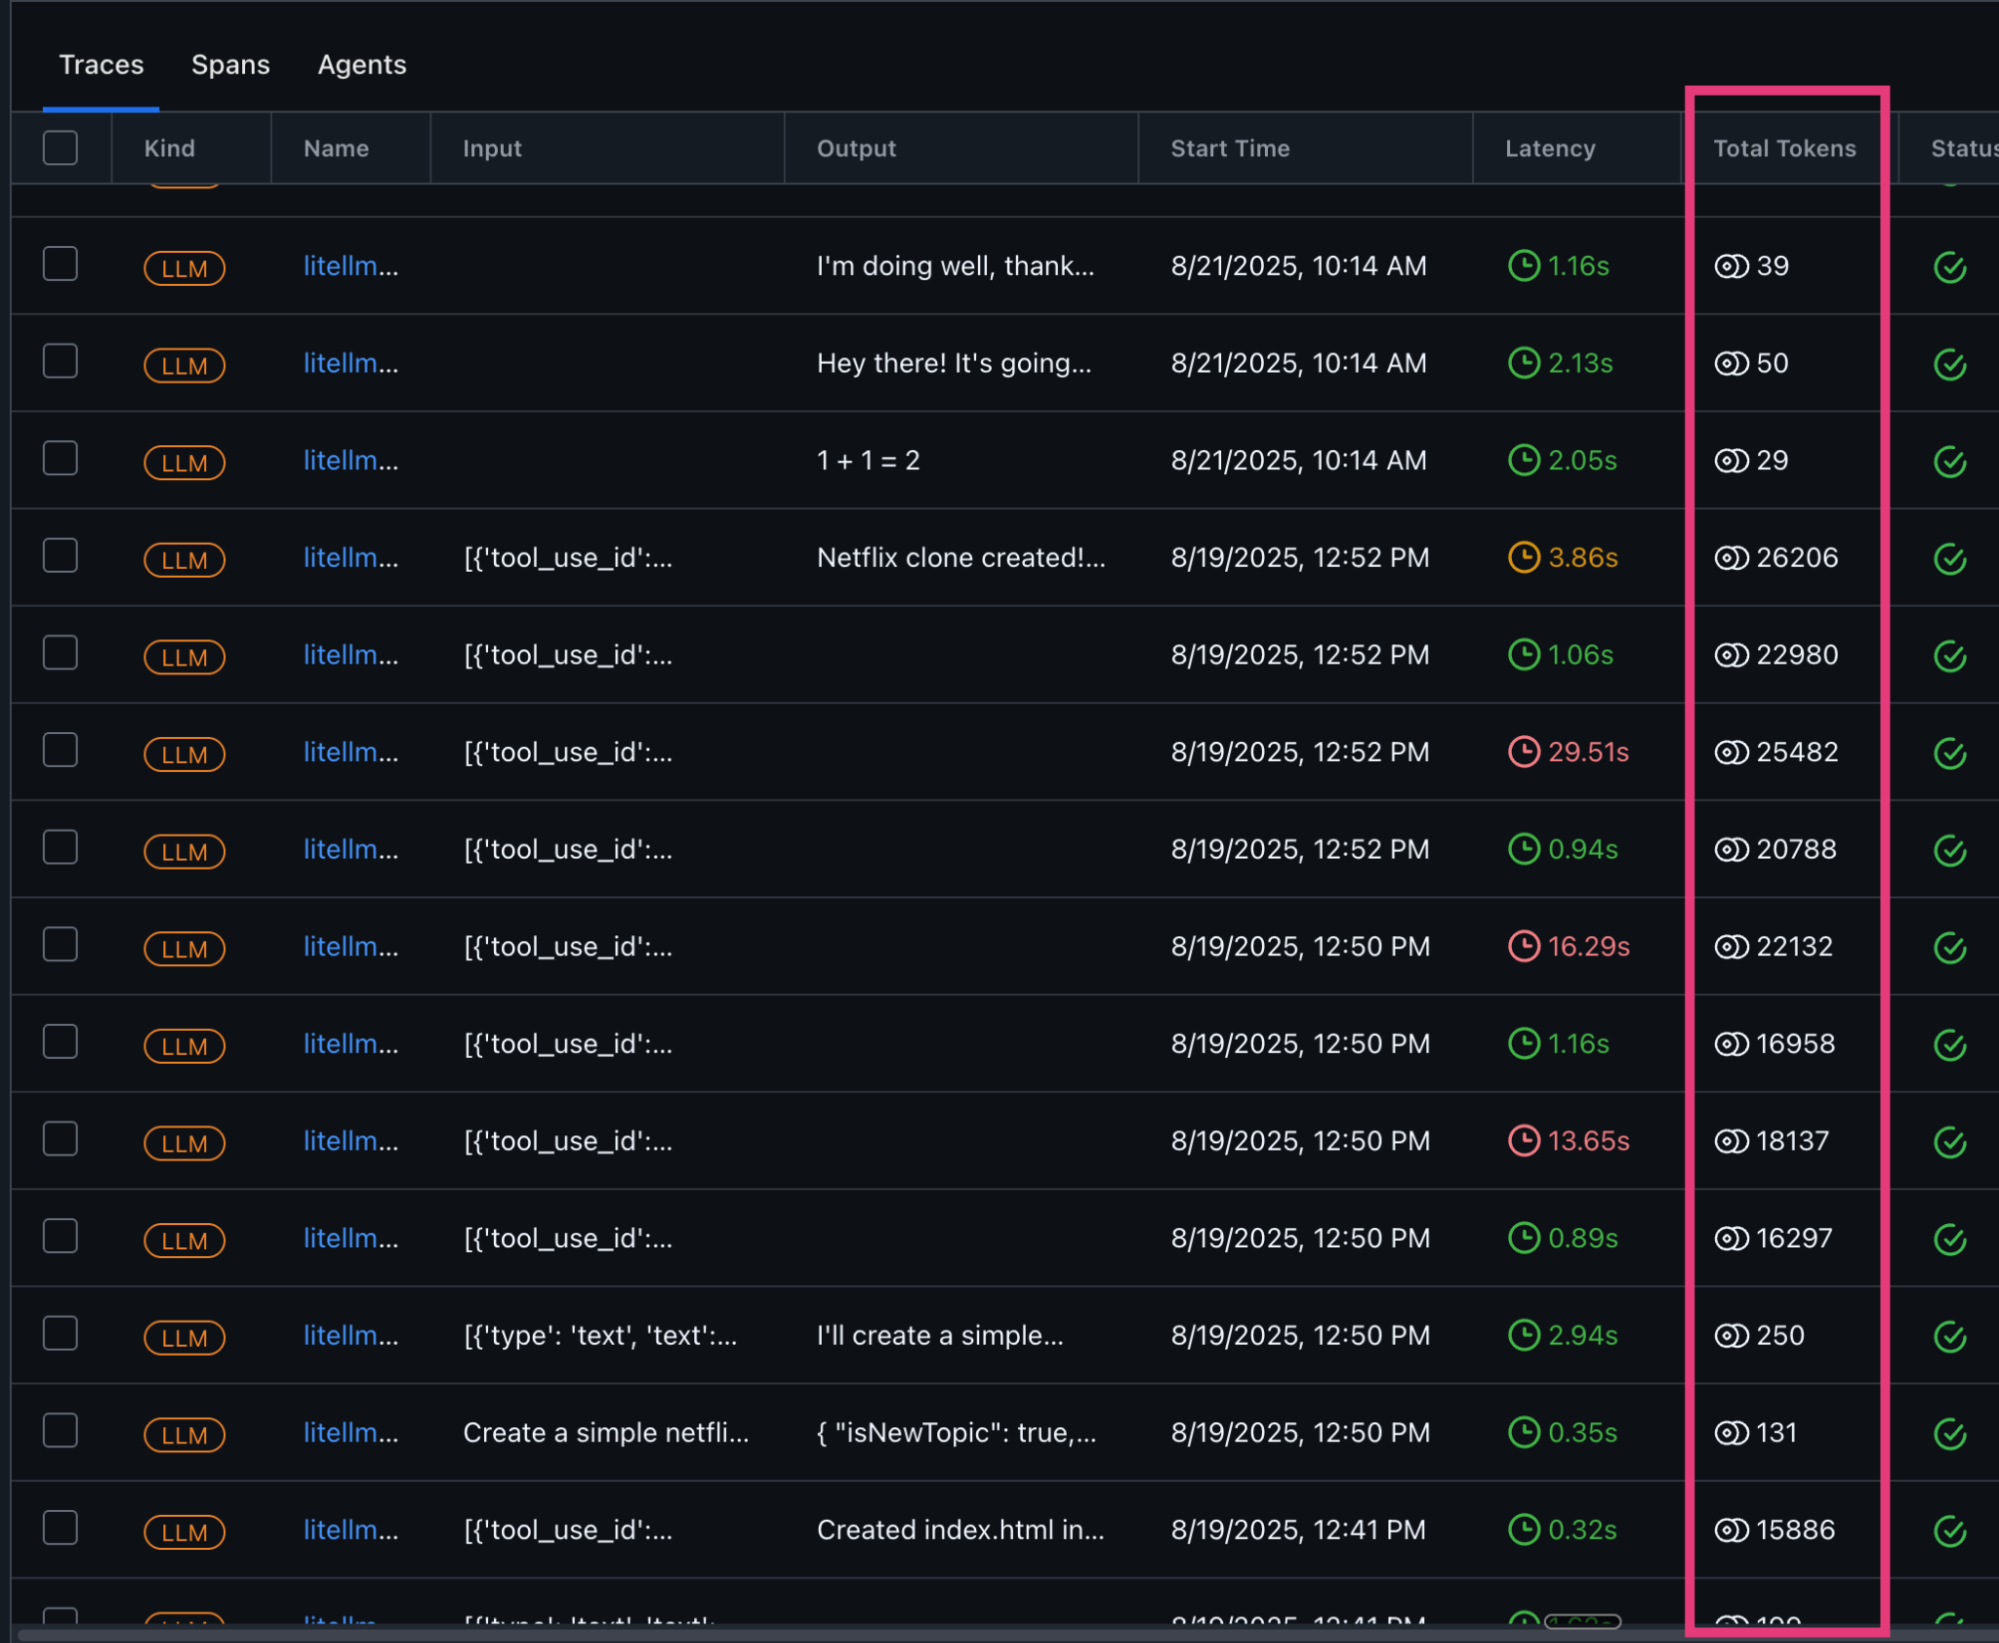
Tokens are your biggest cost driver, so it pays to keep an eye on them. With Dev-Agent-Lens, you can see how many tokens each prompt and completion used and spot sudden spikes that signal bloated prompts or runaway tool outputs. Staying close to the context window is another red flag — once inputs get too large, models quietly drop context, which hurts quality. The fix is usually simple: trim prompts, dedupe retrieved text, cap tool payloads, and set clear max_tokens limits. On the cost side, you can add budgets per project, fail fast when requests exceed limits, and cache results for repeatable calls. All of these signals land as spans in Arize AX or Phoenix, so you can track trends and add alerts before costs or quality slip.
Getting Started
The repo is here.
# 1. Clone & configure
git clone https://github.com/your-org/dev-agent-lens.git
cd dev-agent-lens
cp .env.example .env   # add ANTHROPIC_API_KEY (unless using OAuth) + Arize Keys

# 2. Launch the proxy + tracing
docker compose --profile arize up -d

# 3. Run an example
uv run python examples/python/observable_agent.py

# 4. Open Arize  →  Projects  →  litellm