


Arize Observe 2025 brought a wealth of new product releases, including a redesigned copilot, agent eval options, and state-of-the-art prompt optimization techniques.
Check them all out below!
Copilot v3: Alyx
Inspired by everyone’s favorite dev tool, Cursor, our Copilot UI just got a major upgrade. You can now drop context anywhere across the app and open copilot with the magic of ctrl+L to instantly pull context for smarter, faster help.
We’re also introducing Trace Troubleshooting — a new Copilot skill that lets you navigate the entire trace to pinpoint issues. Built with O3 under the hood, you can now:
- @ specific spans
- Use existing span skills for span questions or evals
- Let Copilot traverse and diagnose like a pro
- Ability to customize the hot key if you don’t want to use ctr+L
Check out the link here for more info and a quick demo
Alyx MCP Assistant
Sometimes you don’t want to open another browser to run your debugging workflows. The best in class tools meet you where you want to work, and that’s why we’re excited to announce that…
All of Alyx’s skills will be accessible via MCP.
That means you can take advantage of Alyx’s debugging capabilities wherever your workflow demands. Debug your traces directly from Cursor while building your agent, or connect through Claude Code to immediately identify improvement areas.
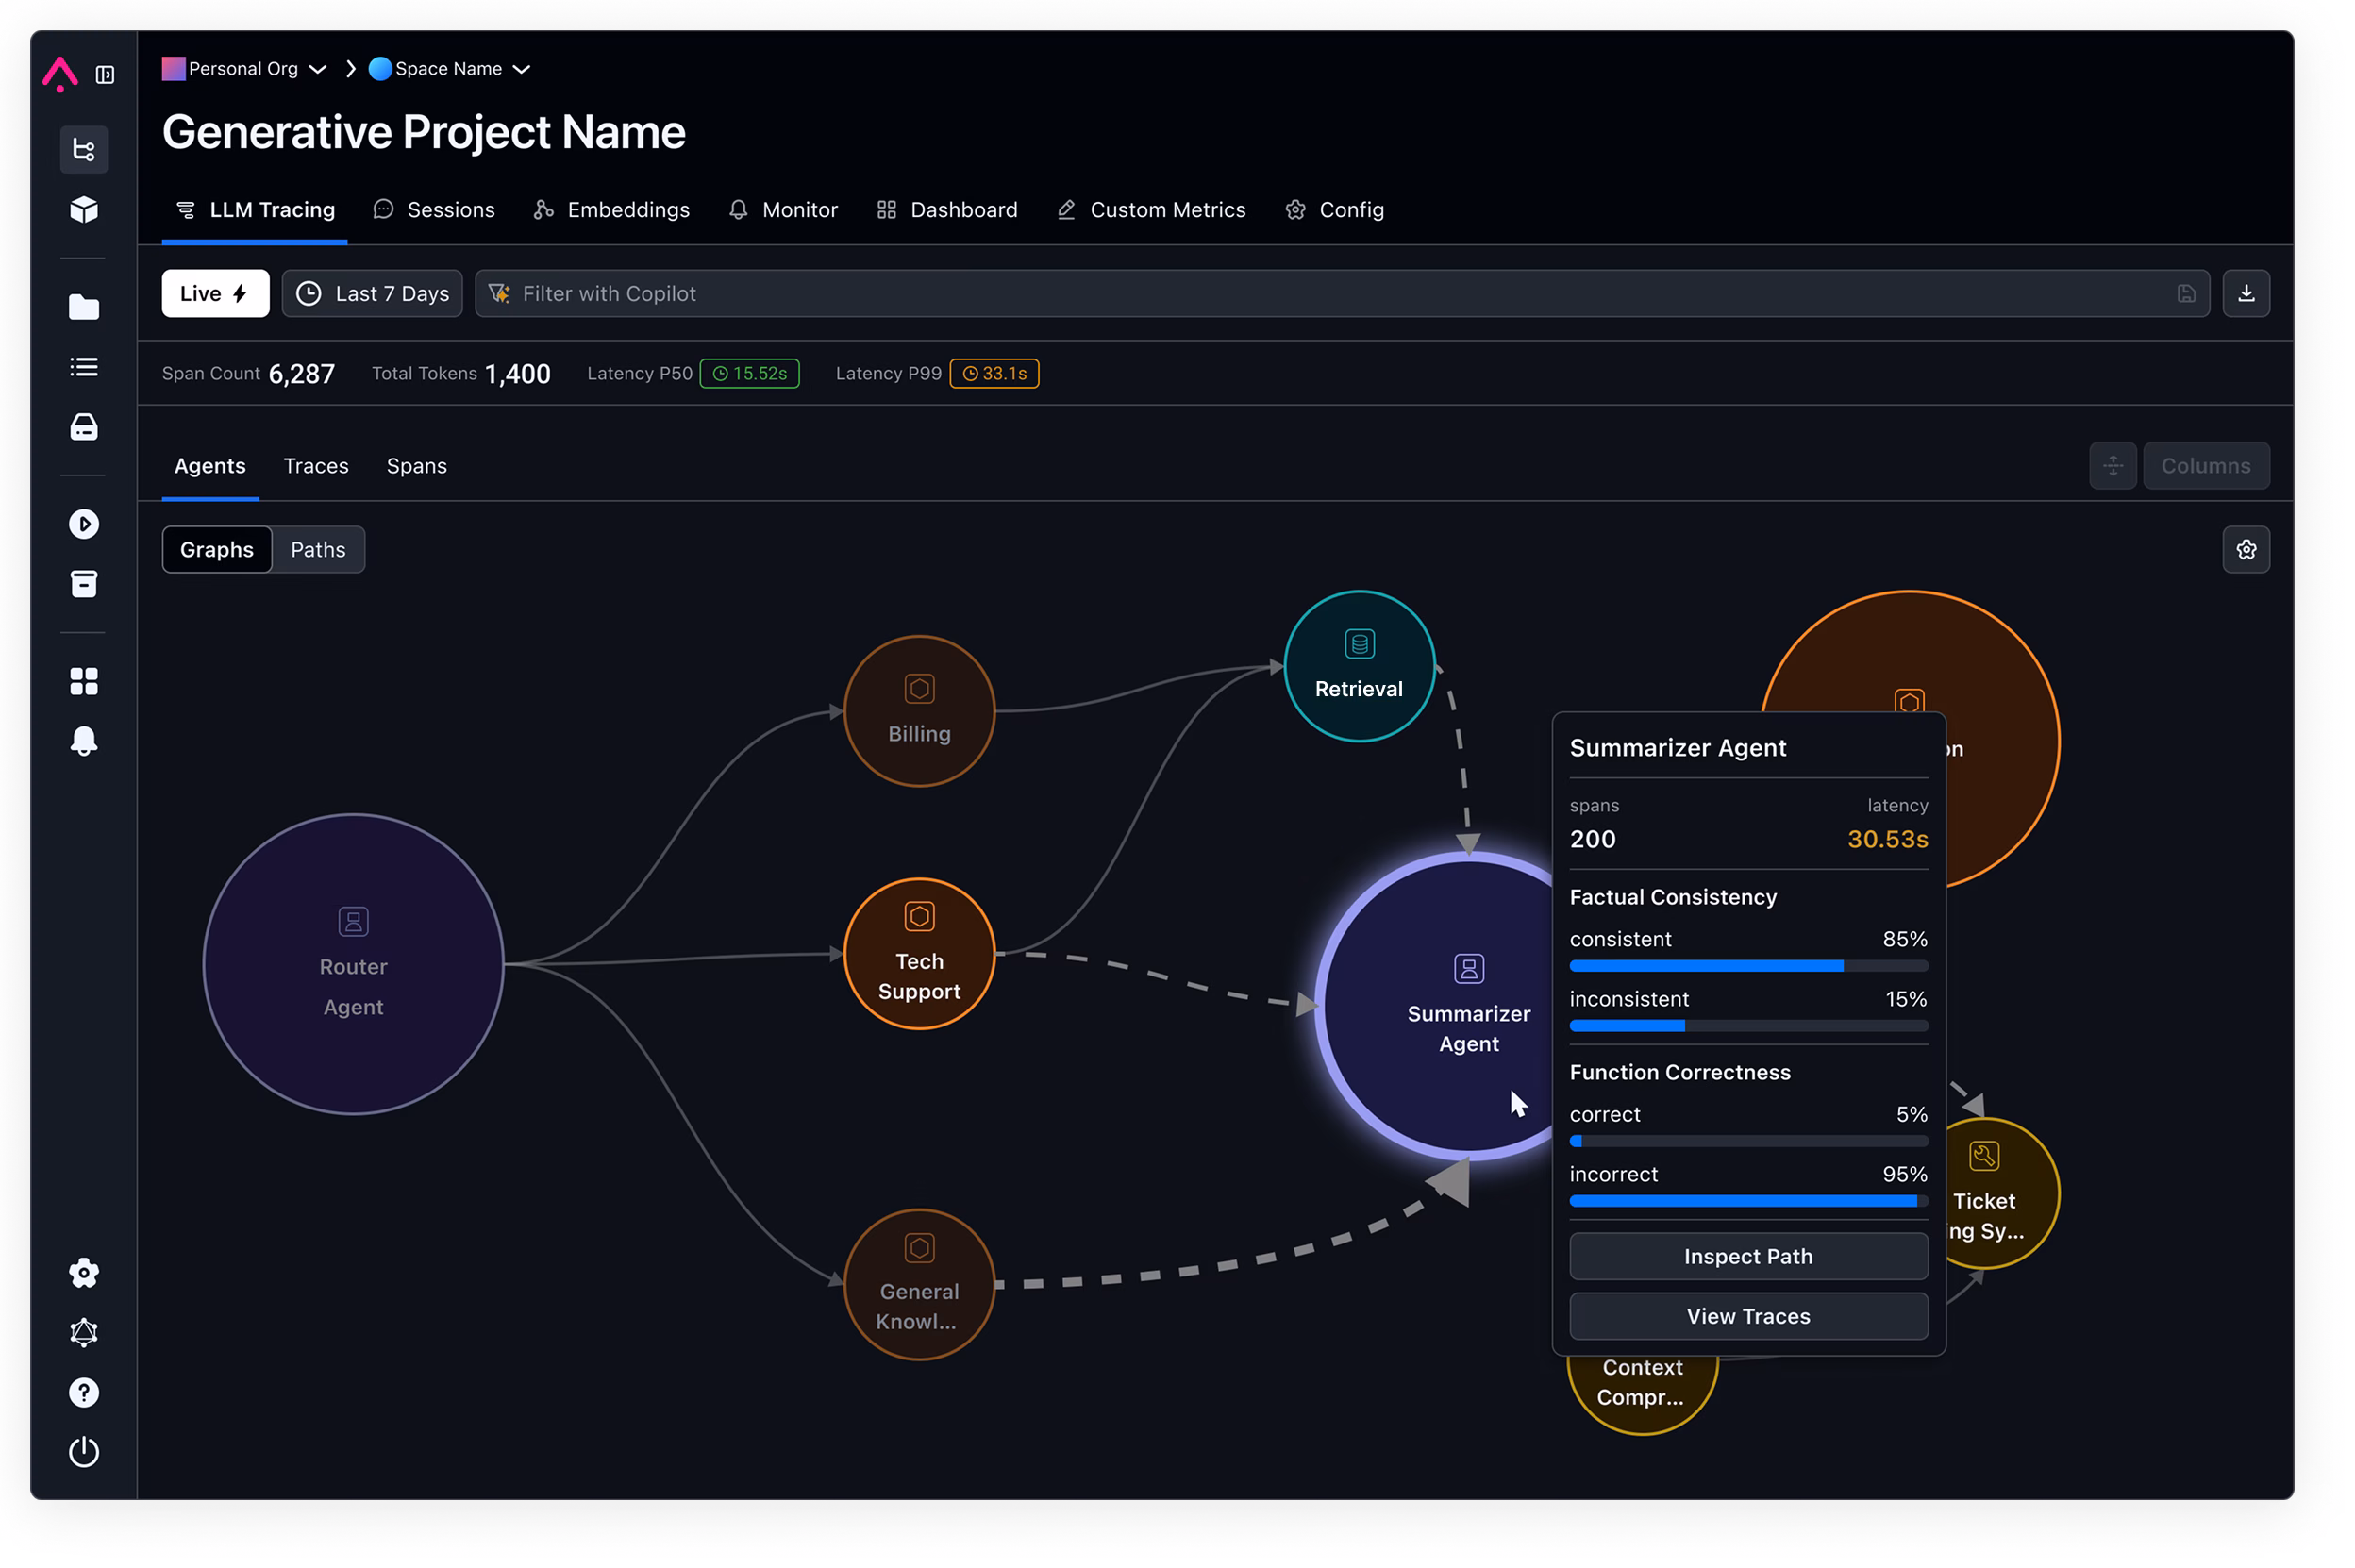
Agent and Multi-Agent Visualization
You can now inspect multi-agent workflows in Arize like never before with the launch of Agent Visibility, a powerful new way to observe and debug multi-agent systems. In addition to the existing Traces and Spans views, you’ll now find a new Agents tab that brings your agent orchestration to life—literally.
With Agent Visibility, Arize automatically visualizes your agent runs as an interactive flowchart. This graph shows how agents, tools, and components interact step-by-step throughout a task, so you can:
- Visualize agent workflows: Follow every step from start to finish—how agents chain together, call tools, and delegate tasks.
- Debug with clarity: Spot where logic breaks down, identify bottlenecks, and trace errors in complex runs.
- Link agents to traces and spans: Click into each node to see corresponding span data for deeper insights into latency or failure modes.
- Accelerate debugging & refinement: Use the graph view to iterate quickly on orchestration logic, tool integration, and handoffs.
It works automatically across popular frameworks like Agno, Autogen, CrewAI, LangGraph, OpenAI Agents, and SmolAgents — no extra implementation needed. It seamlessly tracks node transitions, agent handoffs, and metadata to visualize your entire agent workflow out of the box.
Session-level Evaluations
With this release, you can now evaluate:
- 🔄 Coherence: Does your agent maintain logical consistency throughout the session?
- 🧠 Context Retention: Is your agent effectively remembering and building on prior exchanges?
- 🎯 Goal Achievement: Does the conversation accomplish the user’s intended outcome?
- 🧭 Conversational Progression: Is the agent navigating multi-step tasks in a natural, helpful way?
Use session-level evaluations to ensure your agents are not only accurate at each step but also effective across the full customer journey. Perfect for complex workflows, multi-turn tasks, and nuanced use cases where trace-level metrics fall short.
More on Session-level evals
Agent Trajectory Evals
We’re also introducing Agent Trajectory Evaluation—a new way to assess whether your AI agent is following the right steps, not just reaching the right answers.
This feature helps you evaluate the sequence of tool calls and reasoning steps an agent takes to solve a task—what we call its trajectory.
Key benefits:
- 🧭 Path Quality: Understand if your agent is following expected and efficient problem-solving paths
- 🛠️ Tool Usage Insights: Detect redundant, inefficient, or incorrect tool call patterns
- 🧪 Debugging Superpower: Gain visibility into internal decision-making to resolve unexpected behaviors—even when the outcome seems correct
Even if the final result looks fine, a flawed trajectory can lead to wasted resources or hidden risks. With this new evaluation capability, you can now measure and monitor how your agents reason and act across every step.
More on Trajectory Evals
Prompt Learning
Next up, we’re excited to unveil Prompt Learning—a new workflow in Arize built to supercharge prompt iteration and evaluation.
With this launch, you can now:
✅ Run prompt optimization experiments directly in Arize
🧠 Incorporate text-based judgments from humans and LLMs
⚙️ Tune and compare variants to systematically improve agent behavior
Where fine-tuning and RL workflows require hundreds of examples to enact meaningful improvements, Prompt Learning is immediately useful with just a handful.
For more on Prompt Learning, check out our docs
Playground Views
🚀 Our new Prompt Playground feature lets you save views, including prompts and dataset selections, comparison views, messages, and model selections. Iterate and test variations seamlessly in the same environment, and share optimal views across multiple team members.
Arize Database: ADB
Next up we’re thrilled to announce ADB, the powerful engine behind all Arize AX instances. Designed for massive scale and speed, ADB enables us to process billions of traces and petabytes of information with unparalleled efficiency.
Its robust architecture supports real-time ingestion, bulk updating, and high-speed querying.
ADB has long been the unsung hero that allows our platform to power the heaviest of AI workloads, and we’re extremely proud to be bringing it to light.
For more on ADB, check out our deep dive here
Phoenix Announcements
We also unveiled a whole bunch of upgrades to Arize Phoenix as well! Including…
Phoenix Cloud
We’ve added a full management and provisioning layer to Phoenix.
This means you now can:
🚀 Spin up multiple, customized Phoenix spaces for different teams and use cases
🔑 Manage individual user access for each space
👥 Collaborate with additional team members in your Phoenix projects
Multiple users per project has been a top request for Phoenix Cloud, and we’re excited to be bring that and MORE to you today.
Cost Tracking in Phoenix
Another big drop live from Observe: Cost Tracking in Phoenix
💰 Track LLM usage and cost across models, prompts, and users
📉 Spot runaway costs before they blow up your budget
🧠 Tie spend back to model performance and usage patterns
🛠️ Optimize deployments with clear visibility into tokens and dollars
With Phoenix, it’s no longer a mystery what your agents are doing—or how much they’re spending to do it.
Bedrock Model Support in Phoenix Playground
Finally – we’re excited to announce support for Amazon Bedrock in Phoenix’s Playground!
This was our #1 requested feature in Phoenix, and we’re excited to bring it to life.
Now you can:
🚀 Run prompts against Bedrock-hosted models directly in Phoenix
🔁 Compare outputs side-by-side with other model providers
📊 Track usage, latency, and cost—instantly
🧪 Fine-tune prompt strategies without switching tools
And that’s a wrap for Observe 2025 feature announcements! Thanks for tuning in and we’ll see you next year!