


The Next Generation of Machine Learning Monitoring

Aman Khan
Group Product Manager
We are excited to announce the next evolution of machine learning (ML) monitoring to help teams scale their ML needs with increased automation, customizability, and flexibility.
Evolving Monitoring for Evolving ML Needs
It’s no secret that AI technology is rapidly evolving and maturing with a wider adoption across all industries. With companies like Home Depot or John Deere deploying models into production to help with their overall business goals, enterprise AI spending is forecast to eclipse $200 billion by 2025. This also indicates that ML technologies are quickly maturing to accommodate various use cases across the board.
As technologies evolve, they become more complex, scale increases, and applications become more impactful – yet, ML monitoring has largely remained the same while the rest of the industry has evolved. As it stands, ML monitoring has ranged from home-brewed Jupiter notebooks to Grafana dashboards and keeping tabs on metrics with end-to-end MLOps platforms. This involves a manual process of creating and identifying when metrics deviate from expected behavior, as most monitoring systems lack workflows to configure monitors and metrics easily.
The Next Generation of Monitoring
While we’ve talked a lot about individual models and monitors in the past, the increasing reliance on AI systems means monitoring needs to go the extra mile and encompass scale as a priority. For Arize, this means ML monitoring must accommodate hundreds or even thousands of models with thousands of features – all with unique requirements and little human intervention.
Model monitoring for scale helps accelerate continuous improvements, catch issues in production sooner, and requires less oversight than before. To achieve this, we identified three major principles to help evolve model monitoring for scale:
- Automation with flexibility
- Programmatic monitoring access
- Native alerting integrations
Let’s break down what that looks like in the Arize platform.
Automation with Flexibility
Setting up new monitors for a new model has to be easy. Especially with regards to scale, onboarding hundreds or even thousands of models necessitates building reliable automatic workflows to glean necessary information at an appropriate time.
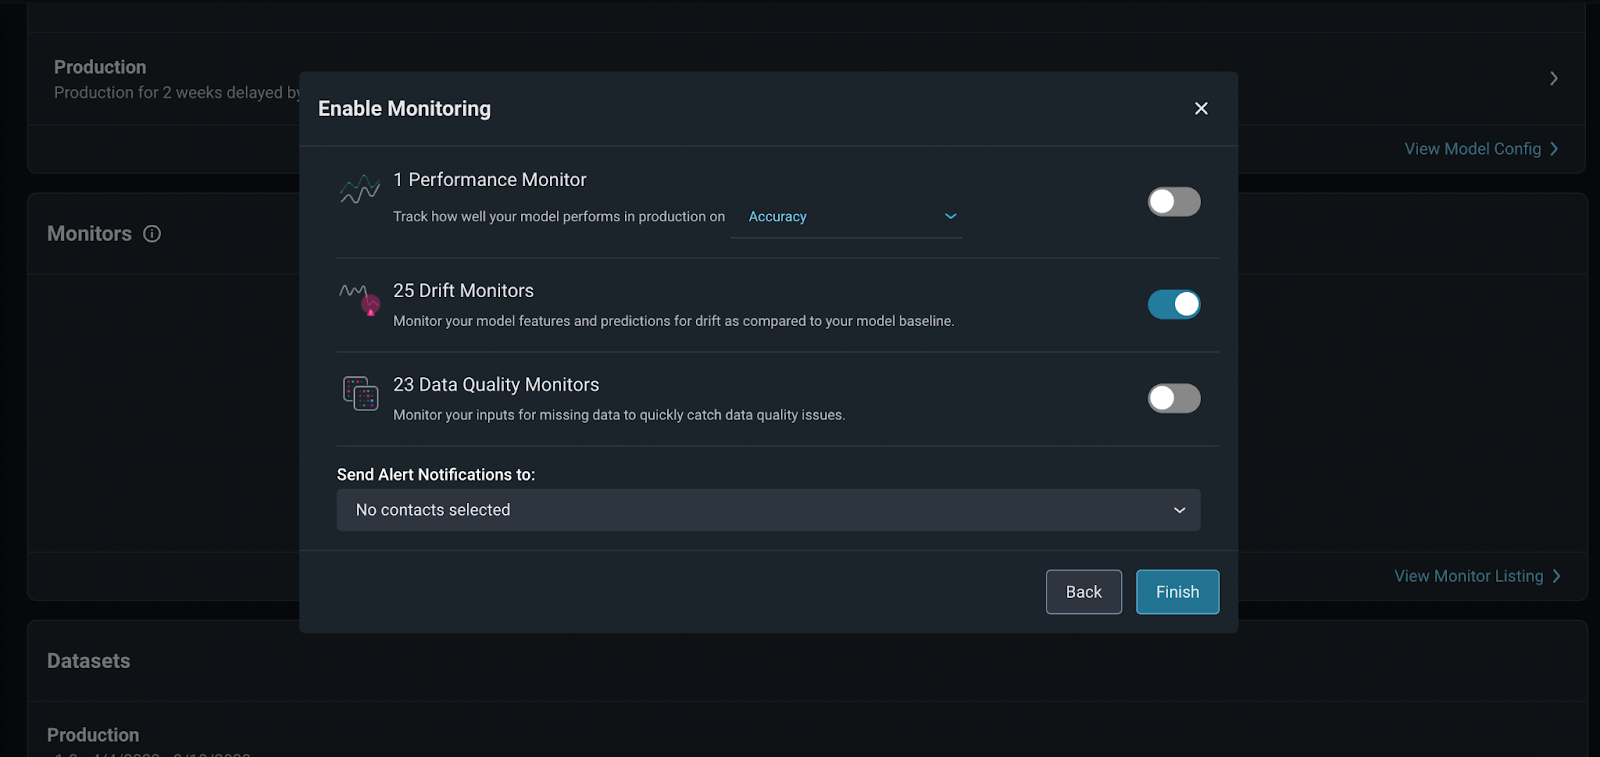
The Arize platform automatically configures monitors based on your data. Upon uploading your data, a pop-up appears to help with automatic monitor creation. You have the option to choose an evaluation metric and a positive class, the ability to enable or disable a monitor type, and a drop-down menu to configure your alerts.
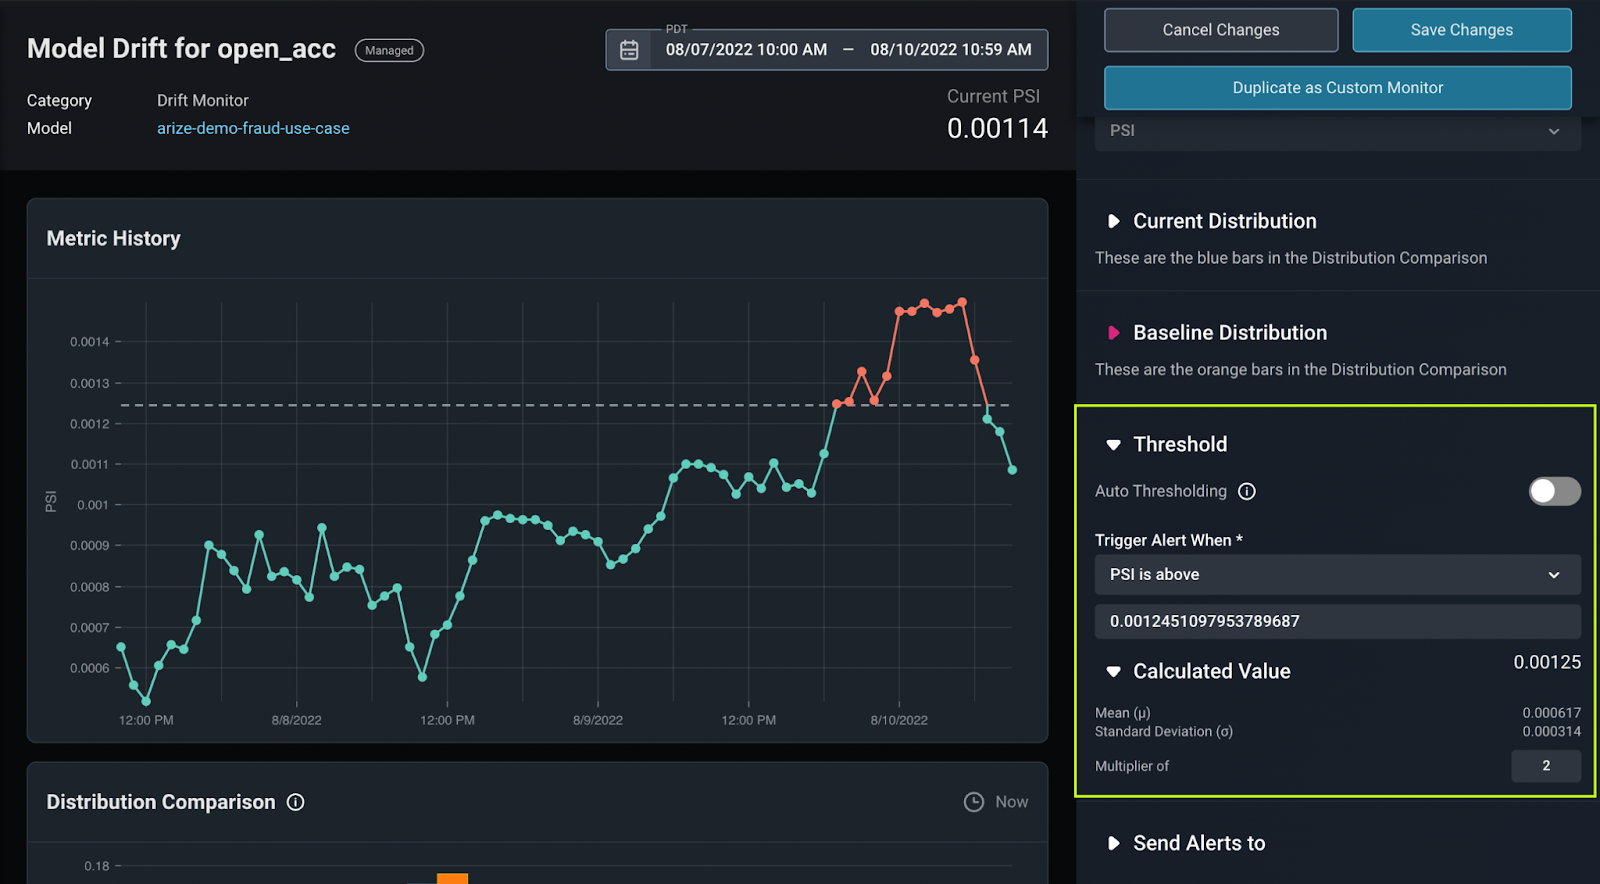
Automatic monitors are achieved by generating automatic thresholds with a statistical understanding of your data’s variance. From there, Arize produces an initial view of your model’s features and performance. Feel free to toggle automatic thresholds on or off, and use our standard deviation calculator to edit your multiplier.
Automated model monitoring for scale also allows you to identify, root cause, and resolve your model’s issues seamlessly. With simple troubleshooting workflows and even kicking off automated retrain jobs, this new iteration of model monitoring is ready to handle anything your model encounters in the real world.
Programmatic Monitoring Access
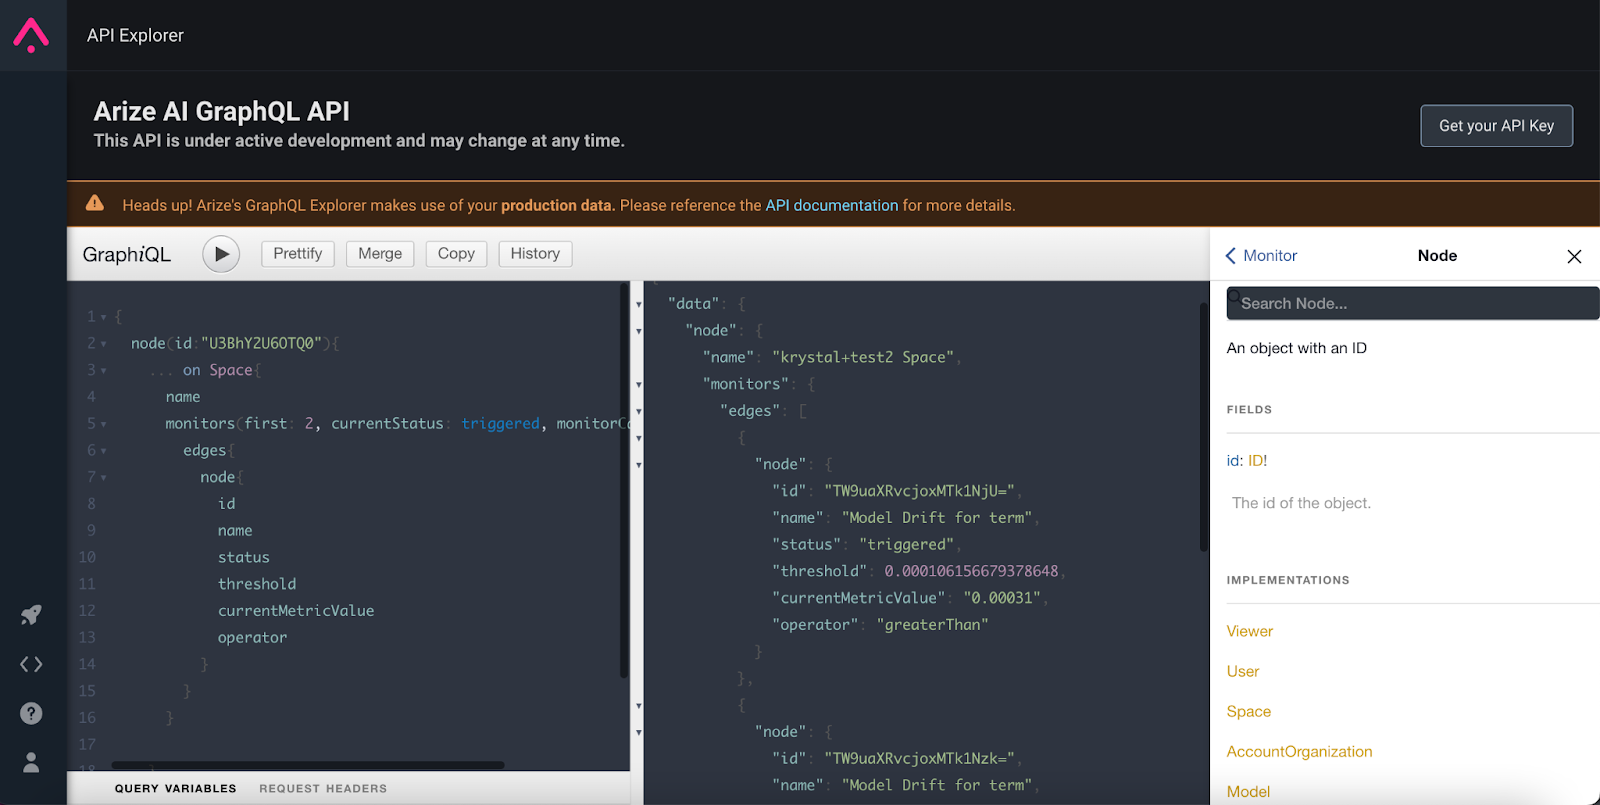
While Arize’s UI helps visualize problematic model segments with dedicated workflows, we understand the desire to remain within your own infrastructure. That’s why we created a public-facing API that integrates model monitoring into your existing infrastructure with enhanced customizability, flexibility, and scalability in mind.
Our public-facing GraphQL API lets you:
- Create custom features for large and complex models
- Bulk edit, create, or delete monitors
- Create complex conditional cases
- Export configurations
By embracing this approach, Arize is able to offer an expanding ecosystem of applications: Terraform, Retrain, data collection, downstream models, and CI/CD workflows. With programmatic access, your monitoring needs are available at any time within your infrastructure.
Native Alerting Integrations
What are monitors good for if you aren’t immediately alerted when a model requires your attention? Native integrations with your existing alerting tools close the loop when surfacing, monitoring, and improving your models in production.
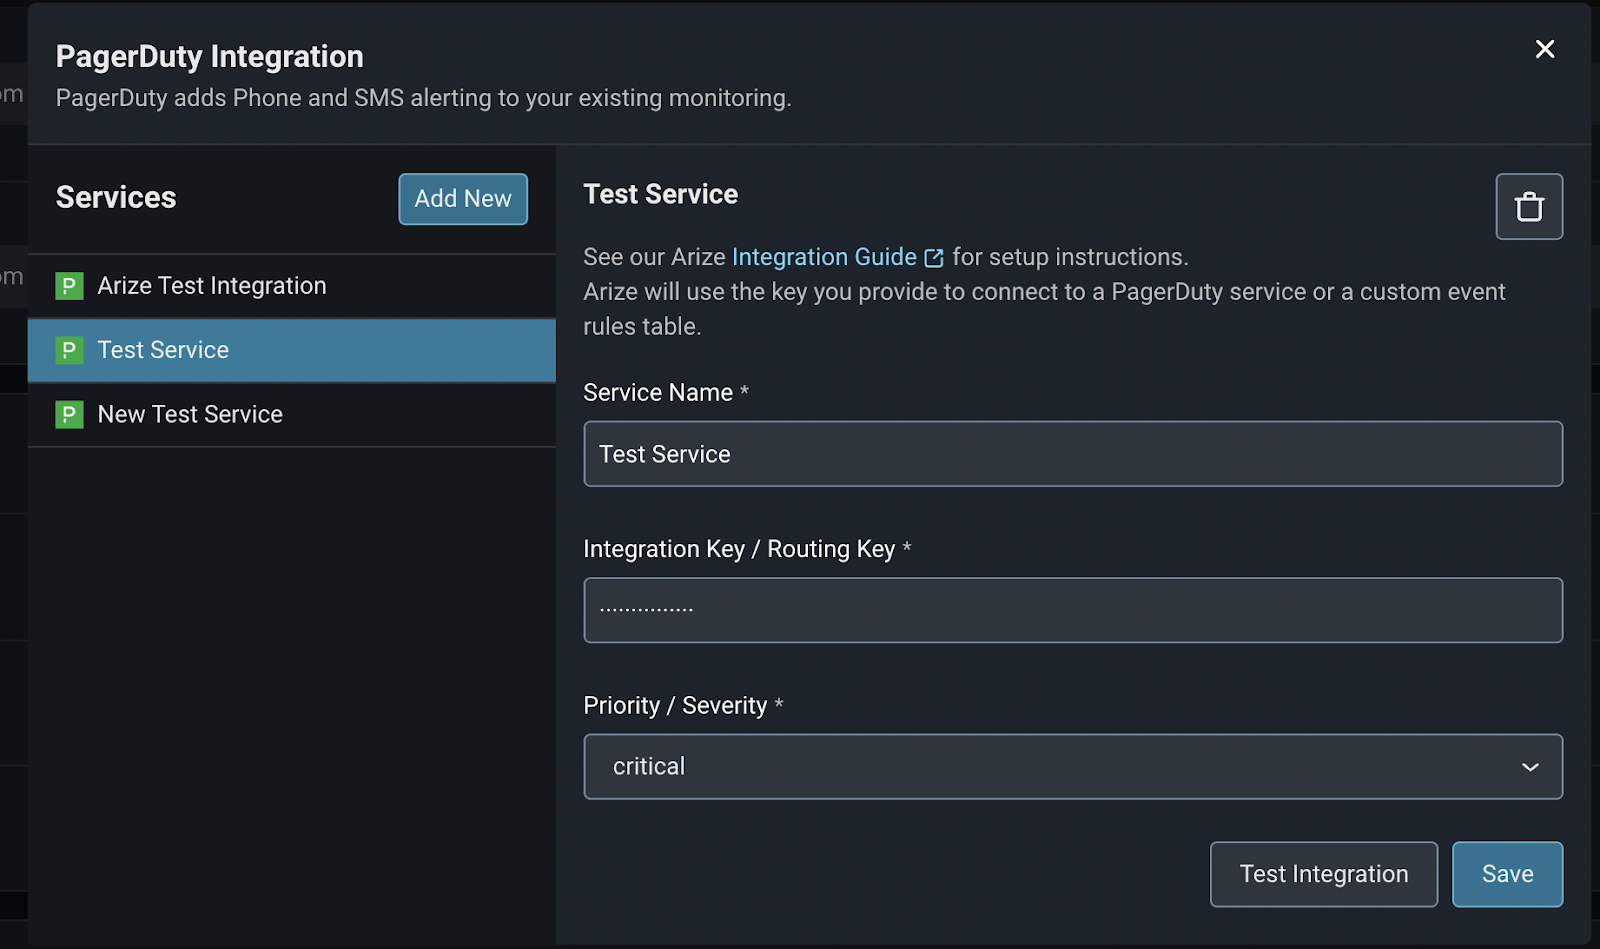
Arize is now natively integrated with Pagerduty and OpsGenie to tailor alerts to specific model dimensions and metrics that matter the most. Send comprehensive metadata via your incident management flow to quickly catch and debug your model issues, and store integration keys at the organizational level for easy setup and system organization.
Access your alerting integrations to configure new services, edit existing services, and set custom services specific to your model or monitor.
We know that your organization and tech stack may be complex, so Arize’s goal is simple: make model monitoring automated and seamless for you to identify and resolve issues faster.
Conclusion
Gone are the days of not knowing when your model will break next or how to fix it, no matter how many models you have in production. Arize enables you to automatically configure monitors and thresholds for all your models, programmatically access Arize’s monitoring in your infrastructure, and ensure the right person is in the know when an alert goes off.
Ready to get started? Sign up for a free account, check out our docs or schedule a demo with our team today.