Changing binning for numeric features
We offer 4 types of binning for numeric features: You can try out different visualizations in the feature details page. When you change your binning option, you will be able to update binning for that feature across the platform. This will affect:- PSI calculations
- Drift monitors - both visualization and PSI calculations
- Performance tracing breakdown for that feature
- Model overview page (PSI value)
Quick guide:
- If you have approximately normally distributed data, use median centered bins (the default).
- If you have a feature that encodes a boolean or an ID, use discrete bins.
- If you have a feature that’s represented by only a small range of integers, such as number of actions in a day, try discrete bins.
- If you want to view your feature with exactly equal width bins, use the equal width bins option.
- If you already know your binning strategy or have business logic with hard cutoff points, use custom bins.
Binning Options for Data Visualization:
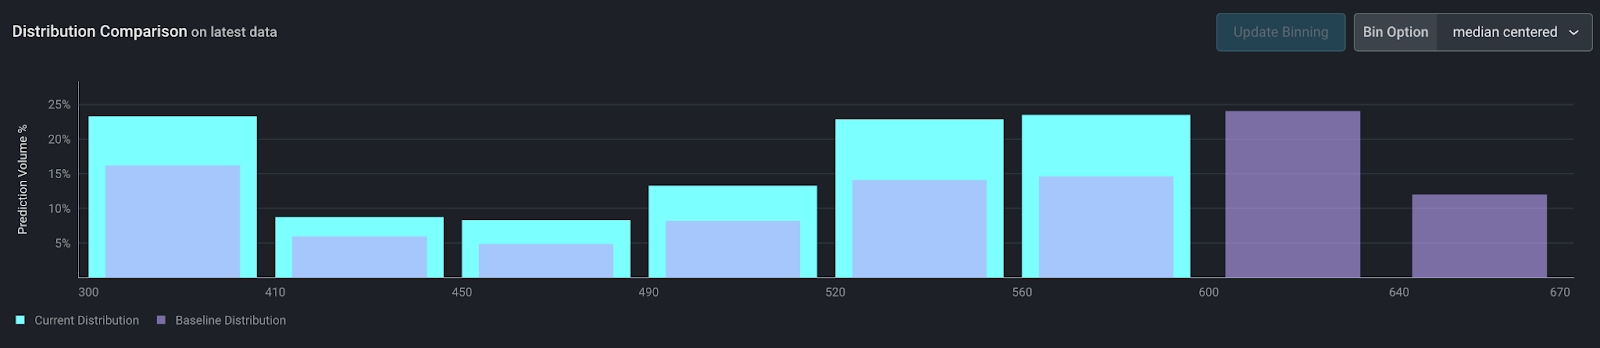
Median centered binning (default)
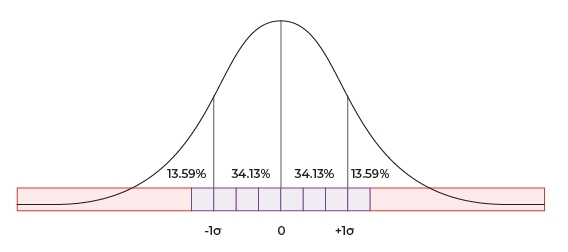
For numeric only This is our default binning method - it works well for normally distributed data but is good for highly skewed data as well. This method creates up to 10 bins, with the following constraints:- The center of the bins (the division between bins 5 and 6) is at the median.
- The 8 center bins have equal width. The width of each bin is ⅓ of the standard deviation of the data. These are the purple squares below.
- The edge bins have variable width and end at the min/max of the dataset in order to account for long tails. These are the red rectangles below.
- Bins on the edge with zero data will be removed - possibly producing less than 10 bins.
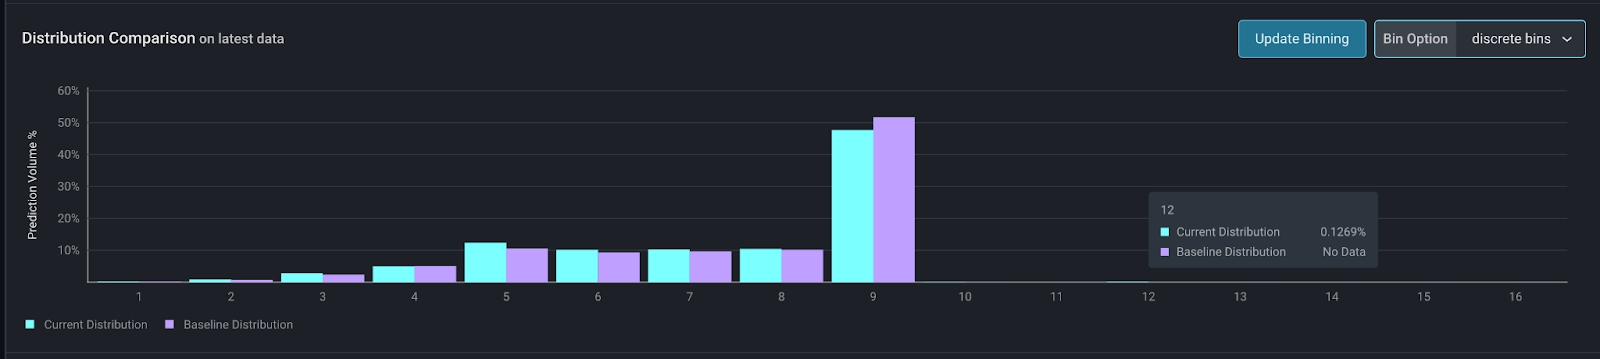
Discrete bins
For numeric or categorical features Discrete bins allows users to see each value independently in the distribution chart. Note that for categorical features, this is the only binning option. For numeric features, this works particularly well for these use cases:Booleans or IDs
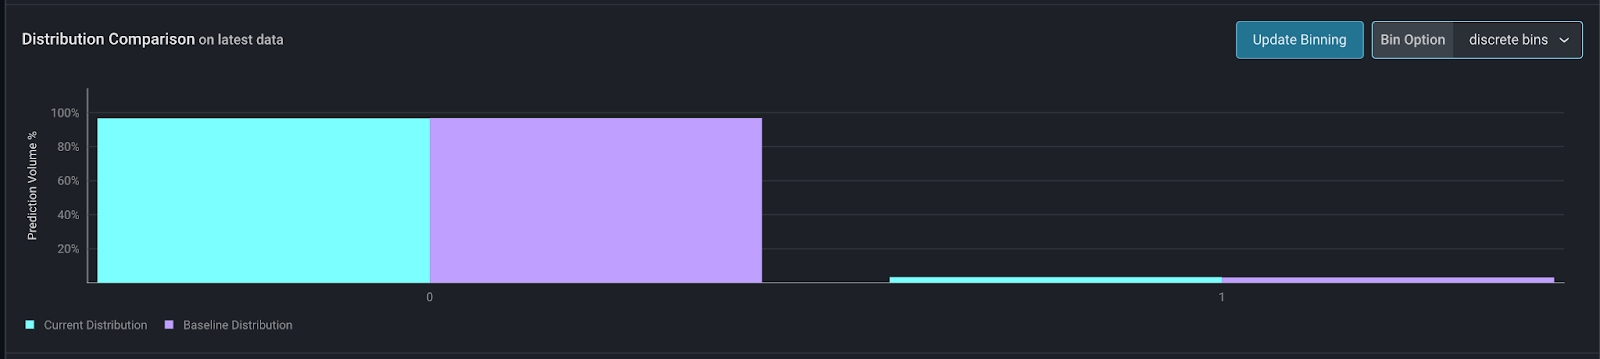
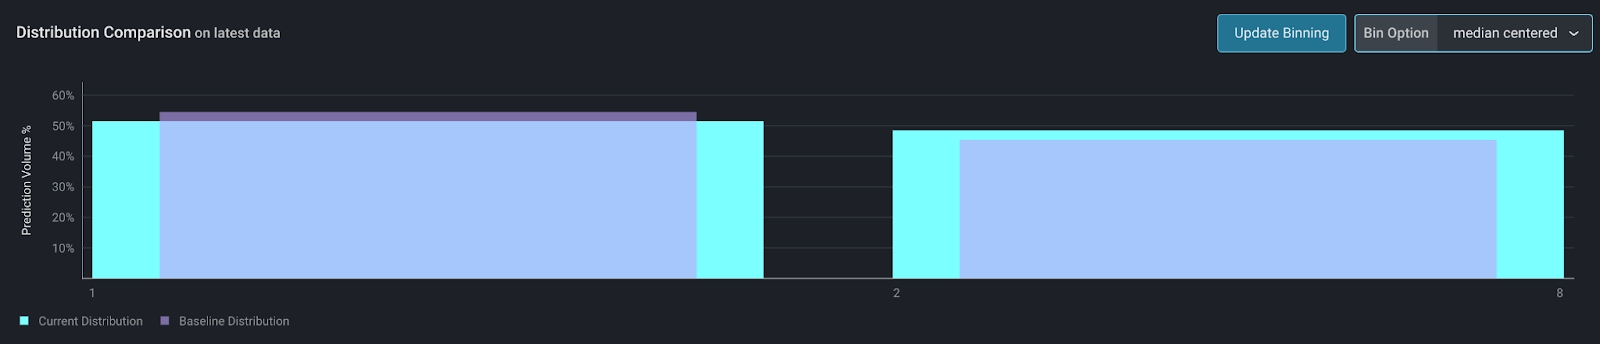
Sometimes, a boolean value or an ID may be expressed as an integer. Since the numeric value of these features is not actually relevant, using median centered bins above would not produce the right results. For example, this is what a boolean value looks like with median centered bins.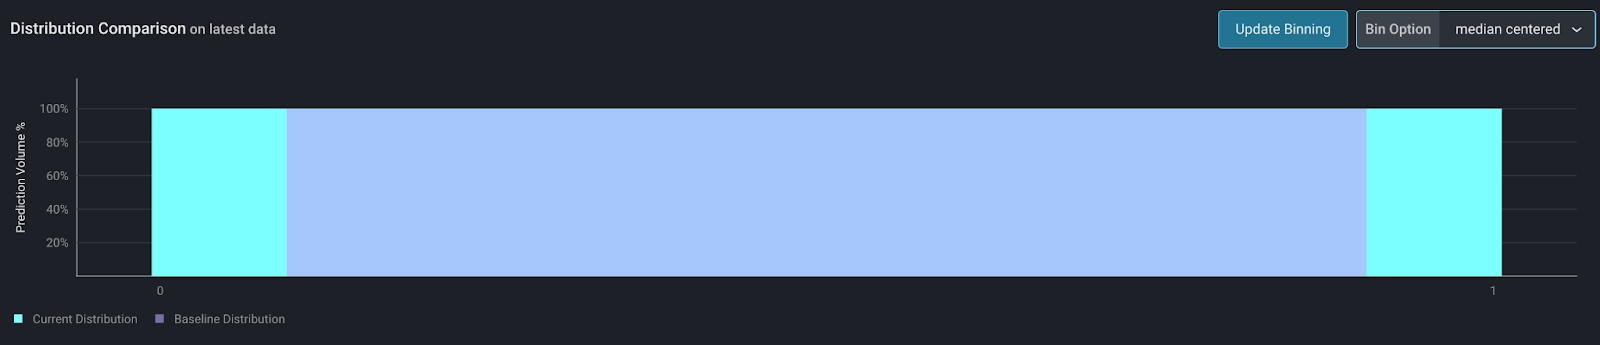
Small integer values
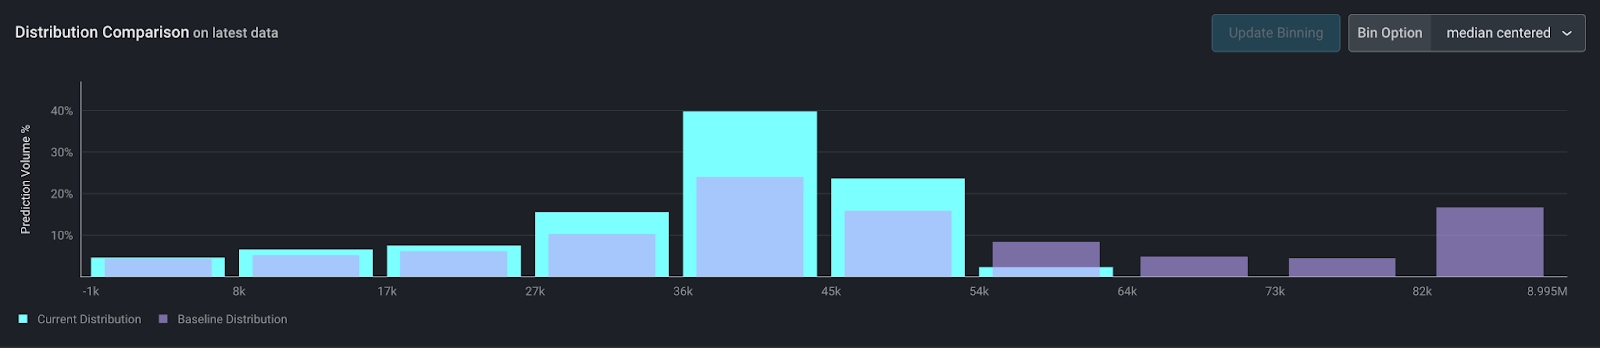
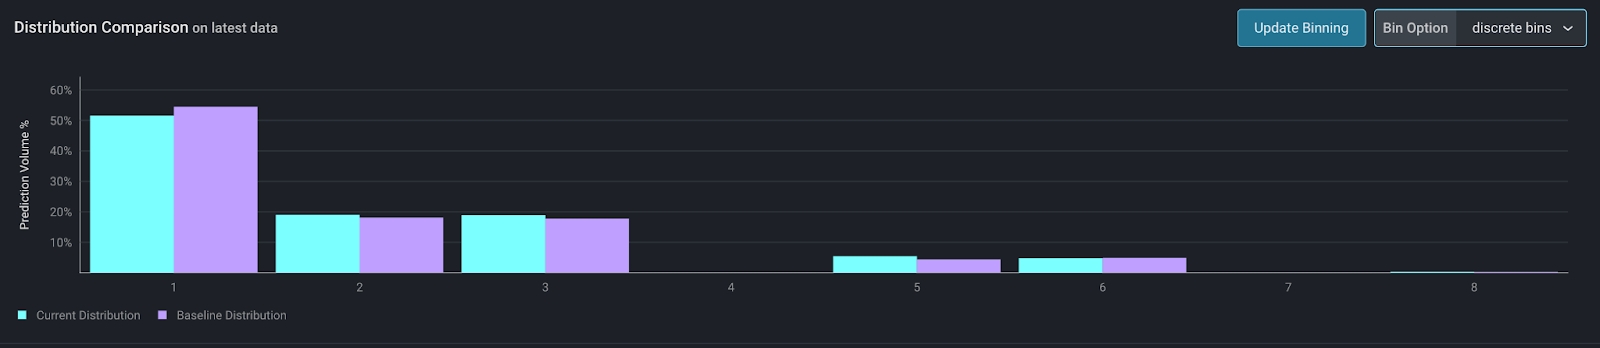
For small integer ranges, such as a count, discrete bins offer a more detailed view of the data than median centered bins. For example, this is a count of the orders in a day. With a small number of unique values, discrete bins offer a more granular view of the data.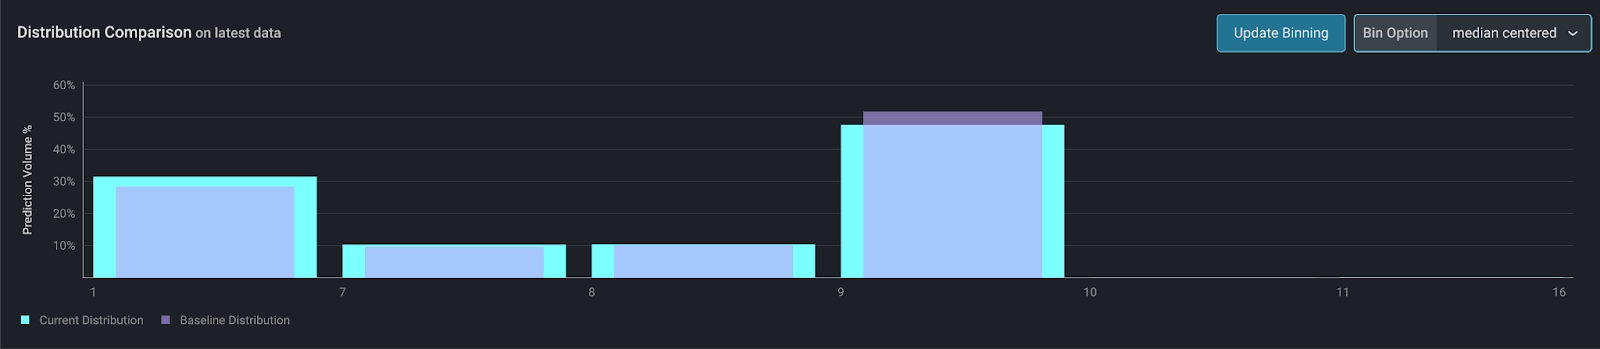
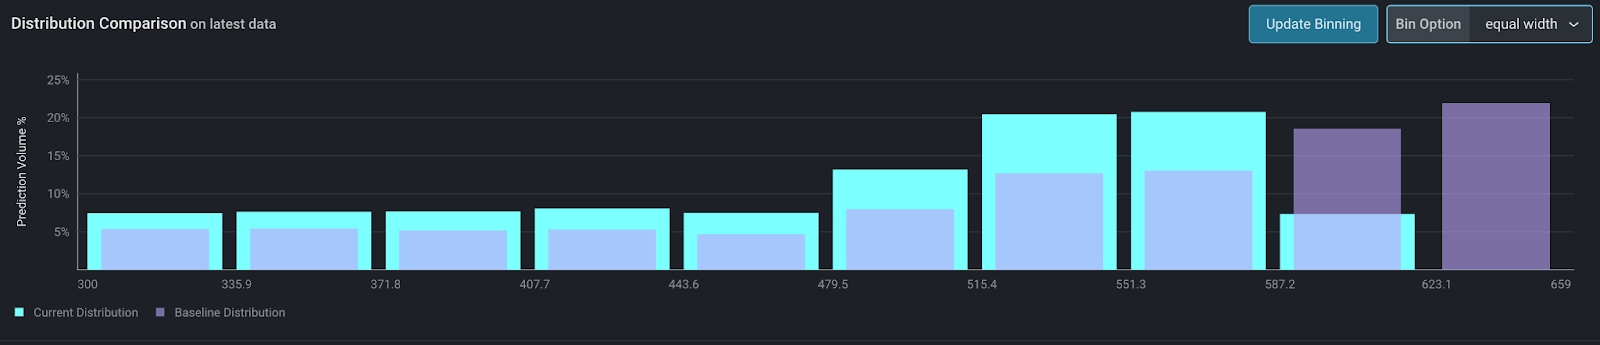
Equal width bins
For numeric features only This option creates equal width bins. The bin width is simply(max - min) / num_bins, where num_bins is specified by the user.
This option is useful for fixed numeric ranges, for example, FICO scores.
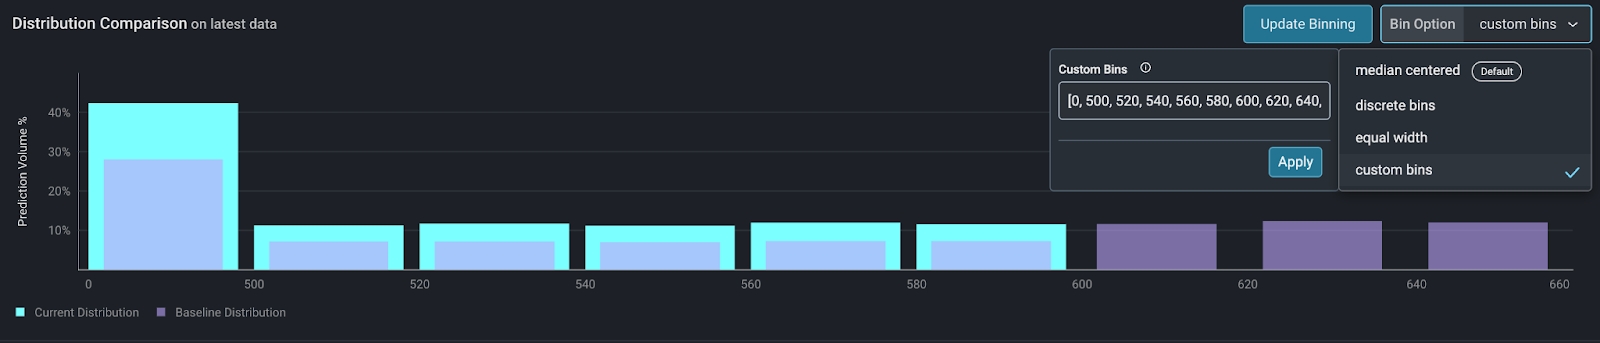
Custom bins
For numeric features only Custom bins offer ultimate control over the visualization of numeric data. This is helpful when you already know how to visualize your data, either from prior analysis, or from a business perspective where certain cutoffs already exist. Using the same FICO score example, creditors may have certain cutoffs for FICO scores. Say, a FICO score below 500 results in an automatic application rejection. For scores above 500, every 20 points results in a better interest rate than the previous bucket. Aligning the binning strategy with business logic ensures the drift visualization is relevant.