Documentation Index
Fetch the complete documentation index at: https://arize-ax.mintlify.dev/docs/llms.txt
Use this file to discover all available pages before exploring further.
Step 1: Install Arize
arize, import dependencies, and attach your Arize API Key and Space ID:
Step 2: Download Dataset
To easily get started, we’ll prepare a simple Classification Model dataset from SciKit learn to send via the Python SDK. For this example, download theload_breast_cancer dataset, assign the dataset to a variable, and preview the data to better understand what we’re working with.
Step 3: Extract Features, Predictions, and Actuals
The dataset contains all the information we need to create a Pandas dataframe. For any dataset, extract the features, predictions, and actuals data. For this example:breast_cancer_taget_names to their corresponding breast_cancer_targets to use as a human-comprehensible list of actual labels.
target_name_transcription).
Note: We’ve duplicated the actual_label column to create a prediction_label column for simplicities sake. Data will not populate in the Arize platform without a record of prediction data.
Step 4: Log Data to Arize
Define the Schema so Arize knows what your columns correspond to. Log the model data.Step 5: Visualize Model Performance
Now that you’ve uploaded some data to Arize, check it out on the platform. Navigate to the ‘Performance Tracing’ tab within your model. Here, you’ll see an interactive performance-over-time chart and a performance breakdown visualization.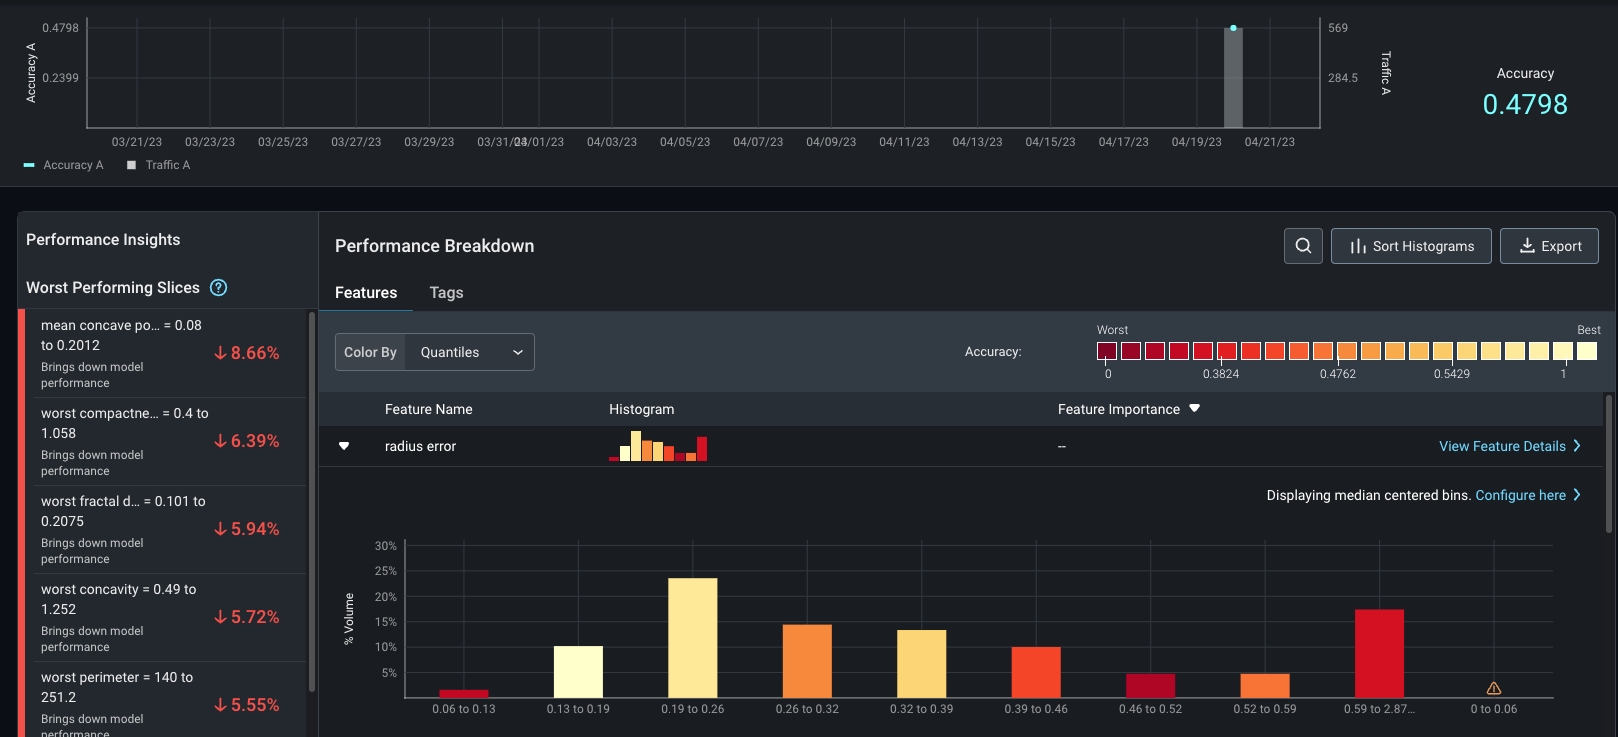
Step 6: Setup One-Click Monitoring
Create monitors to keep an eye on key performance, drift, and data quality metrics. Navigate to the ‘Monitors’ tab and enable relevant prebuilt monitors for your use case.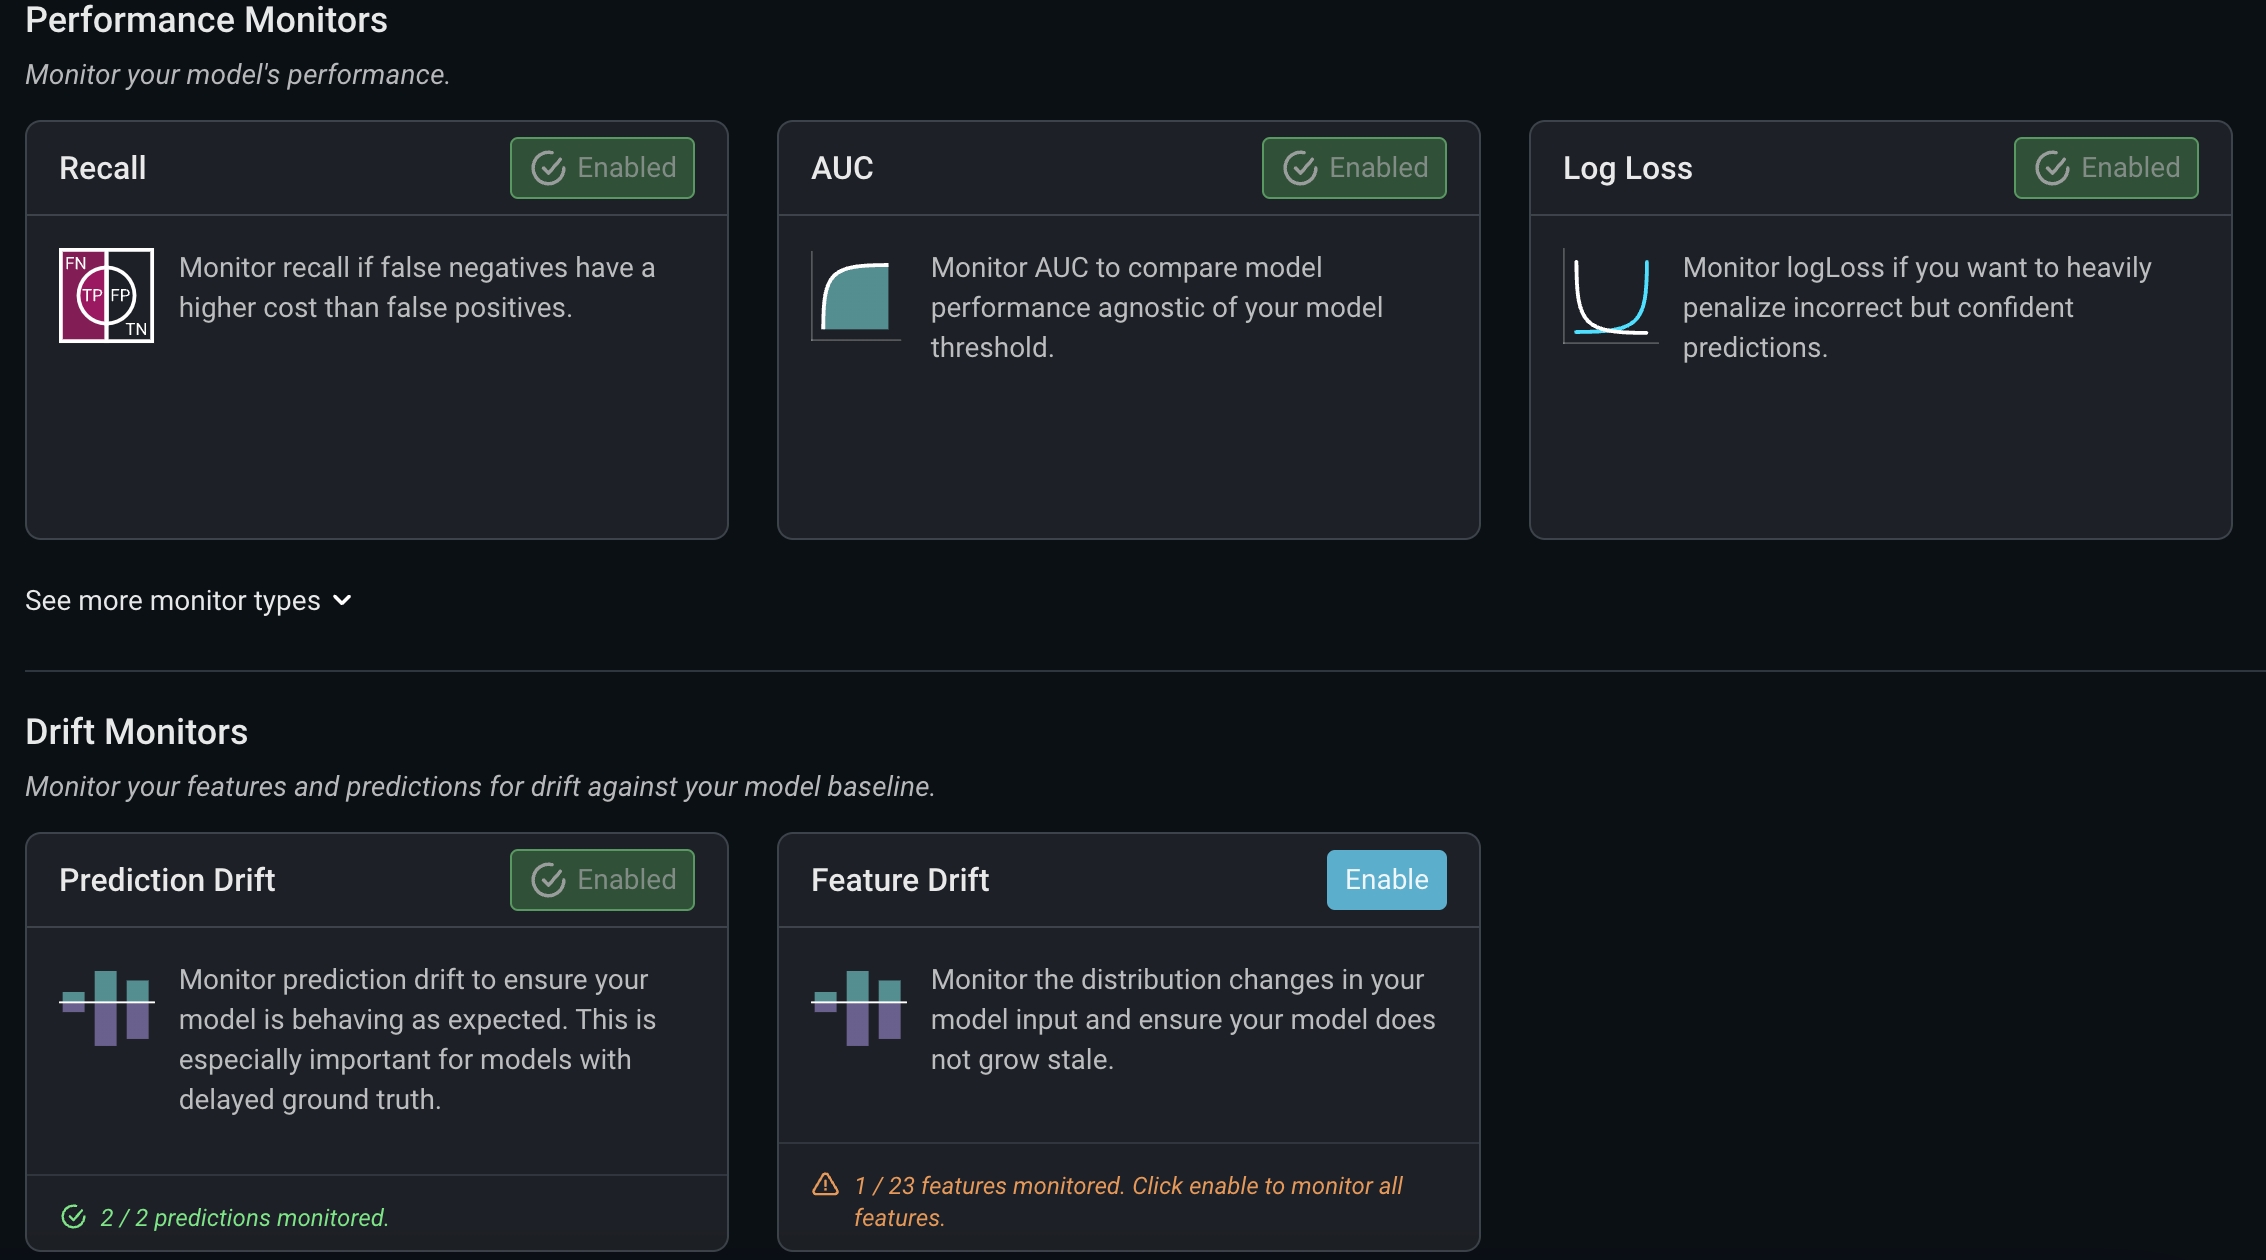
Step 7: Relax (With Alerting Notifications On)!
Configure alerts on the ‘Config’ page within the monitor’s tab to keep you posted when your model changes unexpectedly.
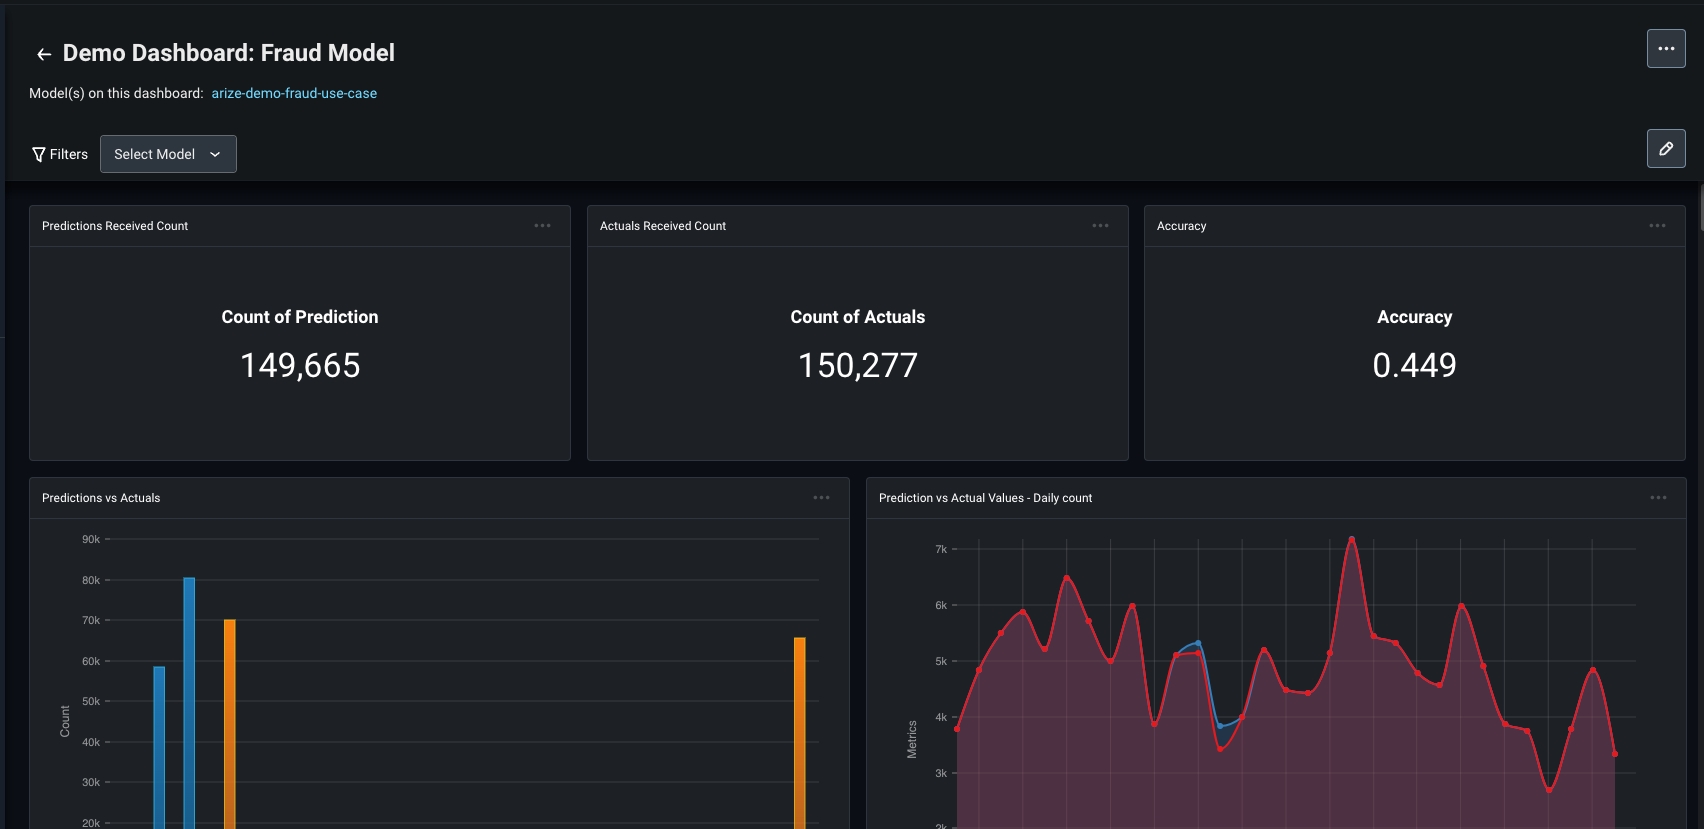
Extra Credit: Create A Dashboard
We get it - ML observability is a lot of fun! Keep an eye on key model health metrics with dashboards for a single pane of glass view of your model. Create a custom dashboard, use a pre-built template, and simply copy and paste the dashboard URL to share with your team!