Once you’ve set your monitors, learn how to decipher their status and set up an alerting system.Documentation Index
Fetch the complete documentation index at: https://arize-ax.mintlify.dev/docs/llms.txt
Use this file to discover all available pages before exploring further.
Monitor Status
Monitors are continuously evaluated according to each monitor’s configurations — an evaluation will result in one of the following statuses for a monitor, ordered by severity: When viewing the health of your model for a monitor type (drift, performance, or data quality), the status shown will be based on the highest severity of any of the model’s monitors for that type. For example, if you are monitoring your model with several performance monitors, such as Accuracy and F1-score, and at least one of them has a “Triggered” status, the status shown for the model’s performance will be “Triggered”.
Healthy
No action is needed!
No Data
This shows when the monitor does not have recent data in the evaluation window. This can be resolved by extending the evaluation window or uploading new data to Arize. All live models should be configured to continuously send your model’s latest data in batch or real-time operations to keep monitors up-to-date.
Triggered
The Arize platform offers drift and performance troubleshooting to root cause model issues and pinpoint specific feature values or cohorts of data where the model performing poorly.
Monitoring Alerts
Once you set up your monitors, you’ll want to be alerted when your model deviates from its expected ranges. Arize offers alerting integrations for alerting tools and methods. Send an alert via email, Slack, OpsGenie, and PagerDuty. Within these tools, you can add configurations to edit your alerting cadence, severity, and alert grouping.
HTTP webhooks for monitor alerts
Webhooks let your own systems react when a monitor’s status changes, without polling the Arize UI.Prerequisites
- Webhook destinations must exist for your organization (create them under Organization settings → Webhooks).
- On each monitor, notifications must be turned on—webhook delivery respects the same notifications toggle as email and other alert channels.
- In the monitor’s notification step, subscribe each destination webhook to the events you care about (see below).
Subscribed events
Webhooks are sent on status transitions. Supported event names in the JSON body are:| Event name | When it fires |
|---|---|
monitor.triggered | The monitor becomes Triggered when it was not already triggered. |
monitor.cleared | The monitor becomes Cleared (healthy) when it was not already cleared. |
monitor.no_data | The monitor enters No data when it was not already in that state. |
Payload and delivery
- Deliveries use HTTP POST with
Content-Type: application/json. - The JSON body includes the event name, a unique
event_uuid,space_idandaccount_organization_idas global identifiers, a timestamp, and monitor fields such asmonitor_id,monitor_name,model_name,status,previous_status, a link to the monitor in the app when available, and metric or threshold details when applicable.
Monitor Downtime
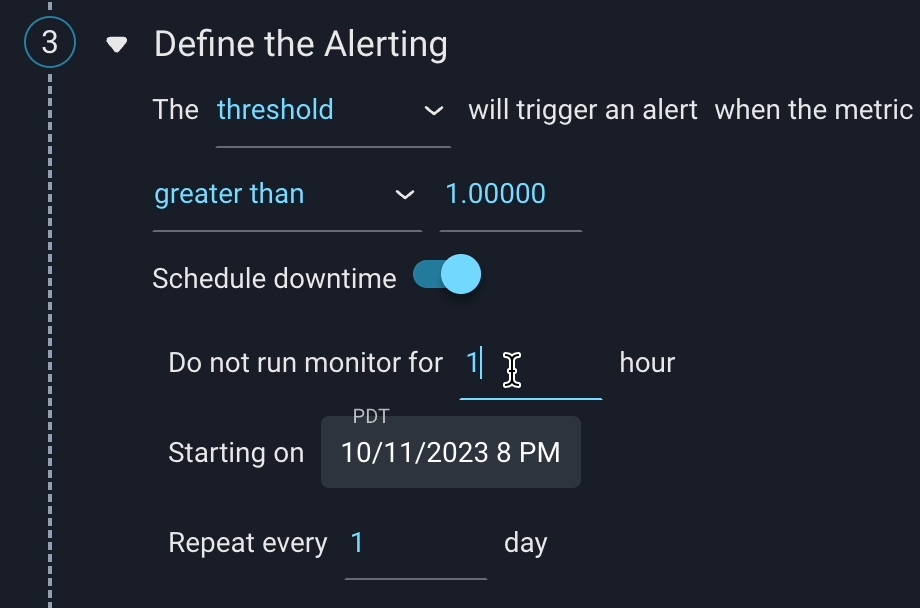
Schedule downtime to temporarily pause monitor evaluations for a given timeframe. During downtime, your monitor will not assess the metric or create new alerts. Use downtime to silence your monitors during expected intervals when your metric or alerts would not provide meaningful insights, such as during joins, expected low activity times, or weekends.Setting up Monitor Downtime
You can schedule downtime in the monitor configuration panel. By default, downtime will be off: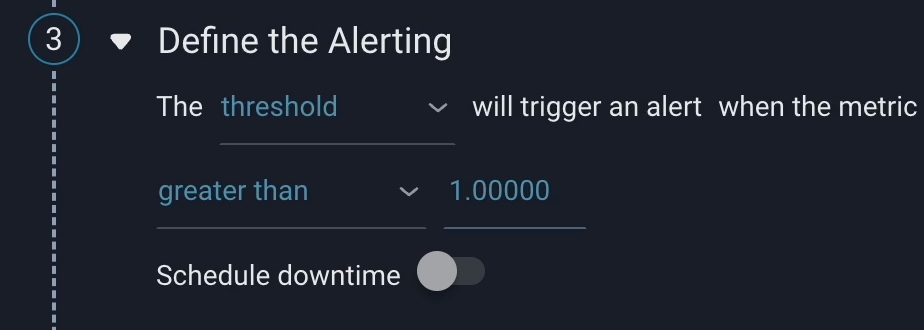
Schedule downtime toggle under Define the Alerting. In this section, you can customize the time window during which the monitor should not be evaluated. You also need to specify the start date and set the cadence for the downtime schedule.