This post builds on a talk from Arize Observe 2026 given by Nate Slater, Startup SA Leader at AWS.
The flame graph, once the bogeyman of distributed systems, is starting to look almost quaint.
Nate Slater’s favorite example contains 40 or 50 layers of spans, with asynchronous hops, database calls, and enough cross-service traffic to turn a Saturday incident into a scavenger hunt. An agentic application adds another dimension: prompts, model responses, retrieved context, memory operations, tool arguments, MCP calls, and sometimes other agents, all branching through a path that may change the next time the same request runs.
During his talk at Arize Observe 2026, Slater asked whether hundreds or thousands of agents calling backend services would make debugging easier. The answer was obvious enough that he supplied it himself: It will get harder.
Agent systems produce more telemetry than traditional applications while making each trace more difficult to interpret. Yet the same technology responsible for this complexity offers a possible escape route.
“We can use the same AI agentic technology that’s creating this explosion of trace data to actually reason about the traces themselves,” Slater said.
That inversion points toward the next stage of AI agent observability. Developers need more than a record of what ran. They need a layer that can reconstruct intent, investigate causality, and explain why a system behaved the way it did.
Why AI agent observability is a different debugging problem
Application performance monitoring was designed around software that generally follows repeatable execution paths. Given the same code, state, and input, developers can usually reproduce the same behavior, inspect the failing span, and trace the problem toward a service, query, or dependency. Agents weaken that assumption.
The same request can produce a different plan, retrieve different context, call a different tool, or pass different arguments. An agent might reach an acceptable answer through several trajectories, which means that variation alone does not indicate a failure. Meanwhile, two traces that appear structurally similar may produce dramatically different business outcomes.
Where APM tells developers where time went, AI agent observability must also reconstruct why a decision occurred.
That requires evidence from several layers of the system:
- Instructions and context presented to the model
- Plan or trajectory the agent followed
- Tools and other agents it selected
- Arguments sent to each tool
- Data returned from retrieval and memory
- Downstream application behavior triggered by those decisions
- Final outcome and the evaluations applied to it
A latency spike or HTTP 500 can identify a symptom. It cannot, on its own, explain whether the agent selected the wrong tool, generated an invalid argument, relied on stale memory, or correctly called a service that later failed.
What makes production AI agents harder to debug?
Four characteristics make agent failures especially difficult to investigate.
| Failure mode | What changes | Evidence developers need |
|---|---|---|
| Nondeterministic execution | Replaying the same request can produce a different plan, tool call, or response. | Prompts, model and generation settings, retrieved context, complete trajectories, and outputs |
| Compounding error | Every agent, model, and tool hop adds another opportunity for the trajectory to fail. | Parent-child spans that connect decisions across agents, tools, and backend services |
| Temporal drift | Memory updates and changing context can alter future behavior without a conventional code deployment. | Versioned prompts, memory state, retrieval context, tool schemas, and configuration |
| Signal collapse at scale | Rare but serious failures can disappear inside millions of otherwise ordinary traces. | Intent, risk, outcome, evaluation scores, and the reason each trace was retained |
Compounding error becomes particularly unforgiving in multi-step systems. Under a simplified independence assumption, the probability that an entire trajectory succeeds is approximately the product of its individual step-success rates:
P(success) ≈ p₁ × p₂ × … × pₙ
When five steps each succeed 95 percent of the time, the complete trajectory succeeds roughly 77 percent of the time. Real agent steps are rarely independent, although the calculation illustrates why longer trajectories create a much larger failure surface.
Temporal drift introduces a subtler problem. An agent that reads and writes memory can change its future behavior even when its source code remains untouched. A new entry in a memory file, a different retrieval result, or an altered tool description can redirect the next execution path.
Reproducing an incident therefore becomes a sampling problem. Developers need enough traces to characterize the distribution of behavior, along with evaluations that define which variations remain acceptable.
Telemetry that cannot explain itself
Slater used a deliberately blunt phrase for conventional data collection: “dumb instrumentation.”
He was not arguing against instrumentation. A system that emits metrics, logs, and traces is vastly easier to operate than one that emits nothing. His point concerned the limits of the data itself.
“The data that you collect doesn’t explain anything about itself,” Slater said.
Traditional observability platforms store, index, and query telemetry. During an incident, a human still needs to form a hypothesis, identify the relevant data, write the right query, and decide whether two events have a causal relationship.
That process was already difficult in distributed systems. Agents add a probabilistic decision layer whose internal state is scattered across prompts, messages, tool calls, memory, retrieval, and application telemetry.
An intelligent observability layer should help with four forms of reasoning:
Causal investigation. The system should assemble evidence into ranked hypotheses, distinguishing a metric that merely changed near an incident from a condition that plausibly caused it.
Intent-aware detection. The system should judge a trajectory against the task the agent was attempting to complete. An unusual tool sequence may be harmless for one intent and dangerous for another.
Adaptive baselines. The system should account for changes in traffic, user intent, memory, and system behavior rather than treating every deviation from a static average as an incident.
Hierarchical observation. Specialized agents should inspect the behavior and telemetry of other agents, allowing investigation capacity to scale alongside the agent fleet.
This reasoning layer changes the developer’s starting point. Instead of beginning with a dashboard and guessing which query to run, an engineer can begin with the incident: What failed? Which trajectories were affected? What changed? Which evidence supports the proposed cause?
How Amazon Bedrock AgentCore and Arize AX fit together
A production observability architecture for agents needs distinct layers for execution, telemetry, reasoning, and improvement.
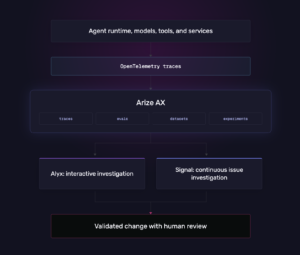
Amazon Bedrock AgentCore provides composable infrastructure for running production agents, including runtime, memory, gateway, identity, observability, browser, and code-interpreter capabilities. AgentCore emits OpenTelemetry-compatible telemetry, allowing agent execution data to flow into an existing monitoring and observability stack.
Arize AX adds the AI engineering context needed to interpret that execution record. Traces capture what the application did, while evaluations measure the quality of the behavior. Datasets and experiments then give teams a structured way to test whether a proposed change improves the system without introducing regressions.
Alyx, the AI engineering agent built into Arize AX, supports interactive analysis across traces, prompts, datasets, and evaluations. Signal continuously investigates production traces, ranks issues, and attaches supporting evidence; when connected to a repository, it can also carry an investigation toward a proposed fix for review.
Together, these components separate the concerns developers need to manage. The runtime provides a controlled environment for execution, the telemetry preserves the evidence, and the reasoning layer interprets the resulting behavior.
Coding agents have automated the beginning of the loop
Slater spends enough time with coding agents that, as he joked during the talk, “I was worried my wife was going to think I was having an affair with somebody named Claude.” Code generation has become ambient for many developers. An agent can scaffold a service, write tests, refactor a module, and explain an unfamiliar repository before a human engineer has finished reading the ticket.
The rest of the software lifecycle has not accelerated at the same rate. Slater described building containers, pushing them into an environment, searching through logs, copying an error back into Claude Code, and asking the agent to try again. The workflow succeeds because the developer already knows where the relevant logs live and which messages matter. That knowledge becomes a bottleneck as the system scales.
When an enterprise runs hundreds or thousands of agents, developers cannot manually inspect every invocation or decide which trace deserves attention. An observing agent can begin with the production data, cluster related failures, identify representative traces, form a root-cause hypothesis, and select the cases that should become an evaluation dataset.
The coding agent can then work from evidence rather than a pasted error message. This then closes a critical gap between generation and operation. Code generation may initiate the loop, although production traces determine whether the code actually worked.
The real risk is blast radius
Ten agents running on a developer’s laptop have a limited sphere of influence. The same agents become a different operational problem once they move into a persistent cloud environment, receive production credentials, call internal APIs, or begin modifying CI/CD systems. At that point, observability becomes part of the control surface.
Enterprises need an evidence trail that explains which agent acted, which instructions and context informed the action, which tools it invoked, which data changed, and whether the result satisfied the intended policy and business outcome.
Blaming an autonomous system will not resolve the underlying accountability problem. As Slater put it, telling a regulator that an incident was the agent’s fault amounts to “the dog ate my homework” for AI.
The larger the blast radius, the more important it becomes to preserve interpretable traces and place human approval around consequential changes. An observing agent can investigate and propose a remediation, while the underlying evidence allows an engineer to verify the conclusion before anything ships.
What developers should instrument before their agent fleet scales
A useful AI agent observability strategy begins before production traffic arrives.
- Capture the entire trajectory. Connect model calls, retrieval, memory, tool invocations, agent-to-agent messages, and downstream service spans under a shared trace. Apply redaction and access controls wherever prompts or tool payloads may contain sensitive information.
- Version every decision input. Record the system prompt, model configuration, tool schema, retrieval source, memory state, policy, and application version associated with each execution. Without those versions, reproducing historical behavior may be impossible.
- Attach intent and outcome. Infrastructure metrics reveal whether a request completed, while intent and outcome fields reveal whether it completed the correct task. Include task category, expected result, final state, and relevant evaluation scores.
- Sample according to risk. Uniform sampling can discard rare trajectories that matter most. Preserve traces involving sensitive tools, policy decisions, unusually long loops, anomalous cost, repeated retries, or high-value business actions.
- Turn production failures into evaluation data. Once an incident is understood, add representative examples to a dataset and encode the expected behavior as an evaluation. The resulting regression suite helps prevent the same class of failure from returning.
- Keep the investigation auditable. When an observing agent proposes a root cause or code change, preserve the traces, queries, evaluations, and assumptions that support its conclusion. Human review becomes far more useful when the agent presents evidence instead of confidence alone.
From agent observability to self-improving systems
The deeper opportunity extends beyond faster incident response. When production behavior can be interpreted, clustered, evaluated, and connected to experiments, observability becomes the entry point to an agent improvement loop. A failure produces evidence; the evidence becomes a dataset; the dataset powers an evaluation; the evaluation tests a proposed change; and the validated change returns to production under human review.
That loop turns traces from passive records into development inputs. Agent proliferation will make production systems more difficult to understand. It will also create systems capable of helping with that understanding, provided developers give them complete telemetry, meaningful evaluations, and controlled access to the improvement workflow.
As the flame graph grows denser, the useful question becomes whether the observability stack can explain it before an engineer spends Saturday night staring at it.

