As the use of large language models grows, so too does the need for tools to understand and optimize their performance. Deploying an LLM-powered application with no observability framework is like driving a car without brakes; technically possible, very dangerous.
Tracing is a powerful observability technique that offers developers an effective way to better see what goes on inside their LLM applications. In a tangle of prompt-response pairs, developers often lose the ability to iterate effectively due to poor visibility into their systems. Tracing solves this issue by letting them see into the black.
In this post, we explore the power of tracing in the context of LLM applications. We will look into how tracing works, uncover the various use cases where it can be invaluable, and guide you through the process of implementing tracing in your own LLM-powered projects.
Let’s dive in!
How Tracing Works
Tracing records the paths taken by requests as they propagate through multiple steps or components of a system. For example, when a user interacts with an LLM application, tracing can capture the sequence of operations, such as document retrieval, embedding generation, language model invocation, and response generation to provide a detailed timeline of the request’s execution.
Some of the key components behind tracing are instrumentation, the exporter, and OLTP.
Instrumentation
For an application to emit traces for analysis, it must be instrumented. This can be done manually by adding tracing code to the application, or automatically through the use of plugins or instrumentors. Arize Phoenix provides a set of instrumentors that can be easily integrated into your application to automatically collect spans (units of work or operation) without requiring manual instrumentation.
Exporter
The exporter is responsible for taking the spans created through instrumentation and sending them to a collector for processing and visualization. When using Phoenix, the exporting process is largely handled under the hood, seamlessly sending the trace data to the Phoenix collector.
OpenTelemetry Protocol (OTLP)
OTLP is the protocol used to transmit traces from the application to the Phoenix collector. Phoenix currently supports OTLP over HTTP, simplifying the integration and ensuring compatibility with the widely-adopted OpenTelemetry ecosystem.
Tracing provides a comprehensive view of an application’s execution, enabling developers to identify and address various performance, operational, and debugging challenges at a scale not possible otherwise. The collected trace data can be further enhanced through the use of annotations, allowing you to capture both user feedback and AI-generated evaluations to drive iterative improvements to your LLM applications.
Implementing Tracing Example
In this example we will build a RAG pipeline and evaluate it with Phoenix Evals.
What is Retrieval Augmented Generation (RAG)?
LLMs are trained on vast amounts of data, but these will not include your specific data (things like company knowledge bases and documentation). Retrieval-Augmented Generation (RAG) addresses this by dynamically incorporating your data as context during the generation process. This is done not by altering the training data of the LLMs but by allowing the model to access and utilize your data in real-time to provide more tailored and contextually relevant responses.
In RAG, your data is loaded and prepared for queries. This process is called indexing. User queries act on this index, which filters your data down to the most relevant context. This context and your query then are sent to the LLM along with a prompt, and the LLM provides a response.
RAG is a critical component for building applications such as chatbots or agents and you will want to know RAG techniques on how to get data into your application.
Building a RAG Pipeline
Now that we understand what RAG is, let’s build a pipeline. We will use LlamaIndex for RAG and Phoenix Evals for evaluation.
!pip install -qq "arize-phoenix[experimental,llama-index]>=2.0"# The nest_asyncio module enables the nesting of asynchronous functions within an already running async loop.
# This is necessary because Jupyter notebooks inherently operate in an asynchronous loop.
# By applying nest_asyncio, we can run additional async functions within this existing loop without conflicts.
import nest_asyncio
nest_asyncio.apply()
import os
from getpass import getpass
import pandas as pd
import phoenix as px
from llama_index import SimpleDirectoryReader, VectorStoreIndex, set_global_handler
from llama_index.llms import OpenAI
from llama_index.node_parser import SimpleNodeParserWe will capture all the data we need to evaluate our RAG pipeline using Phoenix Tracing. To enable this, simply start the Phoenix application and instrument LlamaIndex.
Launch Phoenix in your local terminal using this command:
python -m phoenix.server.main serveYou may need to run the following command in your terminal if it’s your first time using Phoenix:
pip install arize-phoenixIf you’d rather use a cloud-hosted instance of Phoenix, see these instructions.
Back in your notebook, connect to your local instance of Phoenix using:
from openinference.instrumentation.llama_index import LlamaIndexInstrumentor
from opentelemetry.exporter.otlp.proto.http.trace_exporter import OTLPSpanExporter
from opentelemetry.sdk.trace import TracerProvider
from opentelemetry.sdk.trace.export import SimpleSpanProcessor

endpoint = "http://127.0.0.1:6006/v1/traces"
tracer_provider = TracerProvider()
tracer_provider.add_span_processor(SimpleSpanProcessor(OTLPSpanExporter(endpoint)))

LlamaIndexInstrumentor().instrument(tracer_provider=tracer_provider)
For this tutorial we will be using OpenAI for creating synthetic data as well as for evaluation.
if not (openai_api_key := os.getenv("OPENAI_API_KEY")):
   openai_api_key = getpass("🔑 Enter your OpenAI API key: ")
os.environ["OPENAI_API_KEY"] = openai_api_key
Let’s use an essay by Paul Graham to build our RAG pipeline.
!mkdir -p 'data/paul_graham/'
!curl 'https://raw.githubusercontent.com/Arize-ai/phoenix-assets/main/data/paul_graham/paul_graham_essay.txt' -o 'data/paul_graham/paul_graham_essay.txt'


documents = SimpleDirectoryReader("./data/paul_graham/").load_data()

# Define an LLM
llm = OpenAI(model="gpt-4")

# Build index with a chunk_size of 512
node_parser = SimpleNodeParser.from_defaults(chunk_size=512)
nodes = node_parser.get_nodes_from_documents(documents)
vector_index = VectorStoreIndex(nodes)
Now we can build a QueryEngine and start querying.
query_engine = vector_index.as_query_engine()

response_vector = query_engine.query("What did the author do growing up?")
You can check the response that you get from the query using response_vector.response
By default LlamaIndex retrieves two similar nodes or chunks. You can modify that in:
vector_index.as_query_engine(similarity_top_k=k).Finally, let’s check the text in each of these retrieved nodes.
# First retrieved node
response_vector.source_nodes[0].get_text()

# Second retrieved node
response_vector.source_nodes[1].get_text()
Remember that we are using Phoenix tracing to capture all the data we need to evaluate our RAG pipeline. You can view the traces in the phoenix application.
We can access the traces by directly pulling the spans from the Phoenix session:
spans_df = px.Client().get_spans_dataframe()

spans_df[["name", "span_kind", "attributes.input.value", "attributes.retrieval.documents"]].head()
Note that the traces have captured the documents that were retrieved by the query engine!
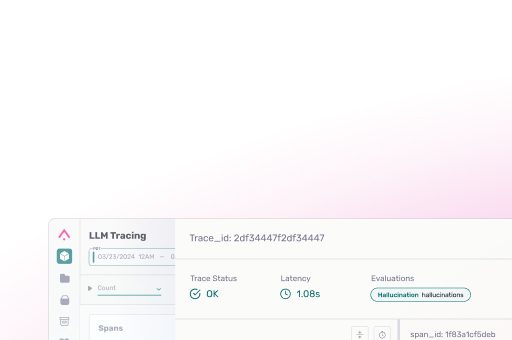
With your RAG pipeline instrumented and exporting traces to Phoenix, you can now view and explore the collected data within the Phoenix user interface. The Phoenix application provides a rich set of tools for visualizing, querying, and analyzing the traces, allowing you to gain deep insights into the performance and behavior of your LLM application.
What Can LLM Tracing Help You Do?
By implementing tracing, you can:
- Identify performance bottlenecks by examining the latency of individual operations.
- Understand the token usage of your LLM calls to optimize for cost and efficiency.
- Detect and investigate runtime exceptions, such as rate-limiting issues.
- Inspect the documents retrieved by your Retriever, including their scores and order.
- Examine the embedding text and models used in your application.
- Analyze the parameters and prompt templates used when invoking your LLMs.
- Understand the tools and functions your LLM has access to.
Additional Resources
Questions? Feel free to reach out in the Arize Slack community.
For an example on what tracing looks like in the Arize platform, see this demo:


