LLM Tracing and Observability
What is LLM App Tracing?
The rise of large language model (LLM) application development has enabled developers to move quickly in building applications powered by LLMs. The abstractions created by these frameworks can accelerate development, but also make it hard to debug an LLM app. This is where Arize Phoenix, a popular open-source library for visualizing datasets and troubleshooting LLM-powered applications comes into play.

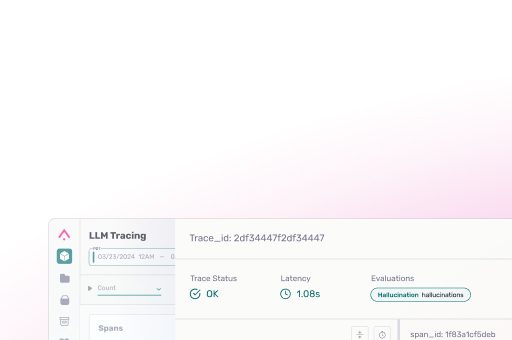
LLM trace observability attempts to make it easier to troubleshoot LLM frameworks and gain visibility into your LLM system. LLM orchestration frameworks like LlamaIndex, Microsoft’s Semantic Kernel, and LangChain offer flexible data frameworks to connect your own private data to LLMs. However, the callback sequence you will be looking at depends on how your LLM orchestration layer is organized. The figure above gives an example of the spans that are part of a single session from a LLM application. In order to capture the span data, tracing should be enabled.
While traces and spans are a familiar concept in infrastructure or network observability, they differ in many ways for LLM observability. For example, the concepts of evals, agents, embeddings and LLMs as span types is nowhere to be found in the infra world. In application performance monitoring (APM), a trace gives a detailed snapshot of a single end-to-end timing event in your distributed application, mostly used for production debugging and monitoring.
In LLM spans and traces, you have an incredible number of distributed system calls – all in a couple lines of code during application development. This is the first big difference between what APM and LLM spans are designed to do; designing a system for production monitoring and troubleshooting is very different from designing software to help in LLM app development.
Arize Phoenix is focused on the need for better development tools, close to the code, that can help with LLM span and trace debugging in development. Our goal is to make sure AI does what you want it to do, not just troubleshoot distributed system timing.
The second big difference between APM and LLM spans and traces observability is that overall system performance analysis, called LLM evals, needs to be applied to various spans. Phoenix is designed to easily collect data as your application is running, and provide simple code environments where evals can be applied easily between the application and code, such as to DataFrames. OpenInference provides a standard interface to access that span data whether using LlamaIndex or LangChain.
Phoenix Overview
The core challenge of troubleshooting LLM frameworks is that a couple lines of code can generate an immense number of distributed system calls.
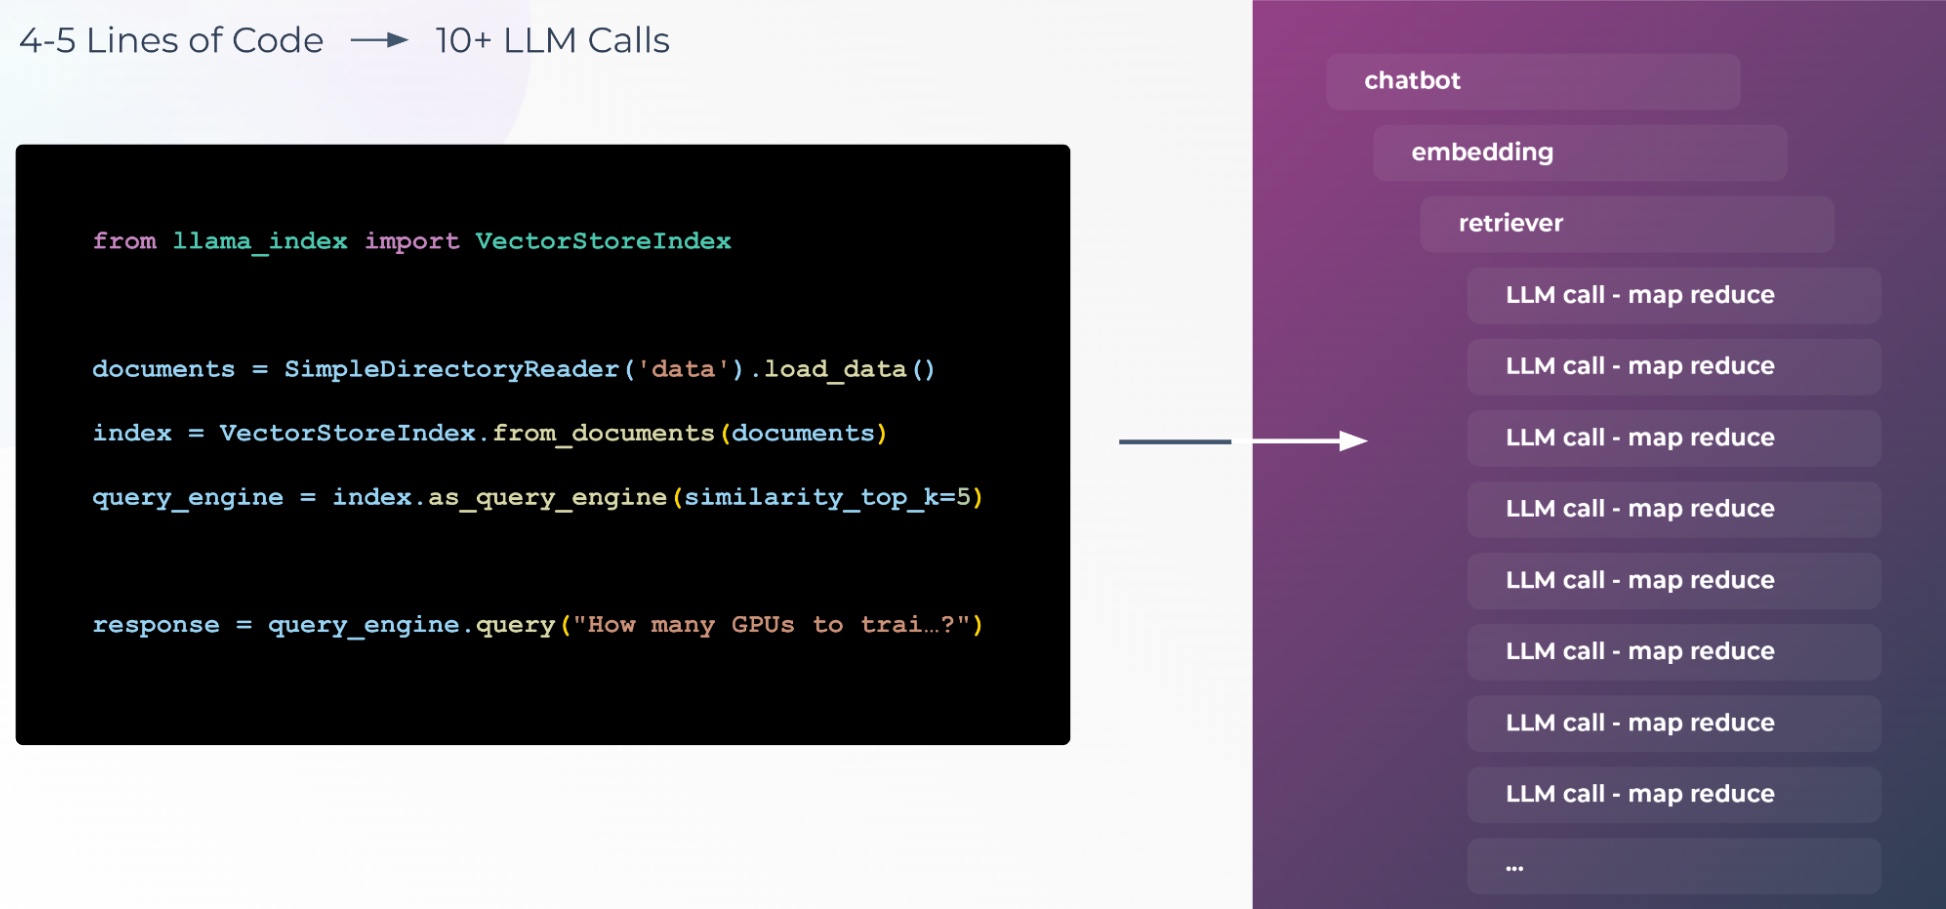
The above example shows how a single line of code can generate a large number of LLM calls. Making sense of a large number of distributed system calls is what Phoenix is designed to do.
Basic Debugging
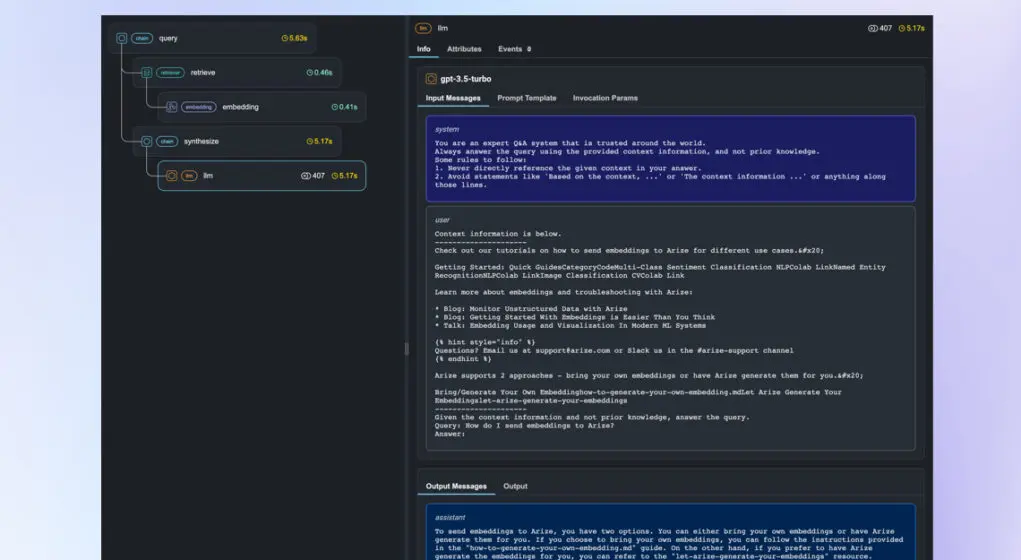
In order to do basic debugging, Phoenix can be enabled with a single line of code across many App Framework environments such as LlamaIndex and LangChain. The anatomy of an LLM span and trace might look like the picture below.
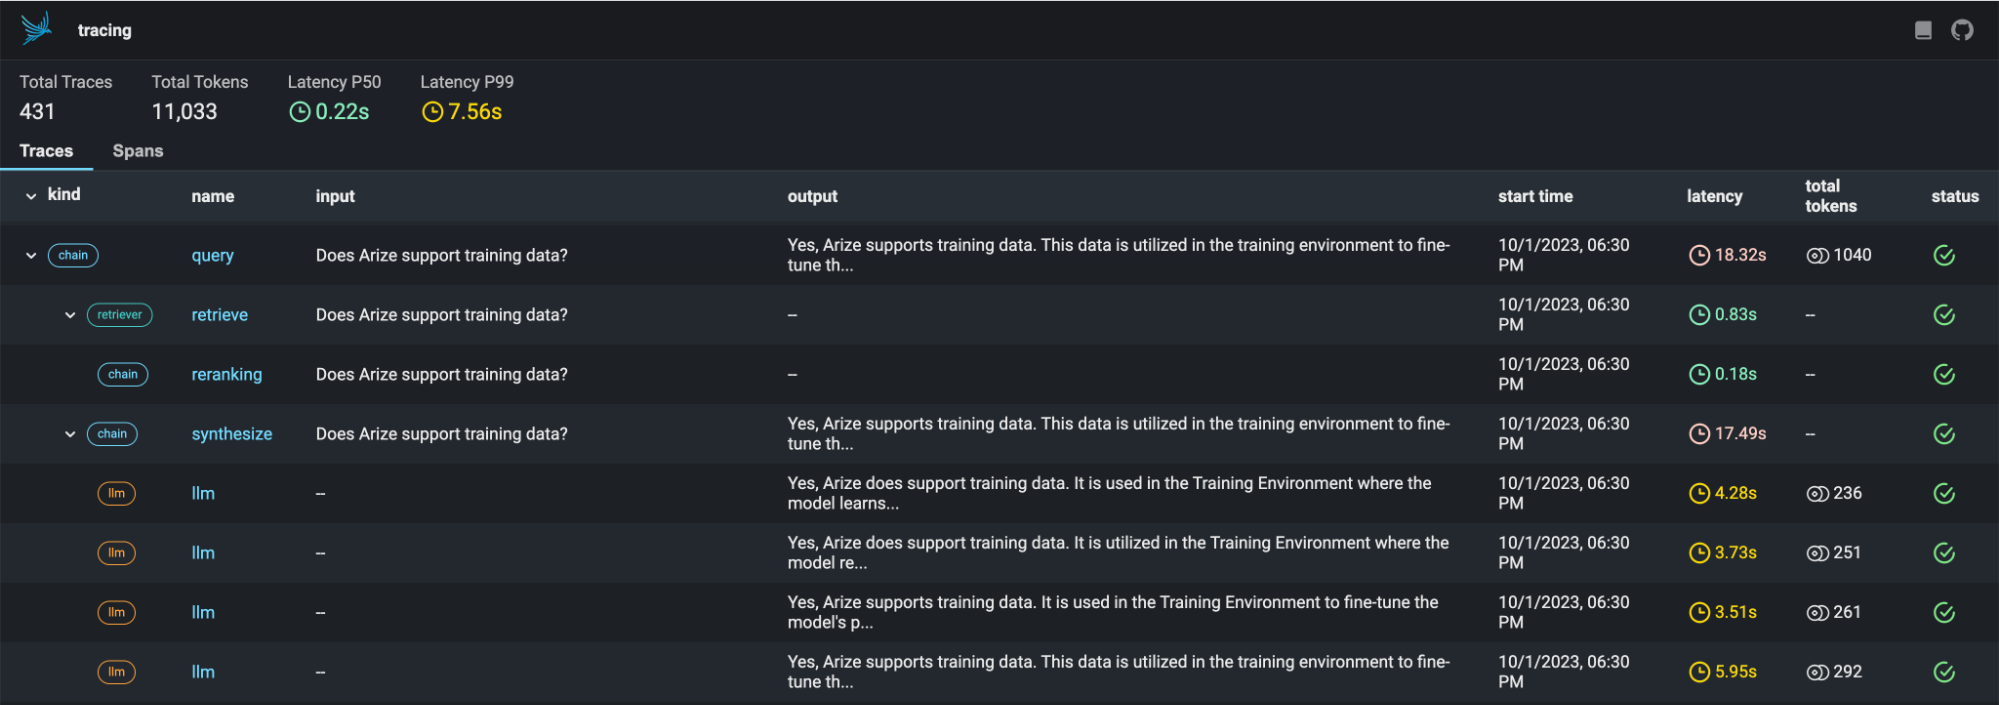
The above example shows timing, tracing and token usage for a single LlamaIndex retrieval step. As you have problems in the chain, you can trace down those problems easily by sorting spans by performance or eval metric.

Development problems or errors happen as teams run LLM frameworks. These errors can be surfaced immediately to the top trace.
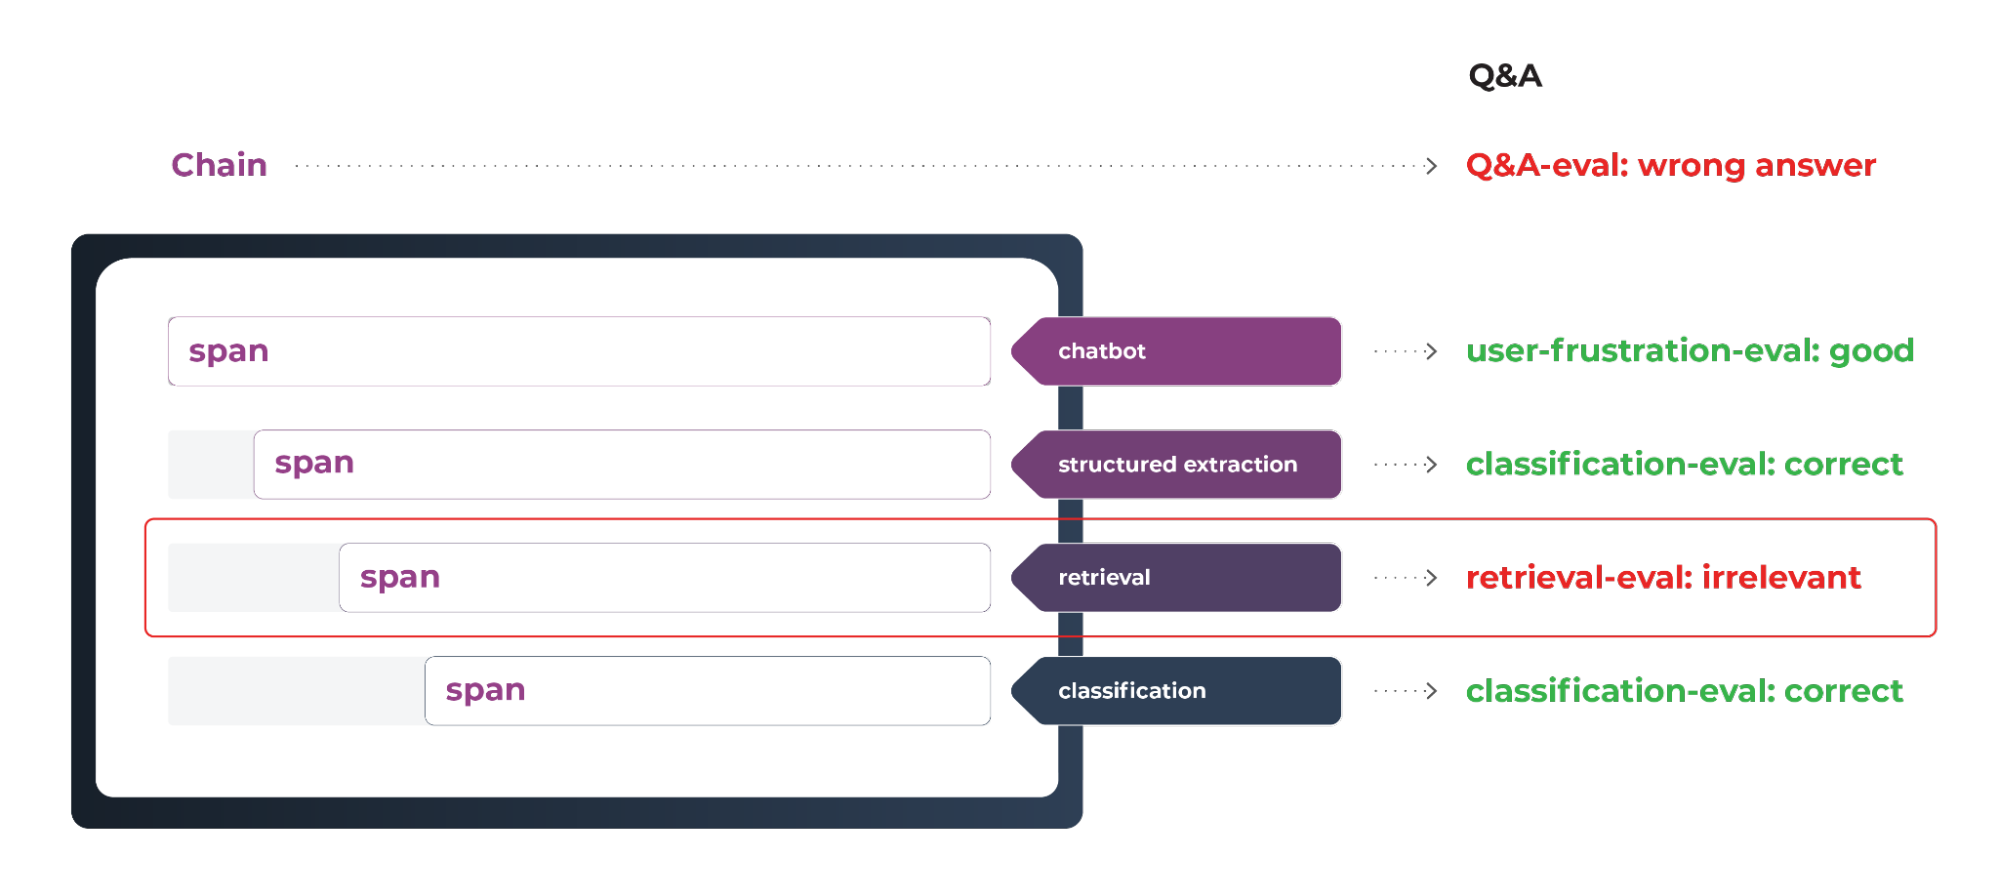
Evals can be applied at the span level for deeper performance analysis, helping to understand application performance beyond timing. Retrieval Evals are applied at the retrieval span analyzing each chunk, while Q&A is applied at a system level.
Phoenix Analyzing Retrieval
Understanding how retrieval (RAG) is working and how to improve is one of the harder challenges that teams have to face when developing LLM applications. Phoenix spans and traces allows teams to easily compare drastically different retrieval approaches and understand how each is working under the hood.
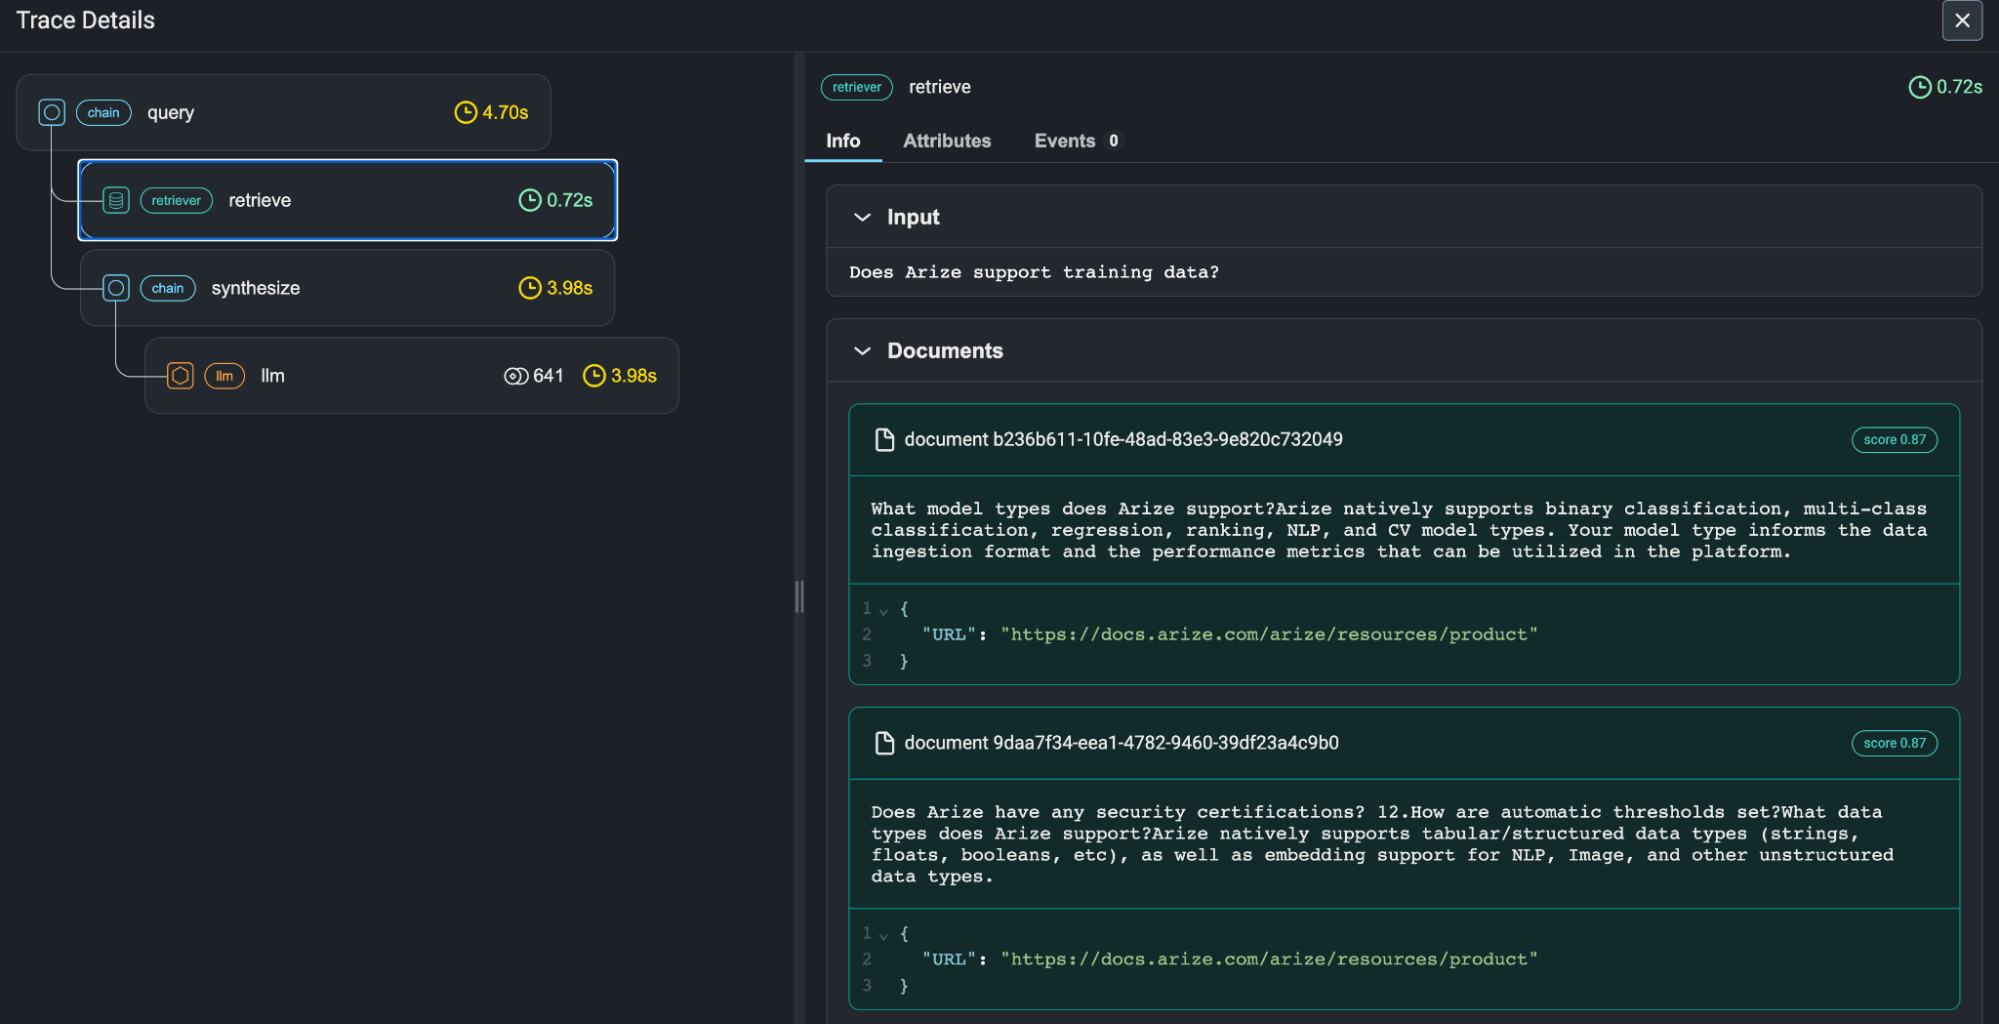
The image above shows a Phoenix retrieval span with the retrieved chunks and references for those chunks. One can quickly determine if problems are in the retrieved chunks, incorrect chunks and allows teams to debug problems down to the chunk retrieval steps.
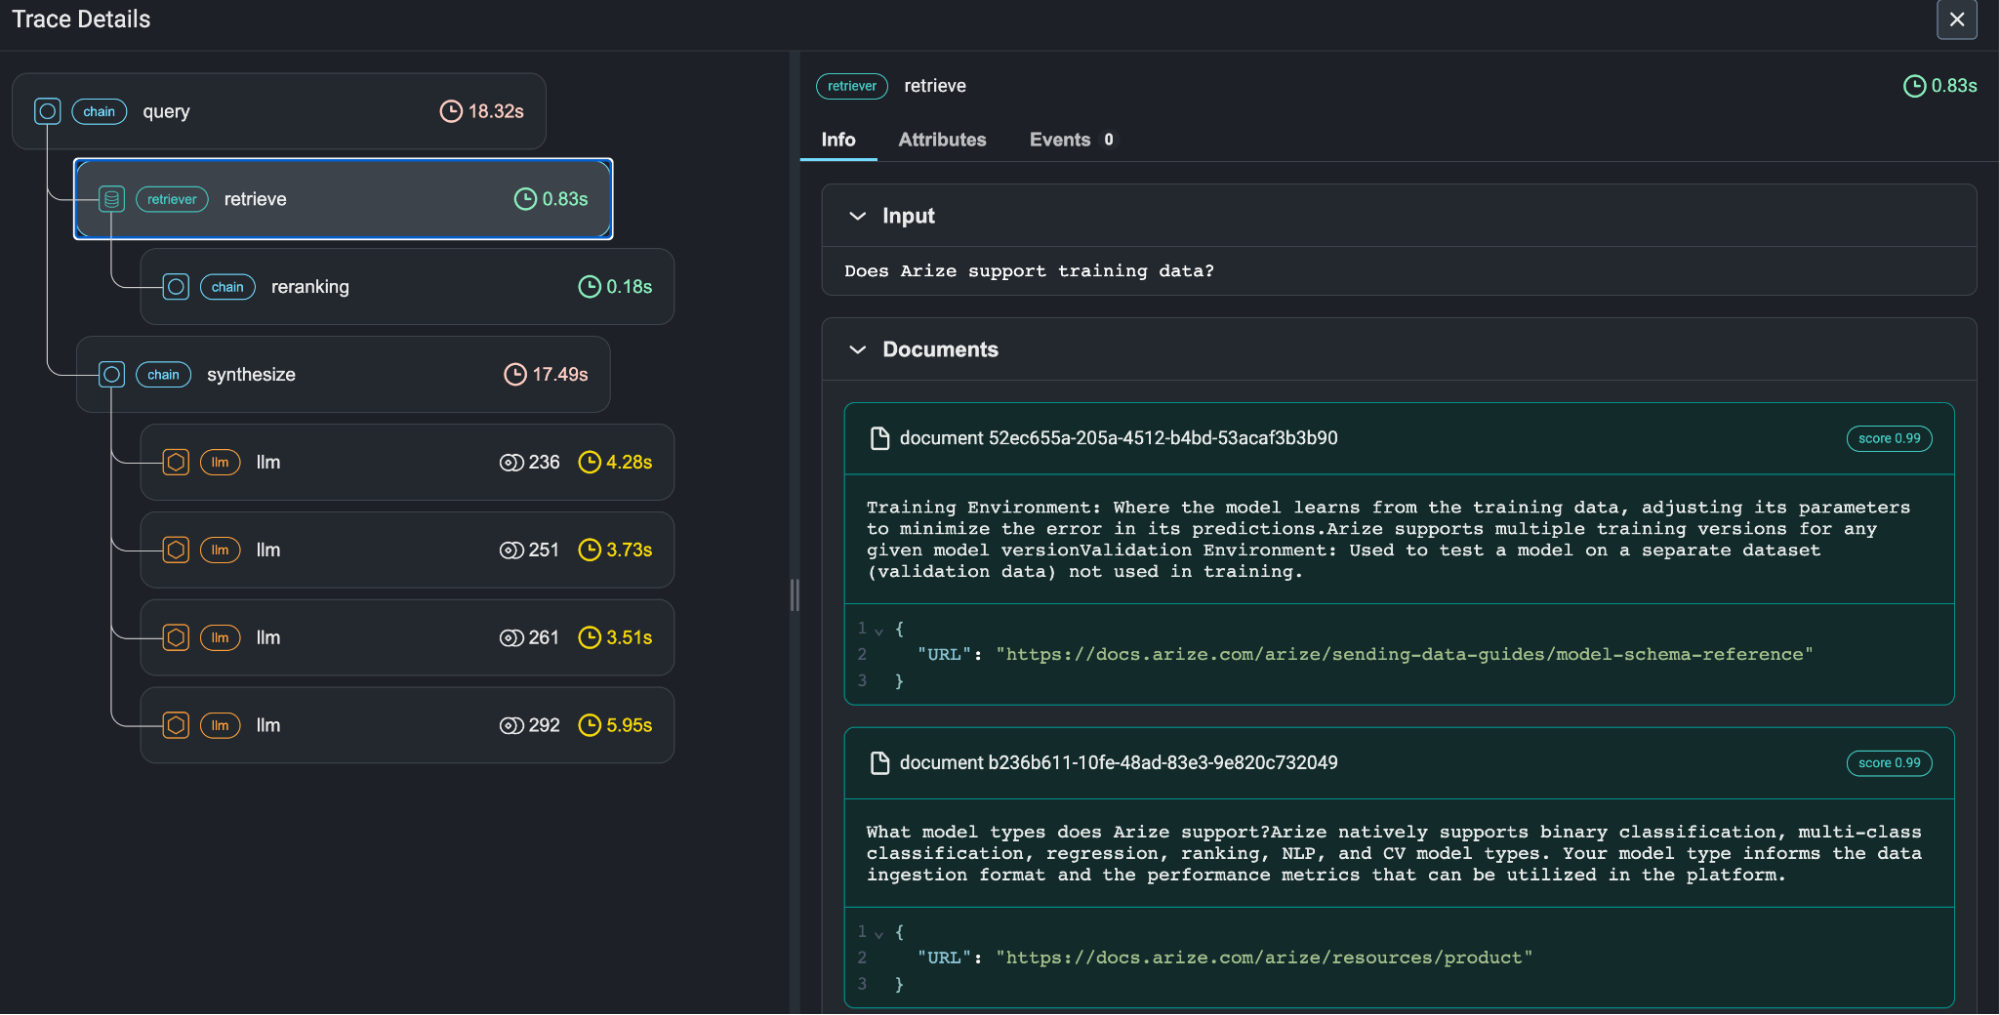
The above image shows the same query but using a re-ranking retrieval approach, teams can compare timing, chunk retrieval and overall performance of the same query across multiple different retrieval approaches.
💡 For those interested in exploring further, check out this workshop on retrieval benchmarking.
All the trace data in Phoenix is available as a local dataframe in the notebook so teams can either use the for analysis or run their own local evals.
trace_df = px.active_session().get_spans_dataframe('span_kind == "RETRIEVER"')
trace_df
trace_df["llm_assisted_relevance"] = run_relevance_eval(trace_df, model=model)The above calls allow teams to move easily between the trace data and notebook dataframes.
Prompt Template Debugging
In many cases troubleshooting and iterating on prompts is one of the biggest challenges in building LLM applications. Here, support for capturing the the prompt template used by LLM applications as part of the framework call helps.
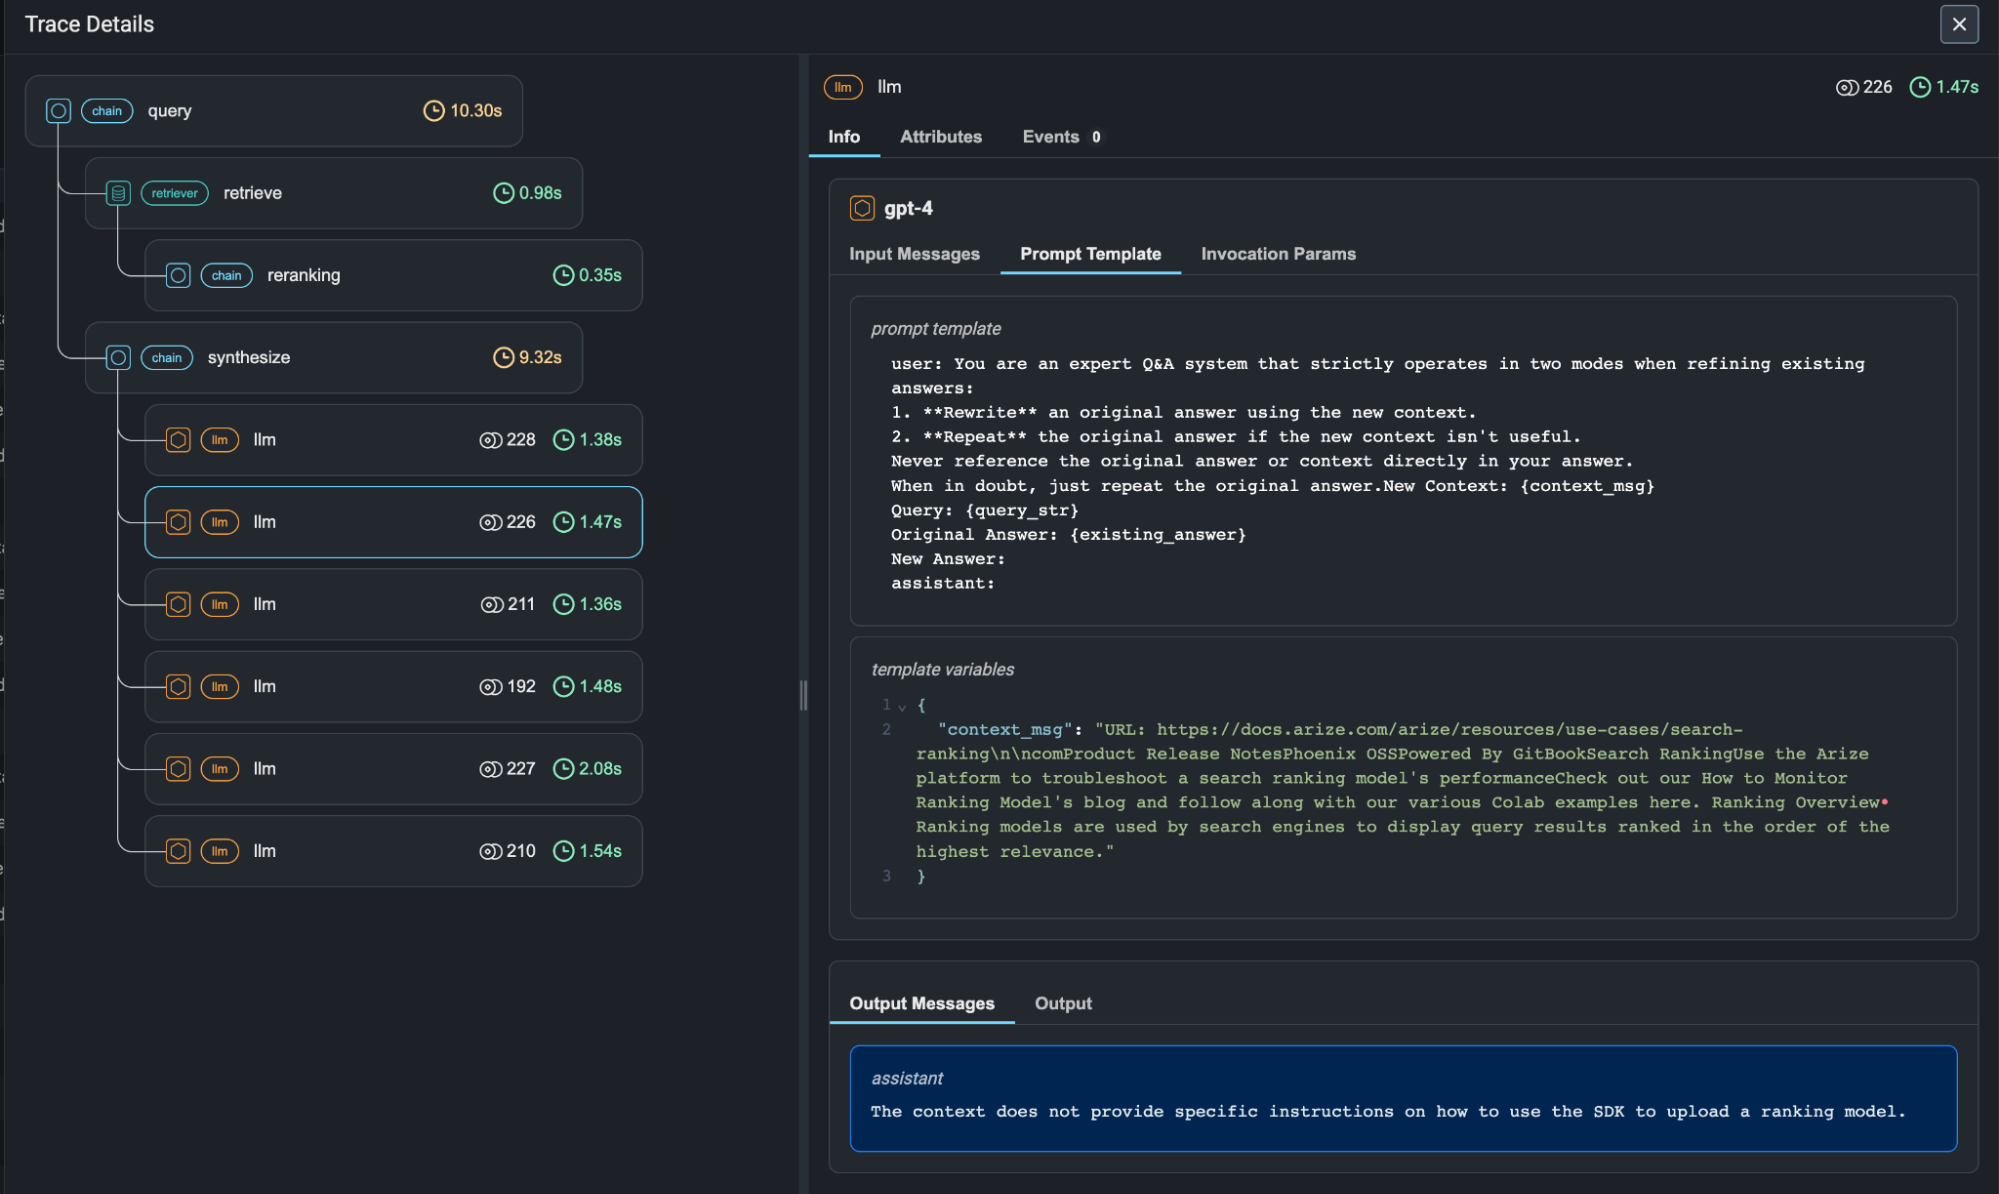
In each LLM call, Phoenix tracks the prompt template used as well as the final prompt generation. Teams can quickly track down template problems at the bottom of the stack.
Phoenix for Analyzing Agents
Agents comprise a much more complex set of system calls and required troubleshooting workflows.
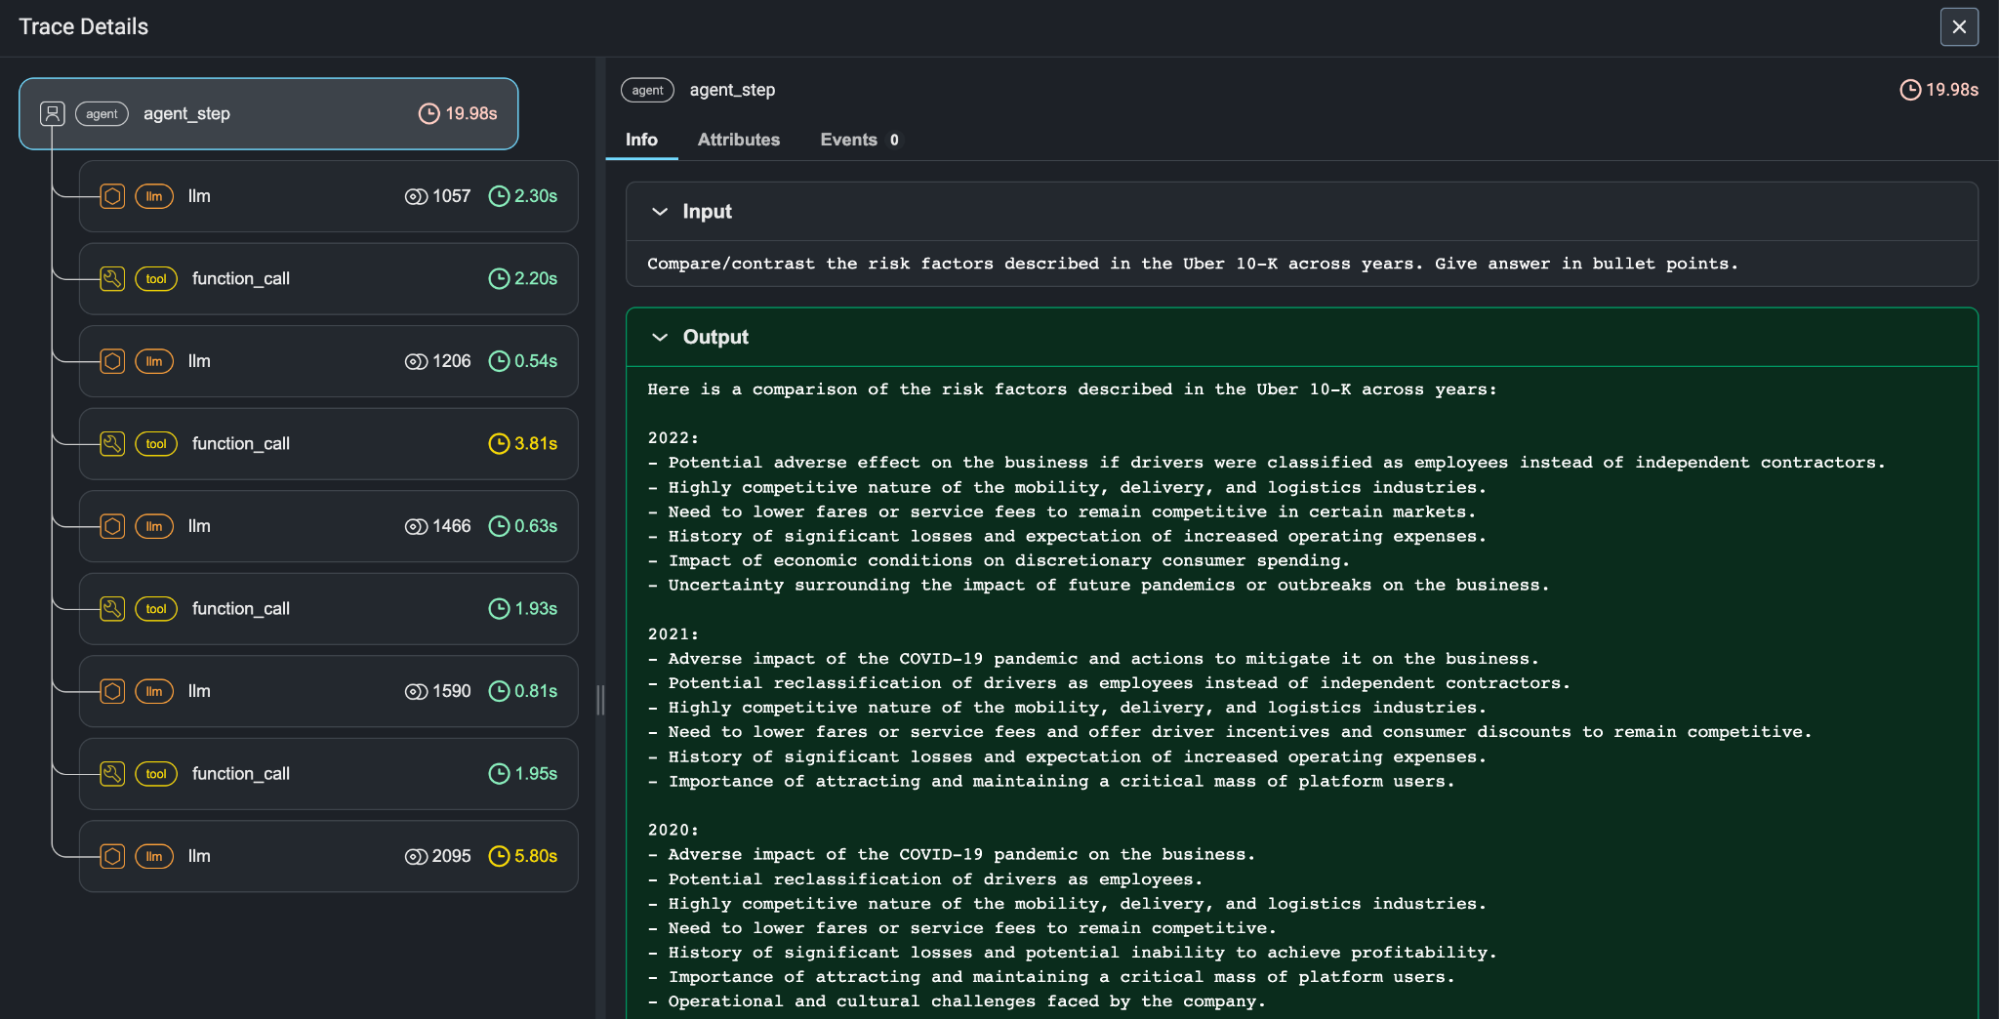
Phoenix supports the agent spans and tracking agent use cases, along with visualizing and supporting OpenAI functions and tools. Phoenix also allows teams to quickly visualize agent actions, function calls, and tool usage.
Spans
OpenInference Tracing offers a comprehensive view of the inner workings of an LLM application. By breaking down the process into spans and categorizing each span with a common interface across frameworks, it offers a clear picture of the operations and their interrelations, making troubleshooting and optimization easier and more effective.
Tracing takes advantage of two key components to instrument your code – tracer and trace exporters
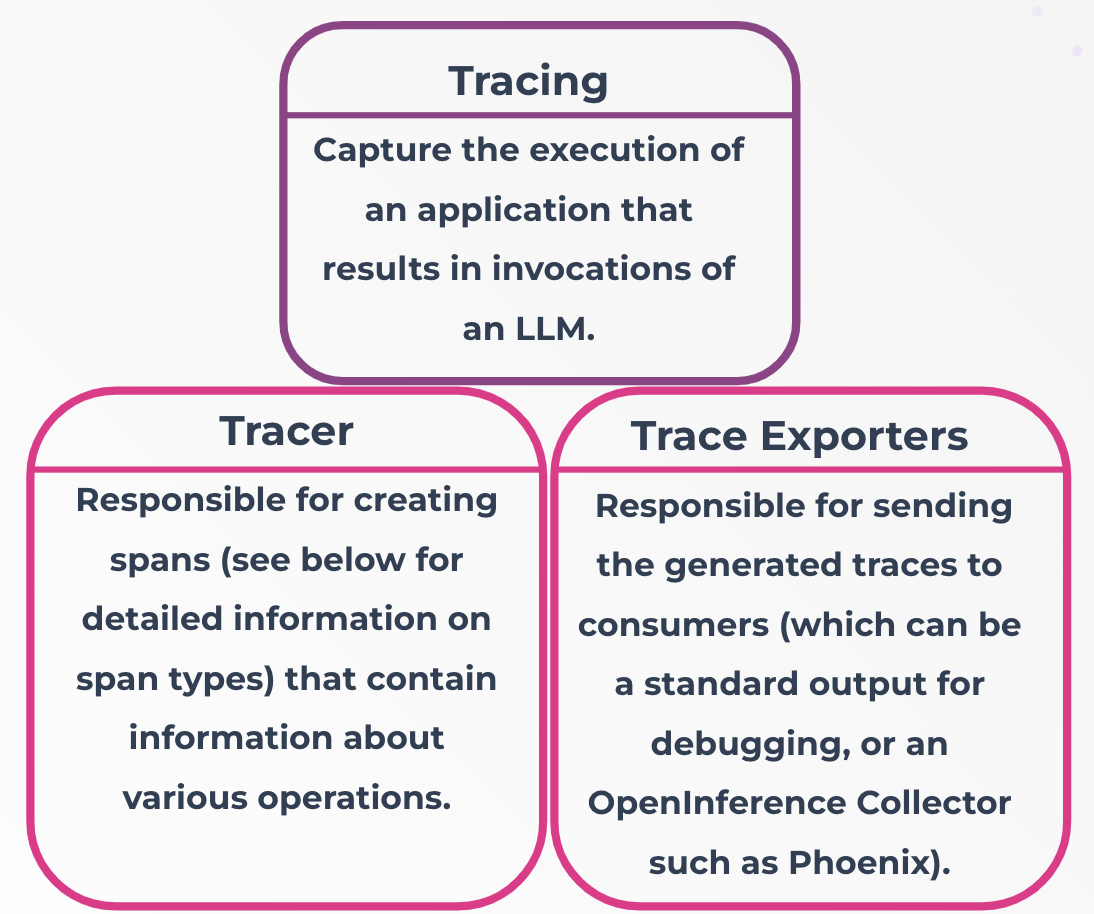
OpenInference spans are built on-top of a unit of work called a span. A span represents a span of time executing something – it has a duration and keeps track of how long the execution of a given LLM application step takes. Spans can store important information about the step in the form of attributes.
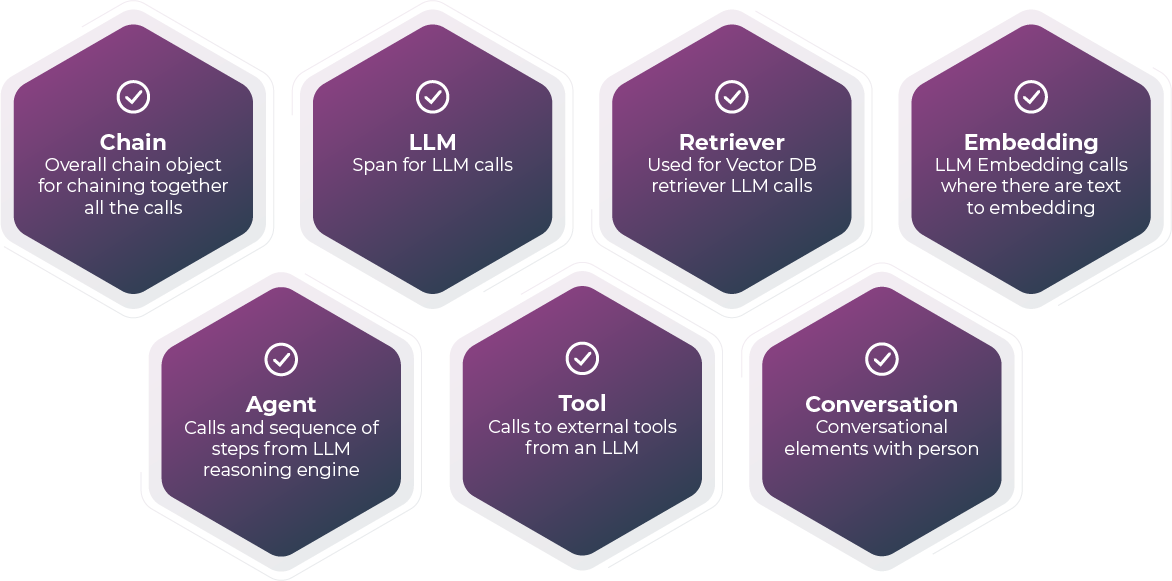
At a high level, a span has:
| Span Context | Contains the trace ID (representing the trace the span belongs to) and the span’s ID. |
| Attributes | Key-value pairs containing metadata to annotate a span. They provide insights about the operation being tracked. Semantic attributes offer standard naming conventions for common metadata. |
| Span Events | Structured log messages on a span, contains exceptions denoting a significant point in time during the span’s duration. |
| Span Status | Attached to a span to denote its outcome as Unset, Ok, or Error. |
| Span Kind | A category of execution, Span Kind refers to a specific category of named spans (like the seven above). For example, LLM spans mean an LLM is called, a Retriever span means documents were retrieved from a store or index. |
Arize Phoenix Applied to Known Callback Systems
Once you enable tracing for LLM applications like LangChain or LlamaIndex with Phoenix, the Phoenix platform will be available locally for troubleshooting.
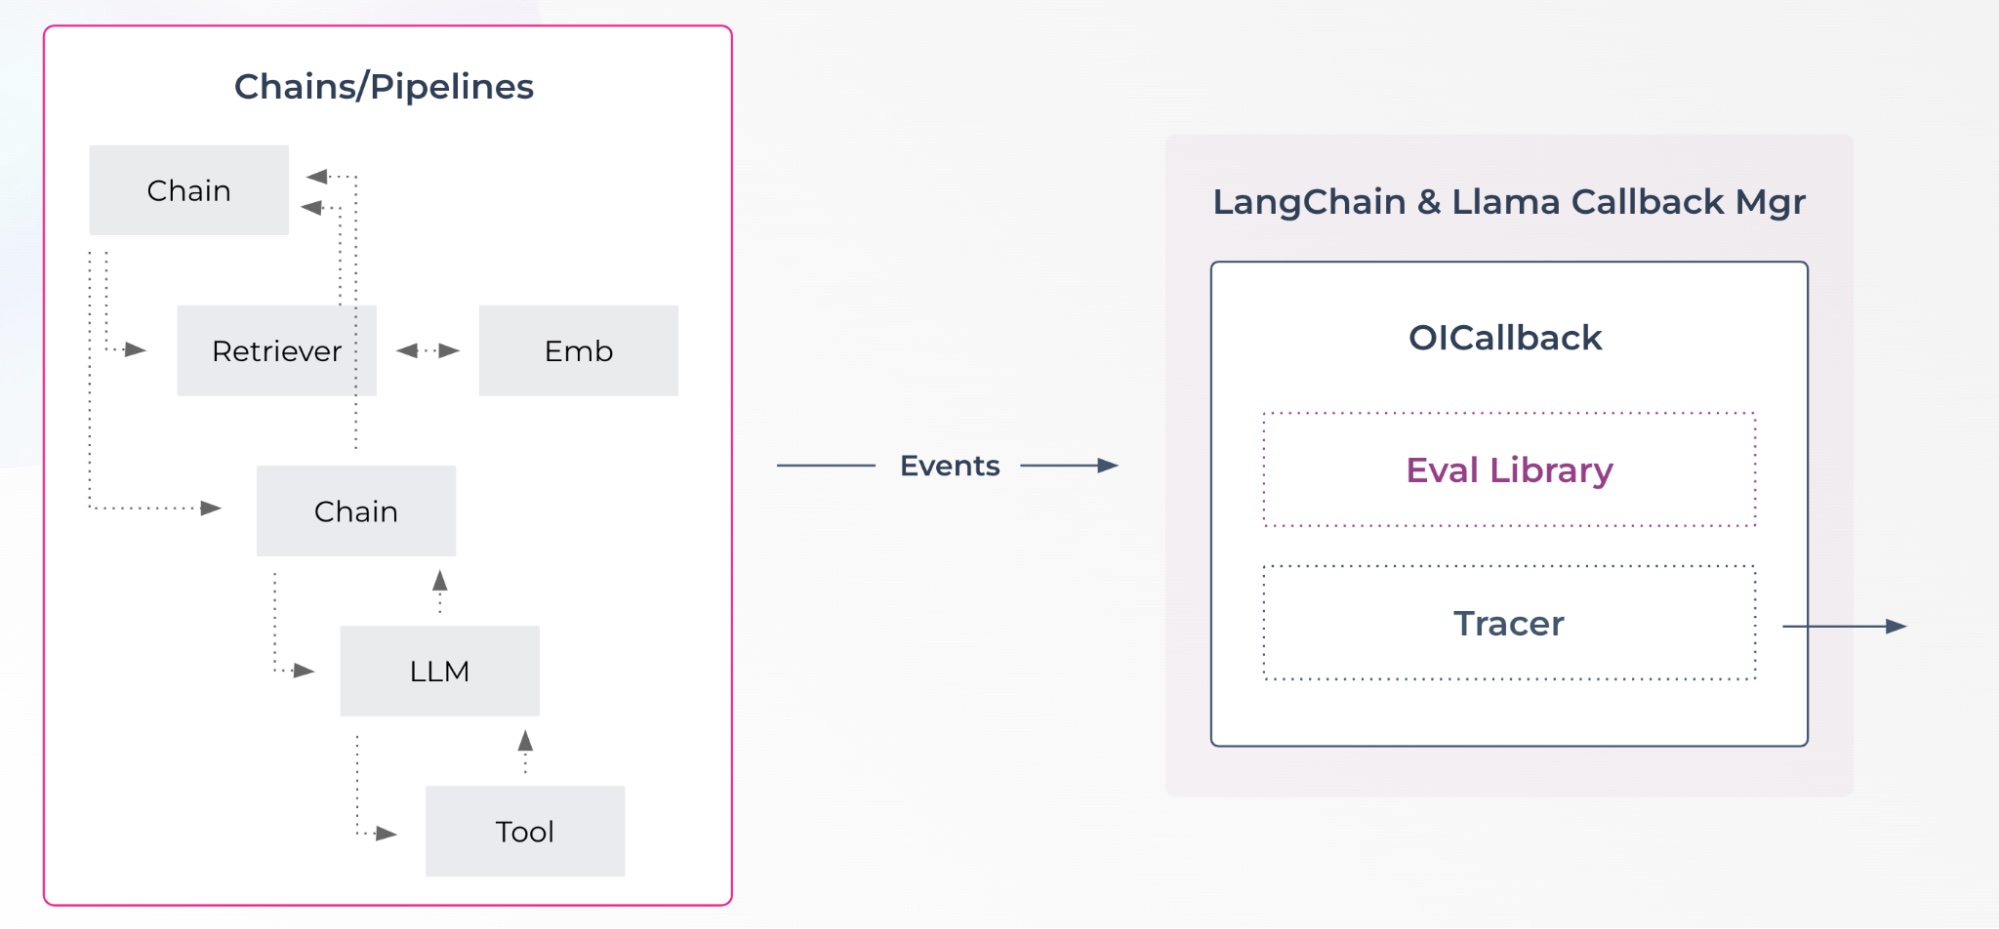
Phoenix leverages a callback system that runs in LlamaIndex or LangChain that collects span data for visualization in Phoenix.
import phoenix as px
px.launch_app()
Phoenix outputs a link to open the Phoenix app in your browser (as seen below) or in a notebook.

The above example shows the traces for a set of spans including chain, LLM and retriever span_kinds.
There are two ways to launch Phoenix tracing on spans:
- Streaming – Stream an active LangChain or LlamaIndex session into Phoenix continuously
- Span File / Trace Datasets – Open or extract files and datasets with OpenInference from and into Phoenix
OpenInference Tracing gives a detailed and holistic view of the operations happening within an LLM application. It offers a way to understand the “path” or journey a request takes from start to finish, helping in debugging, performance optimization, and ensuring the smooth flow of operations.
Phoenix Traces
Phoenix can be used to troubleshoot traces of execution. With traces you can:
- Application Latency – highlighting slow invocations of LLMs, Retrievers, etc.
- Token Usage – Displays the breakdown of token usage with LLMs to surface up your most expensive LLM calls
- Runtime Exceptions – Critical runtime exceptions such as rate-limiting are captured as exception events.
- Retrieved Documents – view all the documents retrieved during a retriever call and the score and order in which they were returned
- Embeddings – view the embedding text used for retrieval and the underlying embedding model
- LLM Parameters – view the parameters used when calling out to an LLM to debug things like temperature and the system prompts
- Prompt Templates – Figure out what prompt template is used during the prompting step and what variables were used.
- Tool Descriptions – view the description and function signature of the tools your LLM has been given access to
- LLM Function Calls – if using OpenAI or other models with function calls, you can view the function selection and function messages in the input messages to the LLM.
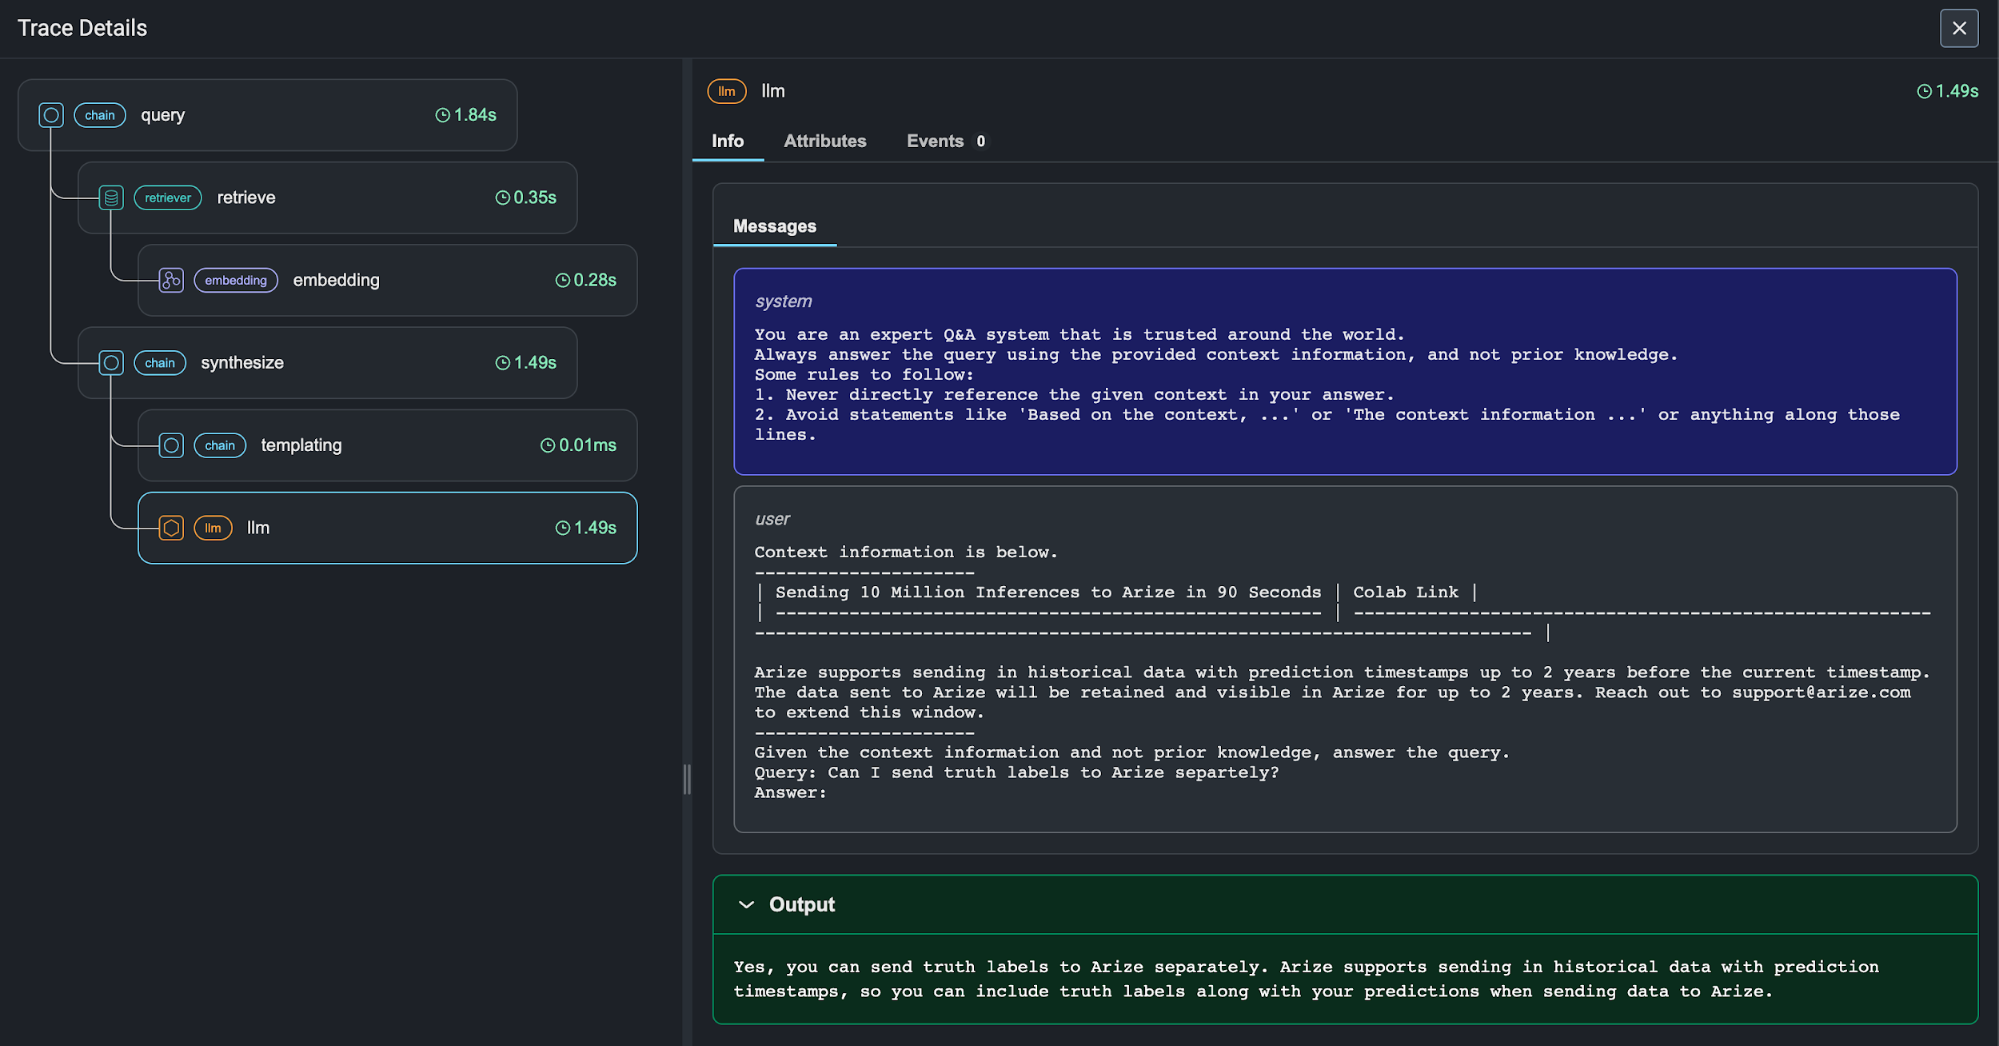
The above trace shows a retrieval run by LlamaIndex and the chain/retriever/embedding/LLM spans that comprise that trace. The timing can be debugged by sorting the spans or going to a particular LLM span. This can be used to track down evaluation or performance problems during a particular step.
Tracing and Evaluating a LlamaIndex Application
LlamaIndex provides high-level APIs that enable users to build powerful applications in a few lines of code. However, it can be challenging to understand what is going on under the hood and to pinpoint the cause of issues. Phoenix makes your LLM applications observable by visualizing the underlying structure of each call to your query engine and surfacing problematic “spans” of execution based on latency, token count, or other evaluation metrics.
In this tutorial, you will:
- Build a simple query engine using LlamaIndex that uses retrieval-augmented generation to answer questions over the Arize documentation,
- Record trace data in OpenInference format,
- Inspect the traces and spans of your application to identify sources of latency and cost,
- Export your trace data as a pandas dataframe and run an LLM-assisted evaluation to measure the Precision@k of your retrieval step.
Note: This notebook requires an OpenAI API key.
Getting Started and Recap
Anyone can get started with Arize-Phoenix in a few minutes. To recap, Phoenix’s support for LLM traces and spans gives developers visibility at a span-level to see exactly where an app breaks, with tools to analyze each step rather than just the end-result.
This functionality is particularly useful for early app developers because it doesn’t require them to send data to a SaaS platform to perform LLM evaluation and troubleshooting — instead, the open-source solution provides a mechanism for pre-deployment LLM observability directly from their local machine. Phoenix supports all common spans and has a native integration into LlamaIndex and LangChain. Phoenix also features a new LLM evals library that is built for accurate and rapid LLM-assisted evaluations to make the use of the evaluation LLM easy to implement. Applying data science rigor to the testing of model and template combinations, Phoenix offers proven LLM evals for common use cases and needs around retrieval (RAG) relevance, reducing hallucinations, question-and-answer on retrieved data, toxicity, code generation, summarization, and classification.
“As LLM-powered applications increase in sophistication and new use cases emerge, deeper capabilities around LLM observability are needed to help debug and troubleshoot. We’re pleased to see this open-source solution from Arize, along with a one-click integration to LlamaIndex, and recommend any AI engineers or developers building with LlamaIndex check it out,” says Jerry Liu, CEO and Co-Founder of LlamaIndex.
The Phoenix LLM evals library is optimized to run evaluations quickly with support for the notebook, Python pipeline, and app frameworks such as LangChain and LlamaIndex.
