


Troubleshooting Generative AI Models in Production
As AI teams navigate the best practices for implementing large language models (LLM) in production, the priorities of being able to track, troubleshoot and resolve performance issues right away becomes clear. Time to value is a key component for successful LLM observability, but being able to provide transparency into LLM orchestration frameworks is incredibly complex. As the field of generative AI grows, so does the need for evaluating LLM-powered systems holistically in order to maintain them in production. Throughout this post, we cover best practices for tracing calls in a given LLM application by providing the terminology, skills and knowledge needed to dissect various span kinds.
LLM Orchestration Frameworks: What Are They and Why Are They Needed?
LLM observability is the idea that you can gain visibility into your LLMOps system. LLM orchestration frameworks like LlamaIndex, Microsoft’s Semantic Kernel and LangChain offer flexible data frameworks to connect your own private data to LLMs (like OpenAI’s GPT-4 and Meta’s LLama 2) in order to leverage the wave of the latest generative AI advancements. In the emerging LLM toolchain (see below), these frameworks are in the center of the LLMOps system between various LLM application tools.

LLM orchestration frameworks are trying to enable developers with the necessary tools to build LLM applications and LLM observability is designed to manage and maintain these applications in production. This orchestration process includes many different components including: programmatic querying, retrieving contextual data from a vector database, and maintaining memory across LLM and API calls. Whether you are using a callback system from a programming framework for LLMs (like LangChain or LlamaIndex) or creating a bespoke system, LLM applications require observability to make sure each component is performing optimally in production.
Tracing LLM Applications: Who Should Be Tackling This Within AI Teams?
Currently there are a variety of industries trying to implement LLMs into production, but who within an AI organization is best equipped for this challenge? LLMOps Engineer is not currently a title we see being advertised, but LLM-powered systems are being built for a variety of use cases across industries, so who are the LLM developers? Today this is overwhelmingly the skilled software engineers who understand highly scalable and low-latency systems.
Traditionally data scientist, AI researcher, and machine learning engineer have been the most common roles for those developing AI algorithms and ML evaluation tools. However, we have seen a recent shift that is putting the power of AI in the hands of developers with strong software capabilities. With advanced open source libraries and models, developers have been able to integrate software together to create new AI applications without the need of data science and ML understanding. Data engineers, software engineers and other developers will have an advantage in LLM observability with their familiarity not only in the terminology, but also troubleshooting API callbacks, when compared to data scientists and ML engineers. However, since the fields of MLOps and LLMOps are still being created, tested and iterated upon, the time is right for anyone interested in generative AI to start learning about and implementing LLM systems now!
LLM Observability: Terminology and Approaches
For software engineers that work with distributed systems, terms like “spans,” “traces,” and “calls” are well known. While there are parallels between the worlds of network observability, distributed systems, and LLM observability there are also nuances with generative AI terms. Since LLM observability isn’t just about tracking API calls, but about evaluating the LLM’s performance on specific tasks, there are a variety of span kinds and attributes that can be filtered on, in order to troubleshoot a LLMs’ performance.
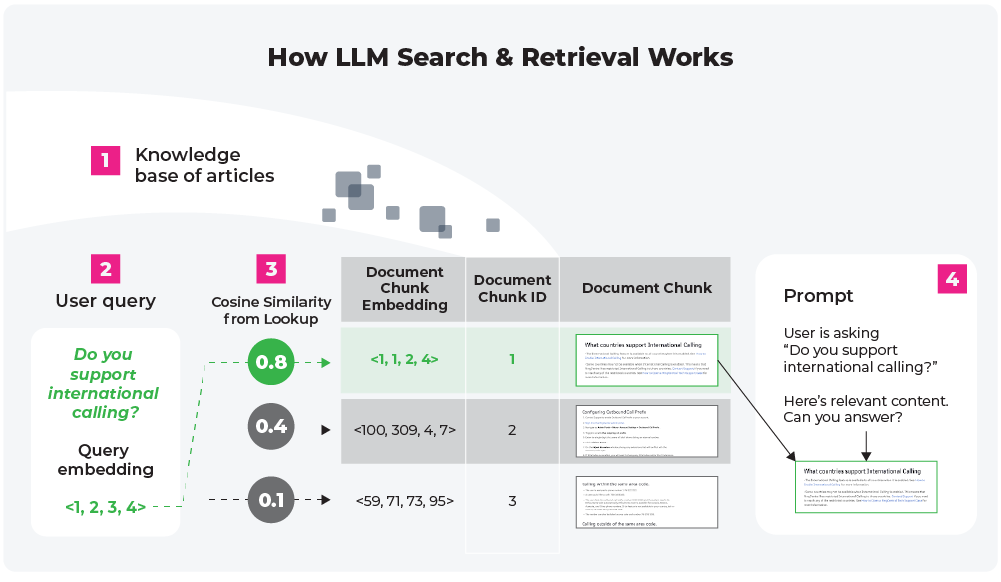
Before walking through these workflows in detail, let’s give the scenario that you are a Software Engineer at an e-commerce company which recently pushed an LLM-powered chatbot into production. Your chatbot, which is used to interact with customers who have purchased from your company’s website, uses a search and retrieval system to create responses for the customer (see Figure 1 below).
Note that the callback sequence you will be looking at depends on how your LLM orchestration layer is organized, whether you are using a LLM framework (like LlamaIndex and LangChain) or you create a bespoke framework. For the following callback tracing workflows, let’s use the LLM orchestration framework provided by LlamaIndex that accepts any input prompt over your data and returns a knowledge-augmented response. Please refer to Table 1 below for related terminology in the following workflows.

Definition of LLM Observability Terms for Reference
| Term | LLM Observability Definition* |
| Traces | Traces represent a single invocation of an LLM application. For example, when a chain is run or a query engine is queried, that is a trace. Another way to think of traces is as a sequence of spans tied together by a trace ID |
| Spans | Spans are units of execution that have inputs and outputs that a builder of an LLM application may care to evaluate. There are different kinds of spans, including chain spans, LLM spans, and embedding spans, that are differentiated by various kinds of attributes. For example LLM span type: Attributes = Temperature, Provider, Max Tokens, … |
| Tools | Tool as the defining feature of an agent, an arbitrary function (e.g., a calculator, a piece of code to make an API call, a tool to query a SQL database) that an LLM can choose to execute or not based on the input from a user or the state of an application. |
| Parent-Child Relationships Between Spans | Every trace has a hierarchical structure. The top span, which is the entry point, has no parent. However, as you delve deeper into the system’s operations, you’ll find child spans that are initiated by their parent spans. |
| Conversations | Conversations are a series of traces and spans tied together by a Conversation ID. These occur across traces without any parallel operations and contain a single back and forth conversation between the LLM and a given user. |
| * 💡Note: While traces and spans are a familiar concept in intra/network observability, they differ in many ways for LLM observability. For example, the concepts of evals, agents, embeddings and LLMs as span types is nowhere to be found in the infra world. In APM (application performance monitoring) a transaction trace gives a detailed snapshot of a single transaction in your application, this is similar to a run in a LLM application system. While you will see similar timing information and similar annotations on spans (marking them with key-value pair attributes to use for visualization) the semantic conventions that are being established for the types of spans, what attributes should be present on these types, and the appropriate evals for them are all new for LLM tracing. |
When you execute a LLM run, the process of interacting with your selected LLM is documented in a callback system by a trace. In this trace a span can refer to any unit of execution, you may annotate a span with a specific name (agent, LLM, tool, embedding) or a general term like a chain (which can refer to any process that doesn’t have its own span kind).
Now let’s go through two troubleshooting workflows that you can use to break down each call you are making to your LLM – these will be the top-down and bottom-up LLM workflows.

Option 1: Top-Down LLM Workflows

A top-down approach can be thought of starting with the big picture of the LLM use case and then getting into specifics of the execution if the performance is not satisfactory. For example with your e-commerce LLM powered chatbot into production. Your chatbot is interacting with customers in a series of back and forth conversations. Some customers might have only one question one time, while other customers may have a series of conversations that stretch over months. Either way, every time a question is asked, your LLM system is queried to produce a response for your user and each run produces an individual trace (with a series of spans).
In order to troubleshoot performance top down you can take all unsatisfactory conversations (labeled as such due to user feedback or a separate evaluation system), then rank them from worst to best performance, and filter down into the individual traces, and then spans to see where the major problem is hidden.
For example, let’s say on Wednesday you get an alert that your overall chatbot performance is operating at 70% satisfactory (which is lower than the accepted 80%) and this chatbot was operating at 85% last week. Clearly, there are some unhappy conversations. Now, to troubleshoot these underperforming conversations you first filter down on the worst performing conversations and then filter on the traces and span types that are underperforming to see if there is an issue in the execution chain. As it turns out, there is an irrelevant output from a span type (see below) on every one of these underperforming conversations, most likely due to missing relevant content. You remembered your team launched a website update on Tuesday and saw that the outputs were unsatisfactory because they were using information about the old website. This issue can be ultimately resolved by adding context to your LLM for how to add items to cart via the updated website.

Option 2: Bottom-Up LLM Workflows

The bottom-up workflow can also be thought of as a discovery workflow where you are at the local level to filter on individual spans. In the same way you might think about metadata or tags, you can filter by specific spans to troubleshoot performance in your LLM use-cases. For example you can filter on embedding or LLM spans to see performance, latency and token account appear as expected. So if you are curious on how your outputs, prompts and performances are for your agents, LLMs, vector databases and more, use a bottom-up approach to evaluate individual components of your LLM system. This workflow can also link back any underperforming span type to their corresponding traces and conversations.
LLM Span Types and Their Functions

Let’s explore a specific trace for a search and retrieval use case that will look and evaluate the chain, LLM, tool, and retriever spans individually within a run.

Chain
This is the most general kind of span, it has an input and an output and chains together all the calls. A chain can query, synthesize and provide templating. For example: If I ask your company’s chatbot “Can I copy a dashboard?” then the chain (query) might:
INPUT: Can I copy a dashboard
OUTPUT: Yes, you can copy a dashboard
Note that the output is achieved after the embedding and retrieve span, as seen from the trace details.
Embedding
For embedding queries/questions — like embeddings that correspond to relevant documents from a vector store, for example.
{
 "embedding": {
		"model_name": "text-embedding-ada-002",
		"embeddings": [
		 {
		  "embedding.vector": [
		  -0.018075328320254816
		  -0.002687335712835192
		  -0.010201605968177319
		],
		"embedding.text": "Can I copy a dashboard?"
	       }
 	      ]
	     },
"__computed__": {
 "latency_ms": 187.385
}
Retriever
Responsible for retrieving relevant data. For example: retrieving all the relevant documents that were selected using their corresponding embeddings from the vector store.
"input": {
  "value": "Can I copy a dashboard?"
},
"retrieval": {
  "documents": [
    {
	  "document.id": "873ef3a3-6938-4734-b10b-d29be152579"
	  "document.score": "0.8101961612701416"
	  "document.content": "\nTemplates are designed as starting points for dashboard and model analysis. Once a dashboard is created from a template, it can be edited and customized as desired. \n\n!\n\n"
LLM
Represents the LLM’s operations. Remember, we are using a search and retrieval workflow for our chatbot as seen from the embedding and retrieval steps. Now that the relevant documents have been surfaced the LLM is called to synthesize the information from the documents to produce the correct answer for the input query.
Attributes of the LLM span like prompts and LLM model version (“model_name”: “gpt-3.5-turbo”) are defined, the LLM will use that information to generate an output from the provided background documentation.
For example:
"output": {
    "value": "assistant: Yes, you can copy a dashboard."
  },
  "__computed__": {
    "latency_ms": 1127.944,
    "cumulative_token_count_total": 224,
}
Note that in addition to the provided output, key performance metrics like token count and latency were also returned.
Additional Filtering and Alerting
Now that we have seen workflows for exploring conversations, traces and spans, let’s talk about the methods of troubleshooting these workflows with filtering and monitors. If you are familiar with ML observability, you would likely think about setting monitors with an upper bound on latency and token count of your LLM system (so you are able to surface abnormally high token counts for each trace, and poor latency times for traces and spans). This is a good starting point, but only the tip of the iceberg in terms of how deep you can start to understand your LLM system.
Remember you can even create your own spans and a bespoke or modified LLM orchestration layer. You can add span kinds that correspond to specific LLMs, conversations, vector databases, and evaluations. At which point you can filter on customer IDs, conversation ID, performance metrics, user feedback and more.
Inputs/Outputs and Attributes
If you are interested in testing out for yourself what attributes span types have, and why are attributes useful, try out our OpenInference standard that the Arize team is currently working on.

OpenInference data is designed to be stored in a data lake or data warehouse and provides a standardized format that simplifies the analysis of inference data. OpenInference provides specification that encompass two data models:
-
- OpenInference, a specification for capturing and storing AI model inferences.
- Model Types / Use-Cases: Natural Language Processing, Tabular, Ranking, Computer Vision and Large Language Models.
-
-
- OpenInference Tracing is a specification for capturing and storing LLM application executions.
- It’s designed to provide insight into the invocation of LLMs and the surrounding application context such as retrieval from vector stores and the usage of external tools such as search engines or APIs.
-
Inferences are designed to capture inference logs from a variety of model types and use-cases whereas traces are designed to capture the execution of an application that results in invocations of an LLM.
Final Thoughts
As the landscape of generative AI expands, understanding the intricacies of spans, traces, and their roles in observability will be paramount for developers and data scientists alike. Whether you’re using established frameworks like LlamaIndex or LangChain or building bespoke systems, having a clear understanding of LLM observability will be crucial for optimizing performance and ensuring efficient operations. With OSS tools like Arize’s Phoenix for preprocessing LLM systems and the Arize Platform for maintaining LLMs in production, teams can now develop LLM applications while gaining insights into how LLM workflows operate under the hood.
For more information on LLM observability, join the Arize Community slack group.