
In 1969, humans first stepped on the moon thanks to a lot of clever engineering and 150,000 lines of code. Among other things, this code enabled engineers at mission control to have the full view of the mission and make near-real-time decisions. The amount of code was so small that engineers were able to thoroughly debug the software, and its performance was nearly flawless. Today’s search engines, on the other hand, execute billions of lines of code, making it much more likely that engineers will make mistakes or extraordinary circumstances will crop up somewhere in the system. On top of that, both data and machine learning models (code that computers essentially write for themselves) come with their own challenges. In short, it is nearly impossible to guarantee that a modern software system will always perform as you expect. That’s why observability is crucial on all production systems.
Luckily, we can automate observability of complex software systems so you can have timely and actionable information about your software, just like NASA engineers had about the Apollo missions.
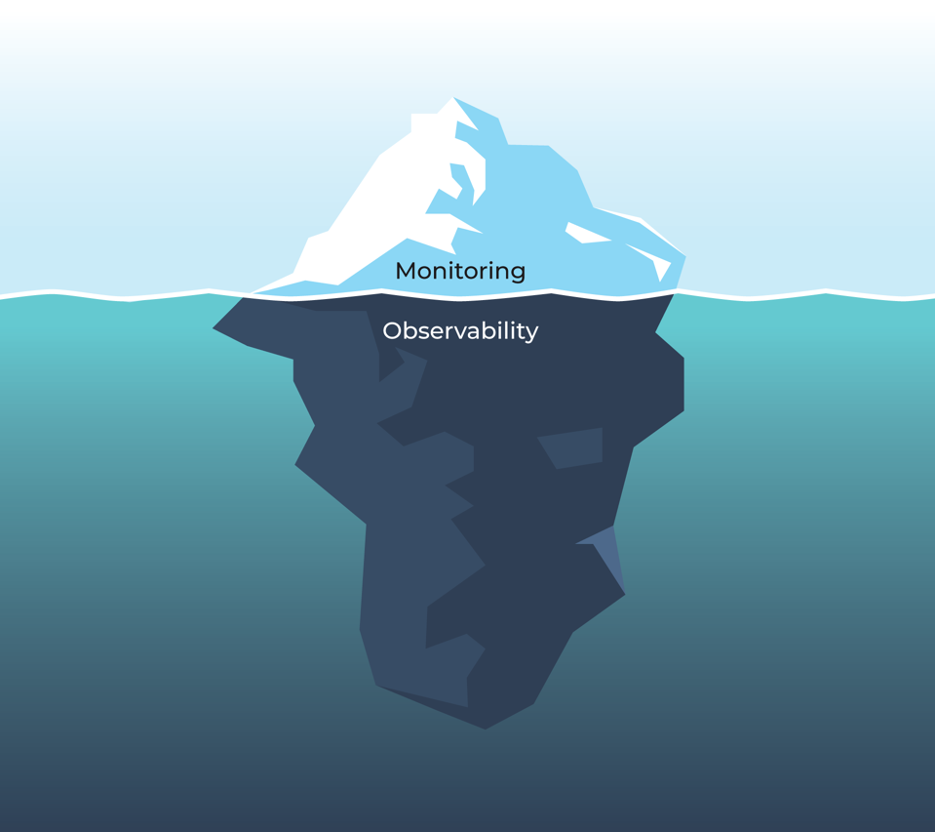
What Is Observability?
Observability is the practice of quickly finding out what the problem is and getting to the root cause. Most modern software systems include infrastructure, data, and machine learning models. All three need observability, but each has different requirements, workflows, and personas. Let’s take a closer look!
What are the Types of Observability?
Observability is of course not unique to technical personas like DevOps, data engineers, and MLOps engineers. It is the same discipline used in tracking business metrics and industry-specific requirements, but in this post we will focus on what observability means to people in these three more technical roles.
The three types of engineers use observability to solve different problems with distinct workflows. At the highest level, infrastructure observability is concerned with software problems that often revolve around latency, failures, and resource utilization. Data observability, on the other hand, cares more about changes in data that your application is using, either at rest in the database or in any step that feeds into your data storage system. Machine learning observability is a newer discipline; it focuses on the performance of your models, measuring how well they predict values either on aggregate in certain slices of the data or on the level of individual predictions with techniques like SHAP analysis.

Infrastructure Observability
Persona
Software/DevOps engineers are responsible for development and operations of software infrastructure. Their code is the mortar that holds all the bricks of modern software systems together.
Problem
Many modern applications rely on several systems coming together, and a small problem in one system can show up as a significant slowdown in the overall application.
A new version of the code can have unexpected bugs. Configuration changes, passwords, and rare occurrences like leap seconds can all cause troubles at this layer. Additionally, DevOps engineers are often responsible for software systems they did not design. Virtual machines or Kubernetes clusters running their code can fail.
Workflow
Several workflows can be employed at this layer, depending on where the problem manifests. Let’s look at one of them.
Say you are a DevOps engineer for a large ecommerce site—let’s call it Nile. Suddenly, pages start taking just a little bit longer to load. It is well established that a 1% slowdown on such an application can cause a 15% drop in customer satisfaction, which translates to huge loss of revenue.
No sweat—you have integrated your application with a market-leading observability solution. You get notified about the problem right away and can start troubleshooting.
First, since you logged your page load times as well as individual query times for each query on the page, you can identify which pages load slower than others. Then you can look at individual query times and sort them by which are taking the longest.
Deeper down in your system, you can identify sub-queries that are slowing you down. By analyzing the timing around these sub-traces, DevOps engineers like you are easily able to see patterns that point them to the root cause of the problem. In this case, a recent code change introduced more latency in history lookup for customers with more than 300 purchases in the last year, and thanks to tail latency amplification, all your customers paid the price. You back out the change until your team can figure out how to deploy it without incurring such costs.
Problem solved.

Data Observability
Persona
Data Engineers and Analytics Engineers are responsible for building and operating data pipelines. They ensure the timeliness, completeness, and other quality characteristics of the data that your application receives.
Problem
When the original source of the data makes a change, it may alter the schema, contents, or arrival times of the data into the data lake or warehouse. For example, say your data vendor switched from US zip codes (number) to global postal codes (strings). Suddenly a step in your pipeline malfunctions because it relies on a zip code being a number or being exactly 5 digits long, and you get partial or null postal code for all your Canadian customers.
Other problems can include stale data (from a pipeline not running on time), volume (accidentally dropped or duplicated records), and distribution (a negative value for a person’s age or a new categorical value). These can be caused by changes in the data’s original source, issues with the data infrastructure, or changes to the code in various transformation steps the data goes through as it moves down the pipeline.
Identifying these issues across all data pipelines, 24/7 is crucial to preventing data outages from reaching the data used by models for training and serving, and quickly scales beyond manual approaches like spot checks and even semi-automated approaches like data pipeline tests.
Workflow
Now let’s say you are a data engineer for a fast-growing analytics company. You got your first huge customer, and they have just launched a crucial marketing campaign that depends on your company’s customer segmentation model. The recommendations your model serves over the next 24 hours will make a huge difference to their business and yours. And that model depends on fresh audience data to serve up.
You get an alert from your data observability tool: a table that is supposed to update every 60 minutes has not been updated in 75. Clicking the link in the alert takes you to the SLA for one of your third party data providers. You see that the data is stale, and that a similar issue happened a few months ago. Reading the incident notes your teammate left when they fixed this last time, you see which provider this data comes from, and their phone number. You pick up the phone and give them a call. Guess what? They didn’t even know they had an issue until you called. Their SSL certificate expired and the cron job they are using to renew it got stuck. They rerun the script manually, and your data observability tool confirms that everything is back to normal. Time to detect: 15 minutes. Time to fix: 10 minutes. Customer impact: negligible. No one even knows you just saved your company’s biggest deal to date.

Machine Learning Observability
Persona
Machine learning engineers are responsible for developing, productionizing, and operating machine learning models.
Problem
More and more software systems rely on machine learning models. More and more economic value relies on machine learning models. A poorly performing model can lead to poor decisions or worse, loss of reputation and revenue for many customers.
Unlike traditional software, however, machine learning models are not static. Performance usually degrades over time. In fact, one survey has shown that on average models degrade within 10 days of being in production. It is vital to have the tools to detect problems, establish root cause, and improve models as quickly as possible.
Workflow
For this example, let’s say you are a machine learning engineer maintaining a fraud model for a major bank. Your model labels transactions as fraudulent (or not). One day your ML observability system sends you an alert. You log in and can quickly arrive at the very slice of inputs that seem to generate unexpected output distribution. Among the inputs, you can identify a new scammer. Perhaps this new scammer exhibits behaviors the model has not seen before, but you can retrain it with this new data included and catch them and anyone else who tries this scheme in the future.
Collecting useful information is once again key. In this case, you are looking for model inputs and outputs over time. Once you have the data you need, having some idea of baseline performance is very useful.
When the model performance goes outside the baseline bounds, you can zoom in on the timeframe where the issues are present. Next you would sort your data by slices and evaluate the problematic ones.

Conclusion
As software becomes more integral in the world at large and in your company in particular, the need for observability grows. The level of observability required for a complex software system today necessitates automated tools. Which tools you need depends on what problems you are solving. Typically software and DevOps engineers will mainly rely on system and infrastructure observability tools. Data engineers have specific challenges that require solutions tailored for data observability. Machine learning engineers require a whole different set of tools to troubleshoot degrading model performance. And as your team and company scale, you will probably find yourself needing all three.
This post is written in partnership with Kyle Kirwan, Co-founder and CEO at data observability platform Bigeye