


Best Practices In ML Observability for Click-Through Rate Models
Learn more about how Arize helps clients observe click-through rate models, dive into an interactive demo or request a trial of Arize.
Total digital ad spending is expected to reach $455.3 billion this year. Of that, 55.2% will go to display advertising and 40.2% will go to search. With digital formats commanding the lion’s share of ad dollars, marketers need to continuously optimize the effectiveness of their campaigns. Click-through rate (CTR) is one metric advertisers use to help quantify digital ad effectiveness. For direct response advertisers, a click is often the first step toward a consumer making a purchase online — or a decent proxy for purchase intent where offline sales data is unavailable or difficult to attribute to a given ad.
CTR is calculated by dividing the number of clicks by the number of impressions and expressing the result as a percentage. According to recent benchmarks, the average CTR in Google AdWords across all industries is 3.17% on the search network and 0.45% on the display network.
Over the years, machine learning (ML) systems have become more sophisticated in their ability to effectively predict the probability of a click. Many factors influence CTR, from contextual relevance (where an ad is running, position on a page, ad format, etc.) to user attributes (which device a person is using and their location or deeper first-party data on demographics, shopping history, media consumption habits, and a lot more).
Understanding the Ad Selection Process
To better understand how machine learning systems fit into the advertising ecosystem, let’s take a closer look at the ad selection process.
Over 90% of display and search ads are transacted programmatically. The process begins when a user loads a web page or app (e.g. The New York Times, Expedia, ESPN) or search engine. The publisher then sends a request to an advertising exchange with information such as the URL, publisher name, position on the page, device, matching keywords, and other information to help advertisers better target specific audiences. The ad exchange then submits the request to multiple advertisers through a demand-side platform (DSP). Advertisers that have an ad with matching criteria are entered into the auction by issuing a bid. The auction then takes place and the ad impression goes to the highest bidder, with the ad then served on the page. All of this happens in milliseconds before the page loads, without the user noticing. If the user is interested in the ad, they may click or take other action; if not, they may just scroll right past it or not even notice it at all.
ML-powered systems exist on both sides of this transaction, boosting yield for publishers and performance for advertisers. While click-through rates are the focus of this piece and one of the most frequently-used and easy-to-measure key performance indicators, it should be noted that a diverse array of models exist to optimize on everything from TV planning to reach specific audiences to video ad viewability and minimizing botnet traffic.

Challenges Particular To CTR Models
As CTR models are rolled into production, there are some common challenges that can lead to lower performance than expected. These include:
- New and unseen trends: CTR models are often trained on historical data on a specific set of websites (i.e. the top 1000 most popular news publishers) along with other inputs. If an ad exchange starts sending bid requests for new popular websites that were not part of the original training data, an ad could end up getting placed on a page that does not align with the context of the ad, resulting in a lower CTR. An example of this could be when a site such as Vice or Buzzfeed starts gaining popularity and less is known on how an ad might perform on these sites.
- Time of day or seasonal fluctuations: Some search keywords or display ads may be more or less relevant during certains periods of the year, or less likely to get a click during the morning versus the afternoon. For example, users may be more likely to click on a search ad for a sushi restaurant during lunch or dinner hours than on their morning commute to work. Given this, tracking how a model performs or degrades over specific time periods is critical.
- Bad, corrupt, or missing key input data: CTR models are often impacted by data quality issues, including missing data. If a model’s inputs include device information, the absence or corruption of this feature is likely to impact performance. More specifically, an ad with a “download app” call-to-action may be more relevant to someone on a mobile device and result in a low CTR if delivered to someone on a computer where it is less contextually relevant. Similarly, location information is particularly relevant to mobile advertisers when users are out and about, perhaps already shopping. An example of location targeting in mobile advertising would be the distance from a user to the nearest store. In these cases, unreliable location data may have a negative impact on CTR performance.
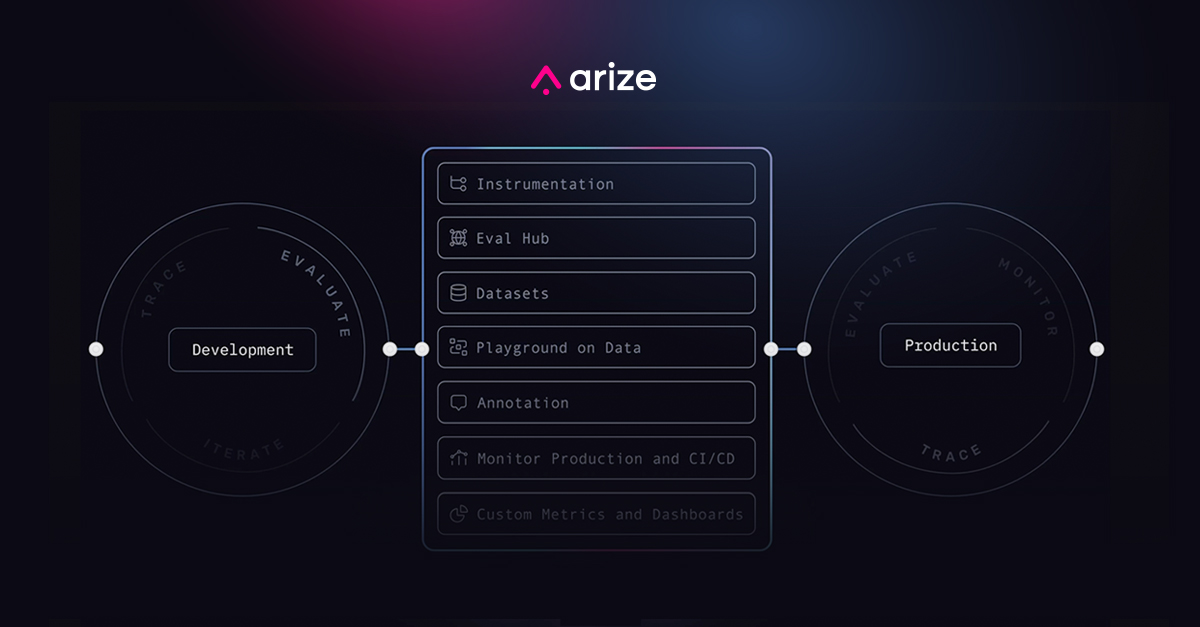
Best Practices for ML Monitoring & Observability with CTR Models
Once you set up a baseline and monitors for your CTR models, the task at hand becomes identifying the root cause of issues and responding before ad performance significantly declines. Since consumer behavior and media consumption are always in flux, it’s important to detect and act on problems or changes in behavioral trends quickly.
Important Metrics
When evaluating your CTR model, some important metrics to watch include:
- Log Loss: Accuracy is a metric that calculates how many times a model made a correct prediction. However, with CTR — which averages 0.45% on display ads — our model could reach 99% accuracy by always predicting “no click” and still be missing every single click opportunity. Log loss, on the other hand, is one of the best classification metrics used for measuring probabilistic model predictions. Log loss answers the question of how likely the model believed the actual observed set of outcomes was. The more the predictions diverge from the actual value, the higher the log loss. In this case, the prediction score might be: “how likely is someone to click?” (e.g. 0.15, 0.2 0.05), with the actual score being “did someone actually click?” (e.g. 0,1,0).
- PR AUC: A PR curve illustrates the tradeoff between precision and recall (PR) at various threshold settings, and AUC is the area under the curve (AUC). Precision measures the percent of positive classifications (true positives and false positives) that are truly positive; recall measures the percentage of true positives (e.g. predicted and actual clicks) versus all classified positives, including those that were misclassified (e.g. false negative). Generally, a PR-AUC metric is used when you have a small positive class or an imbalanced dataset, you are most concerned with ensuring every positive prediction is correct (precision) and that you get as many of the positives predicted as positives as possible (recall) — highly applicable to CTR models.
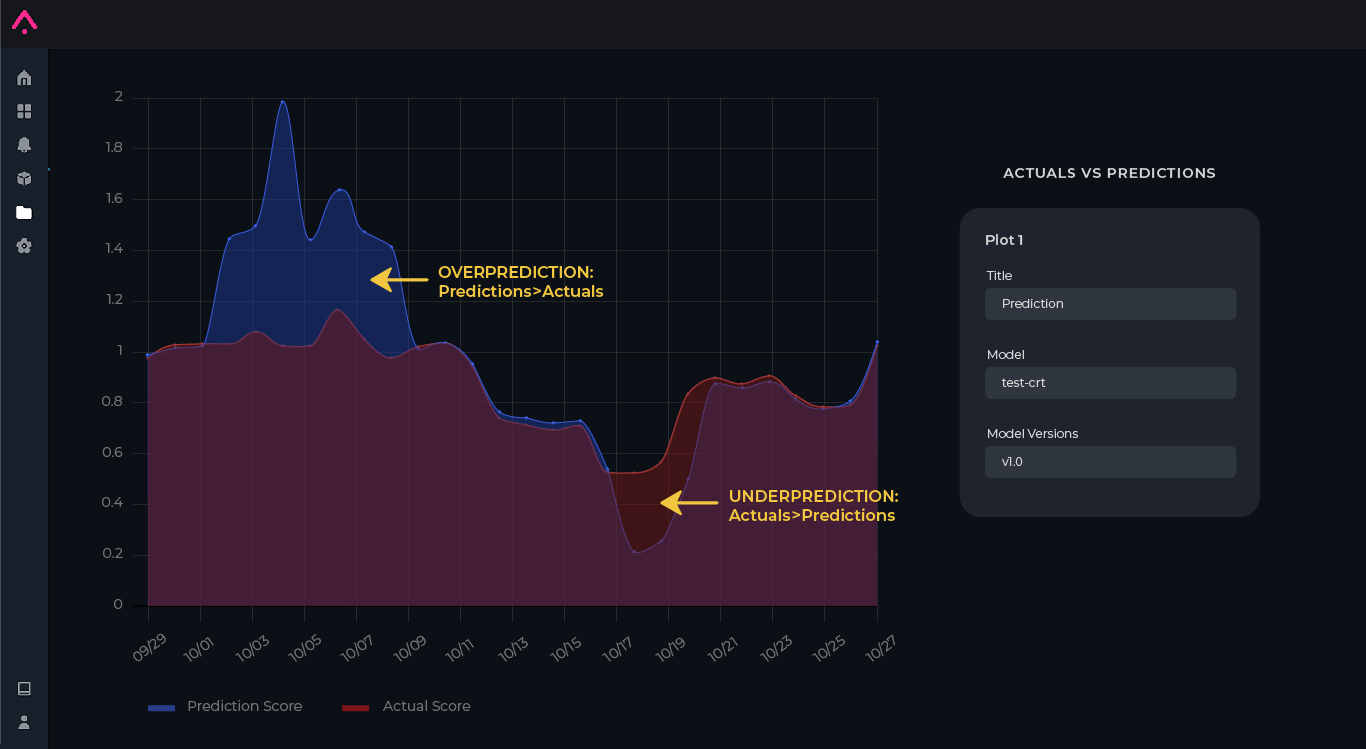
- Time series of predictions versus actuals: When troubleshooting your CTR model, a time series graph plotting prediction score versus actual score can show you when your model is experiencing issues — a good first step to finding when your model is most wrong. If there are issues with the model, you will see fluctuations on specific time periods that you can click deeper into, investigating which slices are the root cause of the over or under-prediction.
Armed with these metrics, teams can dive deeper into performance degradation, analyze if their model is showcasing any drift, and/or surface inconsistencies or other data quality issues.
Performance Degradation
Once you identify an issue, it’s critical to identify the slices — or cohorts of feature values — driving the drop in performance. Diving into an analysis of your model by filtering on various low-performing slices can help bring to light specific fluctuations in user behavior impacting performance.
Revisiting the example of an ad for a sushi restaurant, the slices behind a sudden drop in model performance might reflect the fact that a model wasn’t sufficiently trained on different times of day — such as during early-morning hours when few are craving sushi. ML teams can then adaptively retrain the model to improve performance for different times of day, not opting to bid on ad opportunities or search terms during breakfast hours for example.
The Importance of Drift
As an ML practitioner, you are likely to encounter drift or distribution changes over time. Monitoring and troubleshooting drift is an important part of every practitioner’s toolkit.
Especially in advertising where shopping behavior and media habits are constantly changing, it’s important to account for drift to ensure your models stay relevant. Identifying feature, model, and actual drift between various model environments and versions can be helpful in identifying patterns, data quality issues, and changing user behaviors across your distributions.
Let’s go back to the example where you see a sudden surge in traffic from a new popular website. By noting significant changes between a feature input (in this case, newly popular site) in training versus the values your feature is seeing in production, you can proactively retrain your models to account for this new trending site.
Another example that you may encounter (this time on concept drift) is a sudden surge in click actuals compared to the model’s predictions. Diving deeper might reveal the presence of fraudulent botnet traffic in production that was not present or a known issue in the training data, necessitating a revised and retrained model that separates and predicts human versus nonhuman clicks.
Data Quality Assurance
We’ve all heard the phrase, “garbage in, garbage out.” Without clean data coming in, ML models can’t make accurate predictions. Having a view into data quality across different features is necessary to be able to troubleshoot any issues and make sure your model is working as it should.
Taking our earlier examples for bad data: digging into different features, we noticed that we are getting empty data for device and location, which is impacting the model’s ability to correctly predict CTR. With both of these features having high importance in our predictions, noticing this is important to be able to identify the root cause of the issue.
Conclusion
As digital advertising spend continues to grow and become a bigger portion of brands’ advertising budgets, it’s critical for data science and ML teams to have an observability strategy in place to catch, monitor and troubleshoot problems with their CTR models in production. By having an approach that is both reactive in monitoring key metrics and proactive in measuring drift and data quality and performance, ML teams can begin to get ahead of potential problems before they impact campaign performance.