Instrumenting Your LLM Application: Arize Phoenix and Vercel AI SDK
Instrumentation is an important tool for developers building with LLMs. It provides insight into application performance, behavior, and impact.
This blog will cover:
- Why instrumentation matters for LLM applications
- Benefits of implementing instrumentation
- A guide on integrating Arize Phoenix with Vercel AI SDK for observability in Next.js applications
Why Instrument Your LLM Application?
1. Performance Monitoring
LLM performance can vary based on numerous factors such as input complexity, model size, and runtime conditions. By implementing instrumentation, you can monitor key metrics like response times, latency, and token usage. This data helps identify bottlenecks and performance issues in your application. With these insights, you can optimize your application for better efficiency and user experience, potentially adjusting model parameters, refining prompts, or restructuring your application architecture.
2. Quality Assurance
LLMs are not infallible and can produce inconsistent or inappropriate outputs. Instrumentation helps detect anomalies in model responses, track the quality and relevance of generated content, and identify potential biases or errors in the model’s output. This level of oversight is important for maintaining the integrity and reliability of your LLM apps.
3. Resource Management
LLMs can be resource-intensive, often requiring significant computational power and memory. Instrumentation allows you to track resource usage, including CPU and GPU utilization, memory consumption, and associated costs. This data helps you manage expenses, allocate resources efficiently, and make informed decisions about scaling your infrastructure.
4. User Behavior Analysis
Understanding how users interact with your LLM application is key to its improvement. Instrumentation provides insights into user queries and preferences, data on which features are most utilized, and information on user satisfaction and engagement. These insights can guide feature development and user experience enhancements.
5. Compliance and Auditing
In many industries, the use of AI is subject to regulatory scrutiny. Instrumentation supports logging of all AI interactions for audit trails, tracking of data usage and privacy compliance, and generation of reports for regulatory bodies.
6. Continuous Improvement
This field is dynamic, with models and best practices evolving rapidly. Instrumentation facilitates A/B testing of different model versions or prompts, tracking of model performance over time, and data collection for fine-tuning and improving your models. This data-driven approach allows your application to continue to meet user needs.
While the benefits of instrumentation are clear, implementing it effectively can be challenging. This is where observability tools like Arize Phoenix come into play. These tools provide easy integration with existing frameworks and SDKs, pre-built dashboards and visualizations, alerting systems for anomalies or issues, and advanced analytics capabilities. Phoenix allows developers to focus on building great AI applications while having confidence in their ability to monitor and improve them over time.
The Arize Vercel Integration
Now that we understand the importance of instrumentation in LLM applications, let’s explore a practical implementation using Arize Phoenix and Vercel AI SDK. This integration allows developers to easily add observability to their AI-powered applications built with Next.js.
Sample code of a complete Next.js application with Arize Phoenix implemented can be found at this repository.
1. Install Dependencies
To get started, you’ll need:
- Vercel AI SDK version 3.3 or higher
- Arize Phoenix observability packages
- Vercel OpenTelemetry package
- General OpenTelemetry packages
Here is the full list of dependencies present in the example:
 "dependencies": {
    "@ai-sdk/openai": "latest",
    "@ai-sdk/react": "latest",
    "@arizeai/openinference-semantic-conventions": "^0.10.0",
    "@arizeai/openinference-vercel": "^1.0.0",
    "@opentelemetry/api": "^1.9.0",
    "@opentelemetry/api-logs": "0.52.1",
    "@opentelemetry/exporter-trace-otlp-proto": "^0.52.1",
    "@opentelemetry/instrumentation": "0.52.1",
    "@opentelemetry/sdk-logs": "0.52.1",
    "@opentelemetry/sdk-trace-base": "^1.25.1",
    "@vercel/otel": "1.9.1",
    "ai": "latest",
    "next": "latest",
    "openai": "4.52.6",
    "react": "^18",
    "react-dom": "^18"
  },
2. Enable Instrumentation in Next.js
Instrumentation and telemetry is currently “experimental” within Next.js.
To use these tools, you must enable the instrumentation hook within your next.config.js file:
/** @type {import('next').NextConfig} */
const nextConfig = {
  output: "standalone",
};

nextConfig.experimental = {
  instrumentationHook: true,
};

module.exports = nextConfig;
3. Create an Instrumentation File
Set up an instrumentation.ts file that will be automatically picked up by Next.js:
import { registerOTel } from "@vercel/otel";
import { diag, DiagConsoleLogger, DiagLogLevel } from "@opentelemetry/api";
import {
  isOpenInferenceSpan,
  OpenInferenceSimpleSpanProcessor,
} from "@arizeai/openinference-vercel";
import { OTLPTraceExporter } from
"@opentelemetry/exporter-trace-otlp-proto";
import { SEMRESATTRS_PROJECT_NAME } from "@arizeai/openinference-semantic-conventions";

// For troubleshooting, set the log level to DiagLogLevel.DEBUG
// This is not required and should not be added in a production setting
diag.setLogger(new DiagConsoleLogger(), DiagLogLevel.DEBUG);

export function register() {
  registerOTel({
    serviceName: "phoenix-next-app",
    attributes: {
      // This is not required but it will allow you to send traces to a specific project in phoenix
      [SEMRESATTRS_PROJECT_NAME]: "phoenix-next-app",
    },
    spanProcessors: [
      new OpenInferenceSimpleSpanProcessor({
        exporter: new OTLPTraceExporter({
          headers: {
            api_key: process.env["PHOENIX_API_KEY"],
          },
          url: "http://localhost:6006/v1/traces",
        }),
        spanFilter: (span) => {
          // Only export spans that are OpenInference to remove non-generative spans
          // This should be removed if you want to export all spans
          return isOpenInferenceSpan(span);
        },
      }),
    ],
 });
}
Key points in this configuration:
- Add the OpenInference SimpleSpanProcessor to convert Vercel AI SDK spans into OpenInference-compliant spans.
- Use a span filter to export only generative AI-related spans.
- Configure the endpoint for exporting traces to Phoenix.
4. Enable Telemetry for AI SDK Calls
In your AI chat route file, enable telemetry for each AI SDK call like this:
import { openai } from "@ai-sdk/openai";
import { streamText } from "ai";

export async function POST(req: Request) {
  const { messages } = await req.json();
  const textStream = await streamText({
    model: openai("gpt-3.5-turbo"),
    maxTokens: 100,
    messages: messages,
    experimental_telemetry: {
      isEnabled: true,
      metadata: { route: "api/chat" },
    },
  });

  return textStream.toDataStreamResponse();
}
As you can see, telemetry is considered “experimental” here as well.
You can also add custom metadata to each call for better filtering and analysis in Phoenix.
Deployment and Monitoring
Once you’ve set up the instrumentation, you can deploy your application to Vercel. Make sure to set the necessary environment variables, including your OpenAI API key and Phoenix API key.
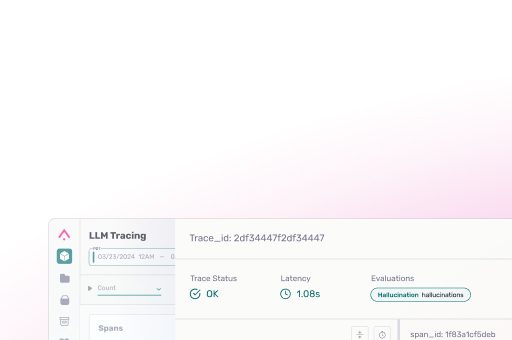
After deployment, you can monitor your application’s performance in the Phoenix UI. The traces will show details such as:
- Invocation parameters (e.g., max tokens)
- LLM output
- Token count
You can use Phoenix’s features to filter traces, annotate information, and perform quality assurance checks.
A video of the step by step walkthrough of running this integration can be found here. For more information and access to the open-source projects, visit the Arize AI GitHub repositories for Phoenix and OpenInference.


