Introducing ML Performance Tracing ✨
To see how Arize can help you enable ML performance tracing, signup for an account or request a demo.
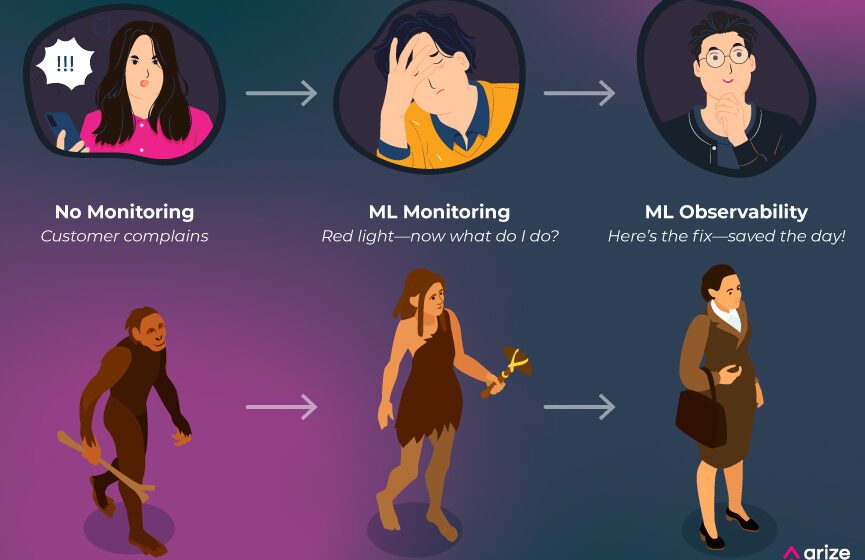
In part one of this content series, we covered how painful ML troubleshooting is today and how to get started with ML monitoring. However, monitoring alone does NOT lead to resolution.
Let’s revisit the situation from part one of this series. You are enjoying your morning coffee, but this time you have performance monitoring in place. Instead of getting a complaint from a product manager, you get a PagerDuty alert saying that “Fraud model performance declined.”
Your product manager, customer support team, and customers are still blissfully unaware of the increase in fraudulent transactions and you are aware of the issue before it has a big impact on the company. The performance metric has crossed the threshold, and you see the red light – but now what? To pinpoint and fix the issue, ML observability is needed.
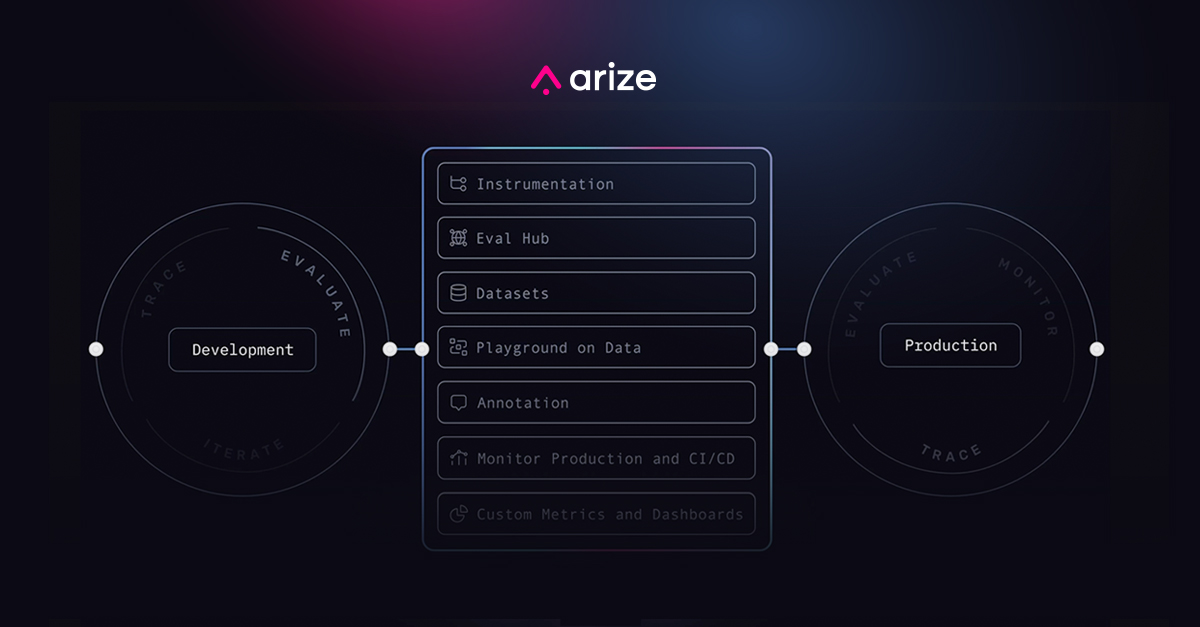
In part one of this series examining the evolution of ML troubleshooting, we covered the initial transition from no monitoring to monitoring. Here, we cover the next step: full stack ML observability with ML performance tracing.


