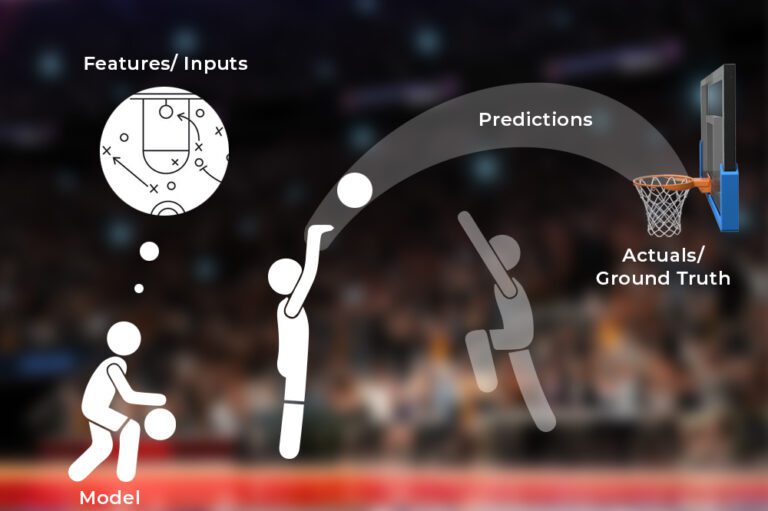
Data drift, feature drift, covariate drift and input drift all refer to a shift in the statistical properties of the independent variable(s), i.e. a drift in the feature distributions and the correlations between variables. This drift can result in data changes due to seasonality, consumer preferences, the addition of new products or other factors. When inputs move far from training coverage, models may keep producing scores but rank and calibrate poorly relative to labels you care about.
Build better agents with Arize
Trace, evaluate, and learn. Build agents that work with Arize AX and start tracing your runs today.
Prefer open source? Try Arize Phoenix for self-hosted, open source agent observability.

Key takeaways
- Data drift is change in P(x) or joint feature structure while the labeling rule may stay fixed.
- Univariate histograms miss correlation drift; monitor pairs and embedding space when features interact.
- PSI, KL-style scores, and population comparisons need stable binning and adequate sample sizes.
- Data drift alerts warrant performance checks on recent labels, not automatic retrain every time.
- Log schema changes (new enum values, renamed columns) as drift signals before they silently break featurizers.
Synonyms and scope
Teams use feature drift, covariate drift, and input drift interchangeably in runbooks. All describe production inputs diverging from the reference sample used to train or validate.
This is distinct from concept drift, where P(y|x) changes, and prediction drift, where model outputs shift even if inputs look stable (often from model version or threshold changes).
Common causes
Product launches that attract new user segments. Marketing campaigns changing traffic mix. Seasonality in retail and finance. Sensor degradation or firmware updates in hardware pipelines. Upstream ETL bugs duplicating rows or nulling fields. New categorical levels appearing in production that were rare or absent in training.
LLM apps see drift in prompt length, language, attached documents, and tool payload shapes.
Detection mechanics
Freeze reference histograms or quantile edges from training. On each window, histogram live data with the same edges and compute PSI or similar per feature.
Track missing rate, cardinality, and correlation deltas between key feature pairs.
For embeddings, compare cluster occupancy or centroid distances on sampled batches.
Set thresholds per feature importance. A drift on a low-impact decorative field differs from drift on credit utilization in lending models.
Response workflow
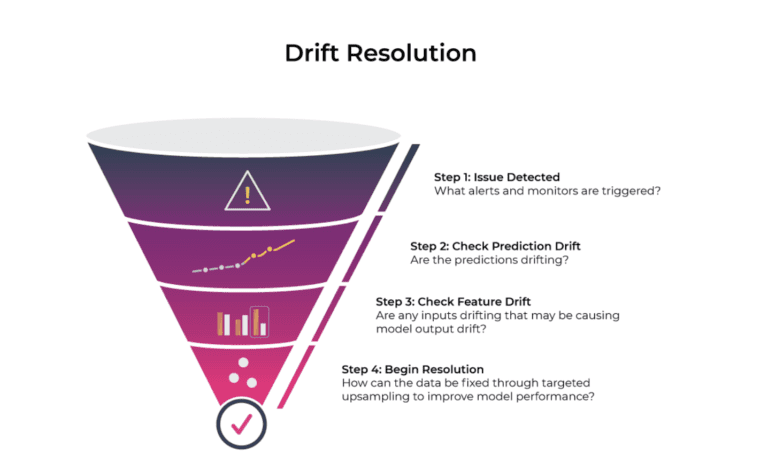
- Validate logging and featurization integrity.
- Quantify which bins or categories moved.
- Check slice performance if labels exist.
- Choose mitigation: retrain, importance-weighting, reject unknown categories, or manual rules until retrain completes.
Detailed guides on drift types appear in model, concept, and data drift, including how teams separate covariate shift from label relationship change.
Operational framing lives in AI model lifecycle management resources that connect drift monitors to retraining cadence.
Text classifiers benefit from language and sentiment cohort charts as shown in NLP sentiment classification monitoring.
Relationship to model performance
Data drift does not always hurt metrics immediately. Models can extrapolate smoothly until they hit regions with few training examples.
When performance drops with strong input drift, retraining on recent data often helps if labels remain consistent.
When performance drops without input drift, look for concept drift, threshold changes, or label pipeline bugs.
Multivariate and embedding drift
Pairwise correlation shifts can leave every marginal histogram green while joint structure changes enough to break tree splits or linear coefficients. Monitor a small set of business-critical feature pairs explicitly when models depend on interactions.
For text and retrieval pipelines, track embedding cluster occupancy and nearest-neighbor distance summaries. Scalar length and language metrics miss semantic novelty that still hurts ranking quality.
Failure modes in drift programs
Alert fatigue from PSI thresholds tuned too tight on noisy features.
Recomputing bins each run destroys trend lines.
Ignoring correlation shift while every marginal looks stable.
Retraining on drifted but mislabeled data encodes the wrong signal.
FAQ
Is data drift the same as outliers?
Outliers are extreme points. Drift is a population-level shift in where mass sits across the feature space.
How many features should I monitor?
Prioritize by model importance and business risk. Full cardinality on thousands of raw columns is rarely actionable; aggregate or embed when needed.
Does data drift require new labels?
Detection is unsupervised on inputs. Deciding whether to retrain still needs performance evaluation with labels or proxies.
How do embeddings drift?
New topics, products, or phrasing occupy new regions of vector space. Retrieval quality and classifier margins can fall before scalar feature drift fires.
Should I block predictions when drift is high?
Some teams route to fallback models or human review above PSI thresholds on critical features. Policy depends on error cost and review capacity.