The Kullback-Leibler Divergence metric is calculated as the difference between one probability distribution from a reference probability distribution. KL divergence is sometimes referred to as relative entropy and best used when one distribution is much smaller in sample and has a large variance. For ML engineers monitoring models in production, KL divergence offers a principled way to quantify how far live score or feature distributions have moved from a baseline, though its asymmetry means you must fix which distribution plays the role of reference before you interpret a number.
Build better agents with Arize
Trace, evaluate, and learn. Build agents that work with Arize AX and start tracing your runs today.
Prefer open source? Try Arize Phoenix for self-hosted, open source agent observability.

Key takeaways
- KL divergence sums (or integrates) P(x) log(P(x)/Q(x)): it measures excess surprise if you encode samples from P while believing they came from Q.
- The metric is zero when P and Q match almost everywhere; it is not symmetric, so KL(P||Q) generally differs from KL(Q||P).
- Small-sample and zero-probability regions need smoothing; undefined terms appear when Q assigns zero mass where P does not.
- KL pairs naturally with drift workflows alongside PSI and other information-theoretic scores on binned features.
- Pick the reference distribution deliberately because swapping reference and comparison changes the numeric result and the story.
Definition and intuition
For discrete distributions P and Q over the same support, KL divergence is:
KL(P || Q) = sum over x of P(x) log(P(x) / Q(x))
In the continuous case, replace the sum with an integral. The expression is the expected log-likelihood ratio of drawing from P versus modeling with Q. Informally, it captures how many extra nats (or bits, if you use log base 2) you spend when Q approximates P.
KL divergence is not a distance in the geometric sense. KL(P||Q) is not equal to KL(Q||P) in general, and the triangle inequality does not hold. That matters when you monitor production data against training data: calling one side “reference” and the other “current” is a modeling choice, not a neutral swap.
Relationship to relative entropy and cross-entropy
Relative entropy is another name for the same quantity. Cross-entropy decomposes as H(P) + KL(P||Q), where H(P) is the entropy of P. In training, minimizing cross-entropy on fixed data P is equivalent to minimizing KL(P||Q) because H(P) is constant with respect to Q. That link explains why KL appears throughout variational inference and policy optimization even when dashboards label the number as “drift.”
When KL is useful in ML
Score and prediction drift. Compare binned predicted probabilities from a validation window (reference) to live traffic (comparison). Rising KL flags that users see a different mix of confident versus uncertain predictions even if average accuracy looks stable.
Feature distribution shift. Bin numeric features or treat categorical levels as outcomes, estimate empirical P and Q, and compute KL on the histograms. KL reacts strongly when mass moves into bins where Q was near zero.
Generative and variational models. Training objectives often include KL terms that pull an approximate posterior toward a prior. That usage is optimization, not monitoring, but the same math governs both.
KL divergence is a well-known metric that can be thought of as the relative entropy between a sample distribution and a reference (prior) distribution. Like PSI, KL divergence is useful in catching changes between distributions and has its basis in information theory. One important difference from PSI is that KL divergence is not symmetric. A reversed distribution will have a different value: you get different values going from A to B than from B to A. There are reasons that having a non-symmetric metric is not ideal for distribution monitoring in that you get different values when you switch what is the reference versus compared distribution. That can feel non-intuitive to users of monitoring.
Practical computation notes
Binning. Continuous scores need histograms or quantile bins. Too few bins hide shift; too many bins inflate variance on sparse cells. Align bin edges to the reference window and apply the same edges to comparison data.
Zeros and smoothing. If Q(x) is zero while P(x) is positive, log(P/Q) is undefined. Add small epsilon mass, merge sparse tail bins, or drop empty bins with documented rules. Apply the same smoothing to both windows.
Sample size. KL from empirical histograms is noisy when counts per bin are low. The original stub note about large variance on smaller samples is worth heeding: gate alerts on minimum counts and rolling windows.
Conditional slices. Compute KL per segment (region, model version, user tier) to localize drift instead of trusting a global aggregate.
KL versus related drift metrics
Population Stability Index (PSI) also compares binned distributions with log ratios but uses a symmetric construction on percent differences. Total variation distance and Jensen-Shannon divergence symmetrize KL for users who need order invariance. Choose KL when you care about information-theoretic surprise relative to a fixed baseline; choose symmetric variants when leadership expects the same number regardless of argument order.
Tie KL thresholds to business impact, not textbook defaults. A small KL on a calibrated probability column may matter more than a larger KL on a low-importance feature. Concept and data drift monitoring explains how drift metrics fit alerting and root-cause workflows.
Monitoring workflow
- Freeze a reference window (training, validation, or last known good production week).
- Bin outputs and critical inputs with fixed edges.
- Estimate P from reference and Q from each production slice on a schedule.
- Compute KL(P||Q), log sample sizes, and compare to calibrated thresholds.
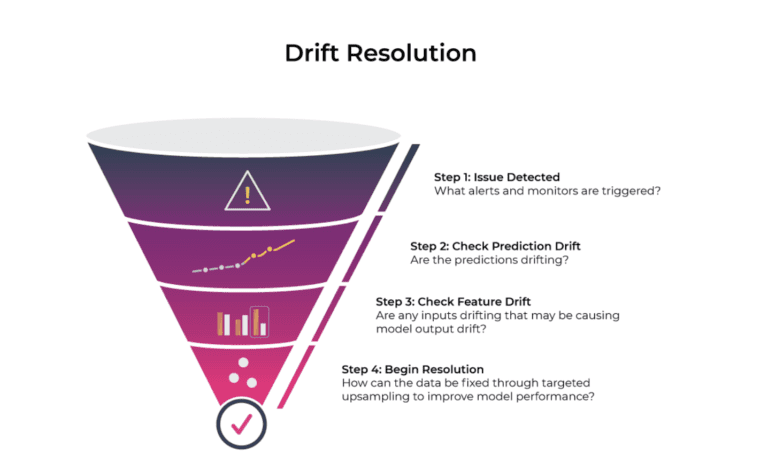
- When KL spikes, inspect cohorts, recent deployments, and upstream data feeds before retraining.
Document which distribution is P and which is Q in runbooks so on-call engineers interpret movement consistently. AI model lifecycle management practices help keep baselines versioned alongside model artifacts.
For NLP pipelines, label or score distributions can drift when language or product mix changes. Sentiment classification monitoring shows how slice-level metrics complement global divergence scores.
Limitations
KL is sensitive to unsupported events in Q. It does not indicate where mass moved, only aggregate divergence. It is not bounded above like PSI can be interpreted with rule-of-thumb bands. Combine KL with visual histograms, slice metrics, and performance dashboards rather than treating a single scalar as sufficient.
FAQ
Is KL divergence symmetric?
No. KL(P||Q) measures divergence from Q toward P in the information sense and generally differs from KL(Q||P). Fix the reference distribution before you compare runs or teams will talk past each other.
What is a “good” KL value for drift alerts?
There is no universal constant. Calibrate on historical windows where you know performance was acceptable, then set thresholds that minimize false alarms while catching real shifts. Always condition on bin counts.
How is KL related to cross-entropy loss?
Cross-entropy equals entropy of the true distribution plus KL divergence to the model distribution. Minimizing cross-entropy on fixed labels minimizes KL to the empirical label distribution.
Should I use KL or PSI for production monitoring?
Both compare binned distributions. PSI is symmetric and popular in credit modeling; KL ties directly to information theory and some training objectives. Many teams compute both until they learn which correlates with metric regressions on their stack.
Can KL compare embeddings directly?
Not without turning vectors into distributions first, for example via clustering, kernel density estimates, or histograms on scalar projections. Raw Euclidean distance between mean embeddings is a different tool than KL on binned marginals.