


The era of single-turn LLM calls is behind us. Today’s AI products are powered by increasingly autonomous agents — multi-step systems that plan, reason, use tools, and adapt in real time — or by complex applications built from chained prompts, retrieval pipelines, and external APIs.
These systems are dynamic and stateful. Since they handle memory, context, and decisions across many turns, they are harder to monitor and debug. Traditional logging and metrics fall short. Problems like context drift, bandwidth overload, tool misuse, and inefficient reasoning often go unnoticed until user experience breaks down.
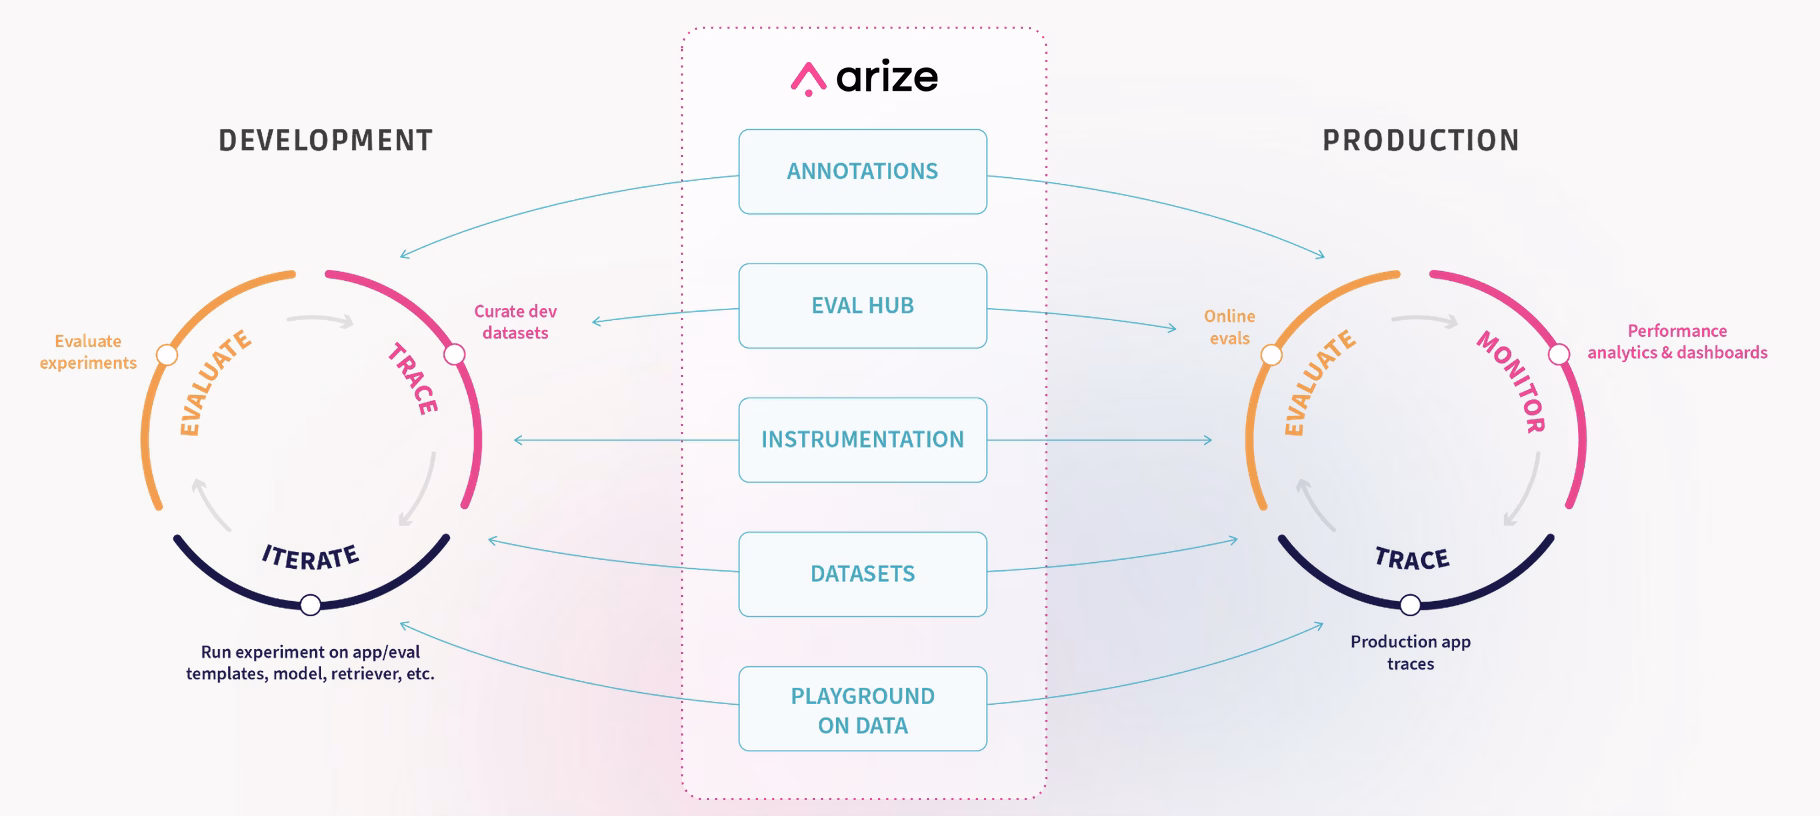
LLM observability addresses this gap. It provides structured visibility into how LLMs and agents behave, from individual spans within a trace to full multi-turn sessions. With the right instrumentation, teams can monitor, evaluate, and improve AI systems with the same rigor they apply to conventional software.
What is LLM Observability?
LLM observability is complete, real-time visibility into every layer of an LLM-based system and its behavior from development to production. It provides visibility into LLM inputs, how they reason, which tools they call, what outputs they generate, and how those outputs perform.
This visibility is achieved through traces, spans, and structured evaluations that help teams monitor latency, cost, correctness, and quality at each step of an LLM workflow.
This guide to LLM observability 101 covers some essential concepts and is designed to be useful whether you’re building a retrieval-heavy workflow or a multimodal assistant that talks and sees.
Key Concepts
Traces and Spans
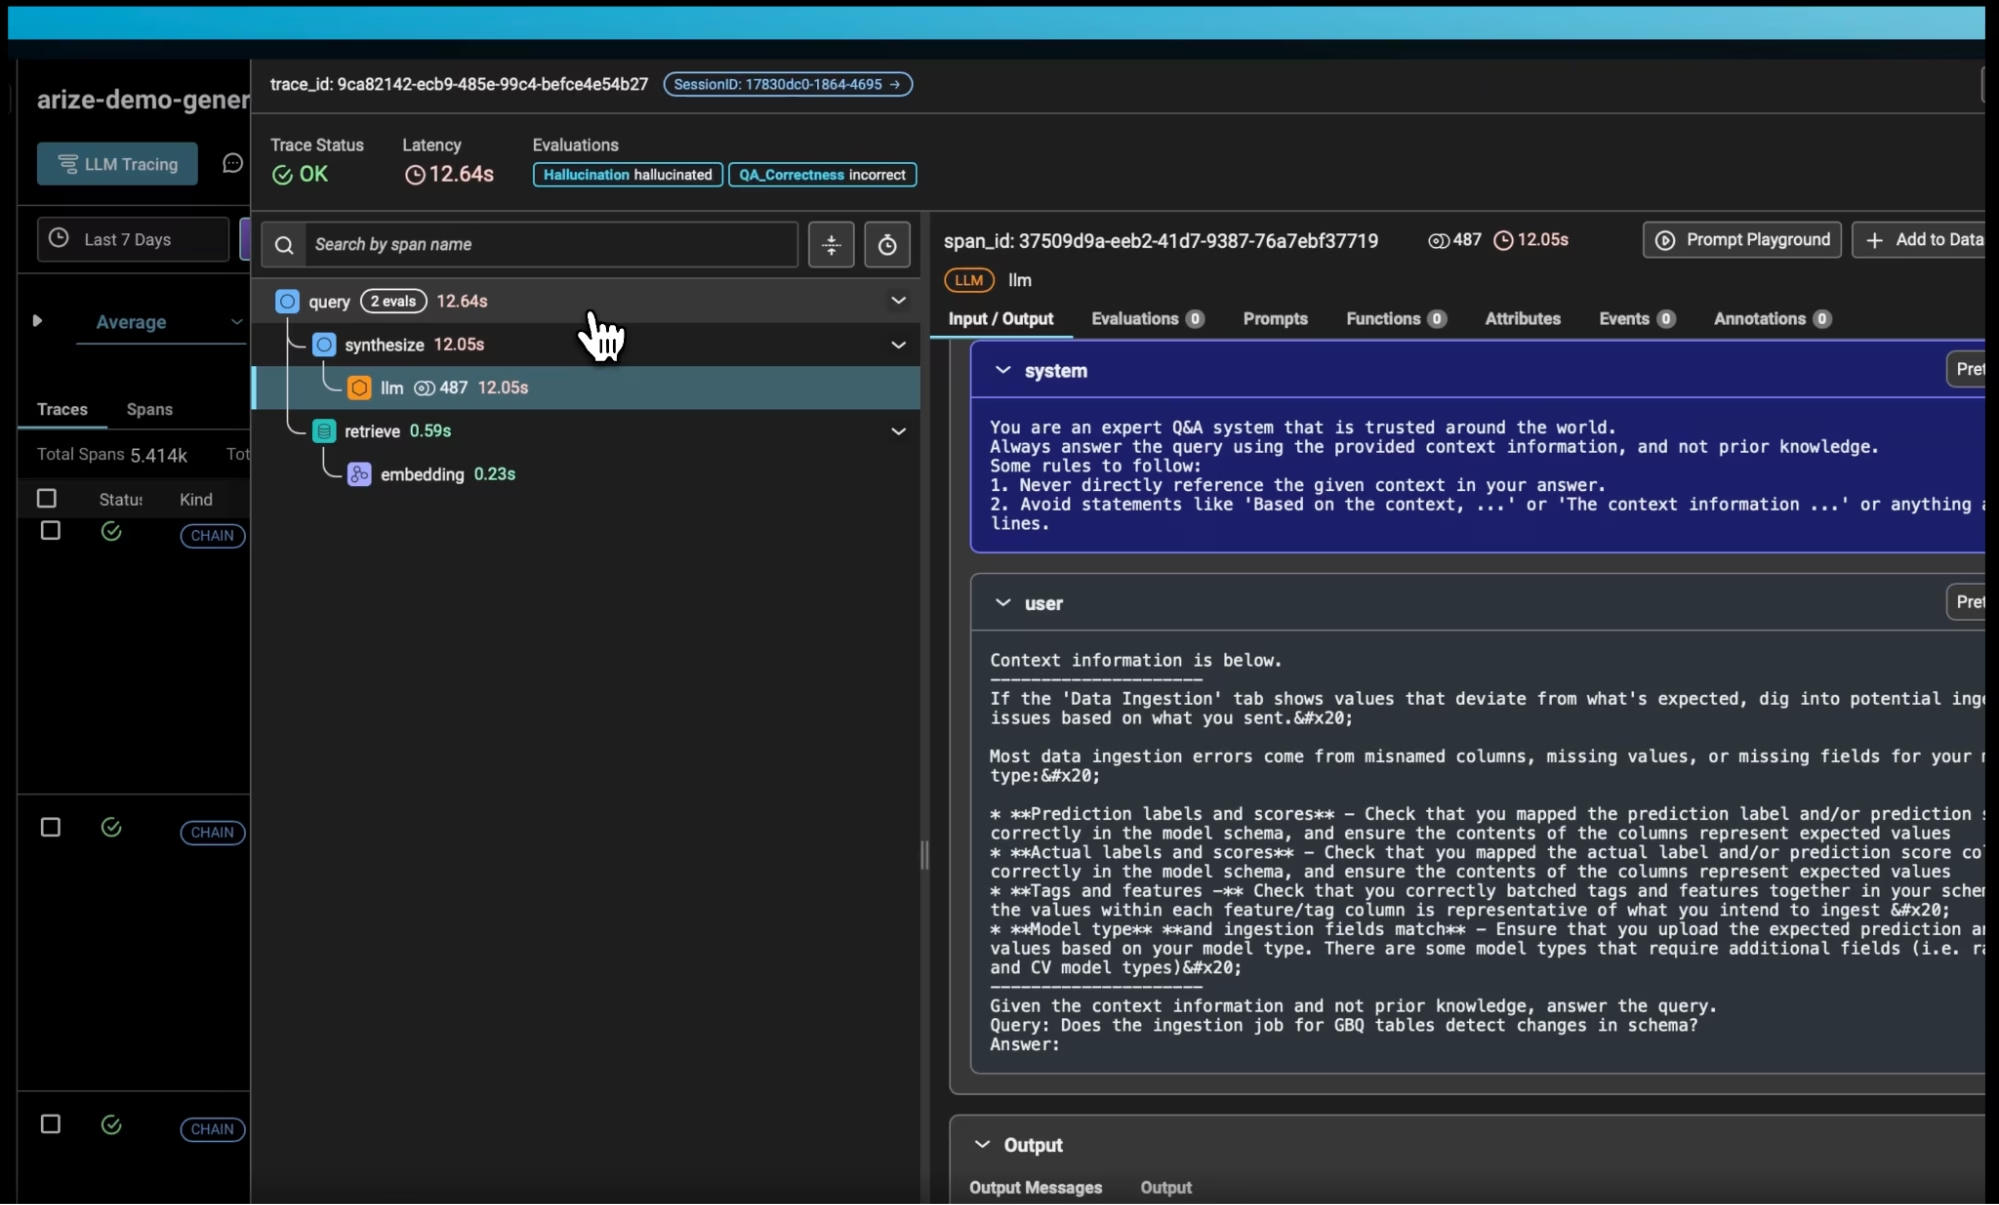
When a request moves through your system, it rarely takes a straight path. It calls models, queries databases, and zigzags through functions before finally returning a response. Tracing captures this entire journey, recording every step from the initial user action to the final response.
For LLM applications, which often wander through complex chains and nondeterministic twists, tracing is essential. It’s the difference between wondering why something broke and knowing exactly where and why it did. This end-to-end view allows you to identify the cause of performance bottlenecks and fix them with intention.
A trace is composed of spans. It’s nice to think of a span as a slice of time where a specific operation runs – such as a tool call, database query, or LLM completion. Each span carries a name, timing data, structure logs, and attributes that add context to what happened during that operation.
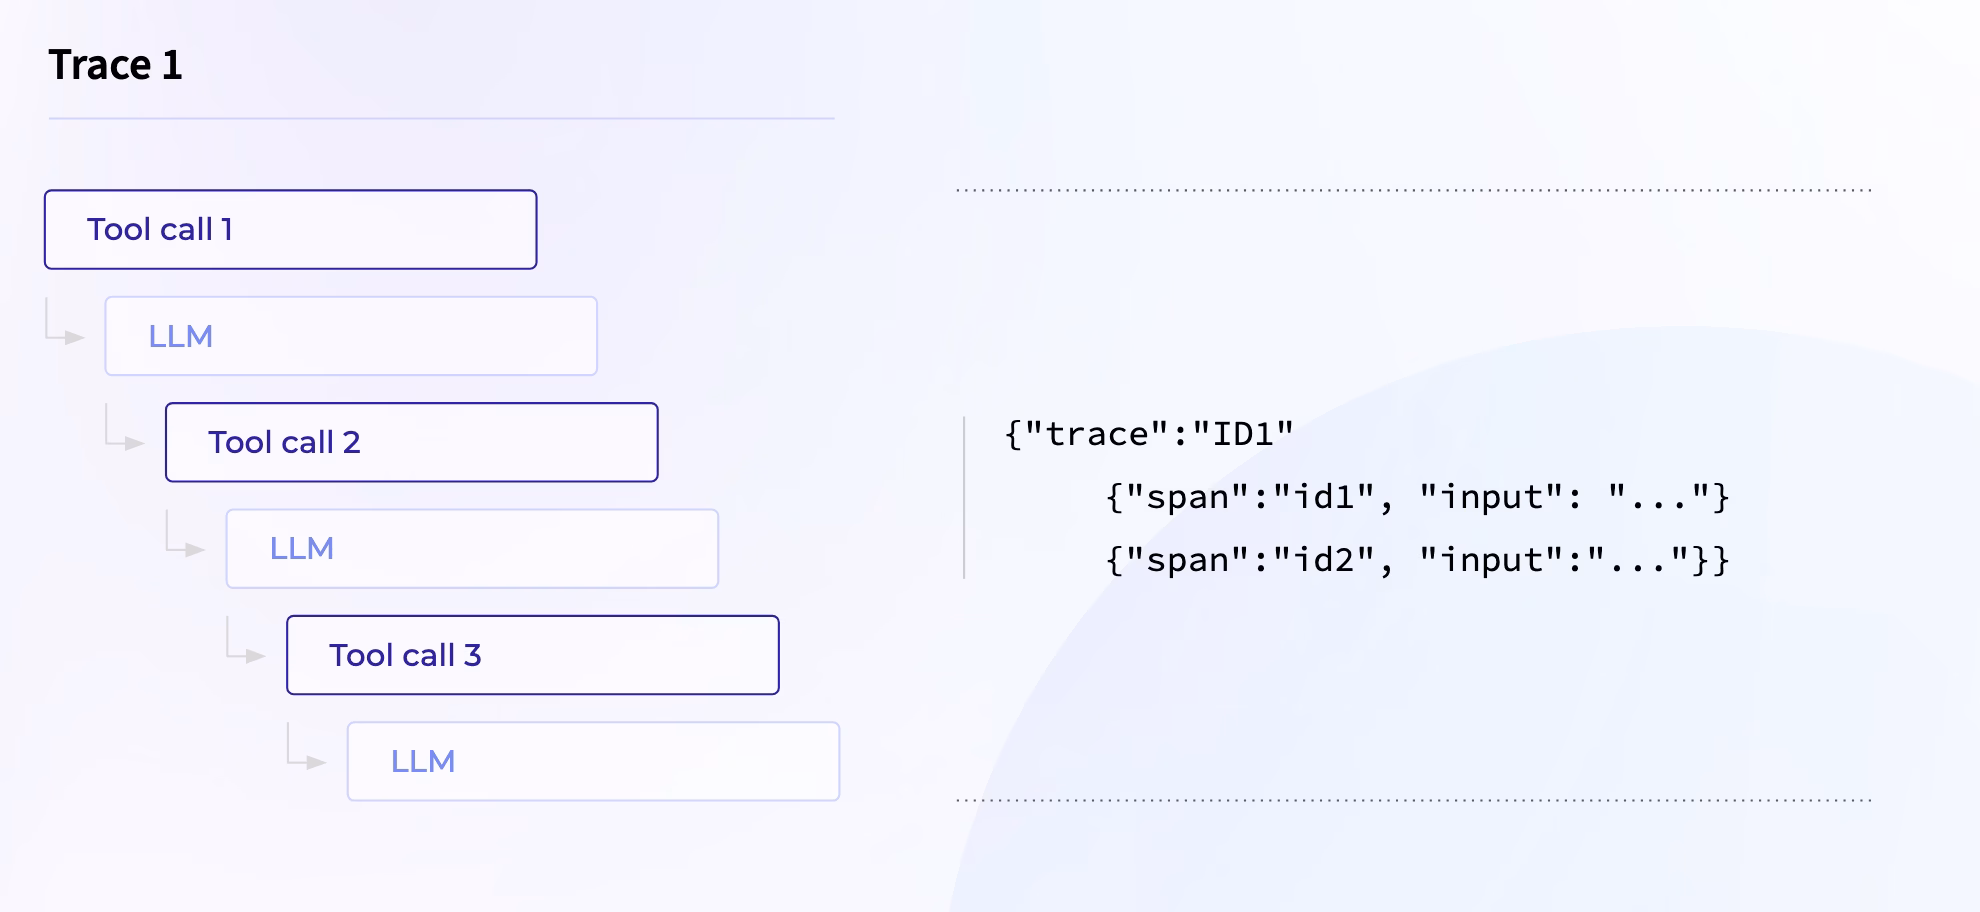
Why does this matter? Capturing spans helps teams analyze latency, track costs, and connect model behavior with downstream system performance. Together, these details provide a clear, structured picture of what happens during each part of a request, enabling you to debug and optimize your system effectively.
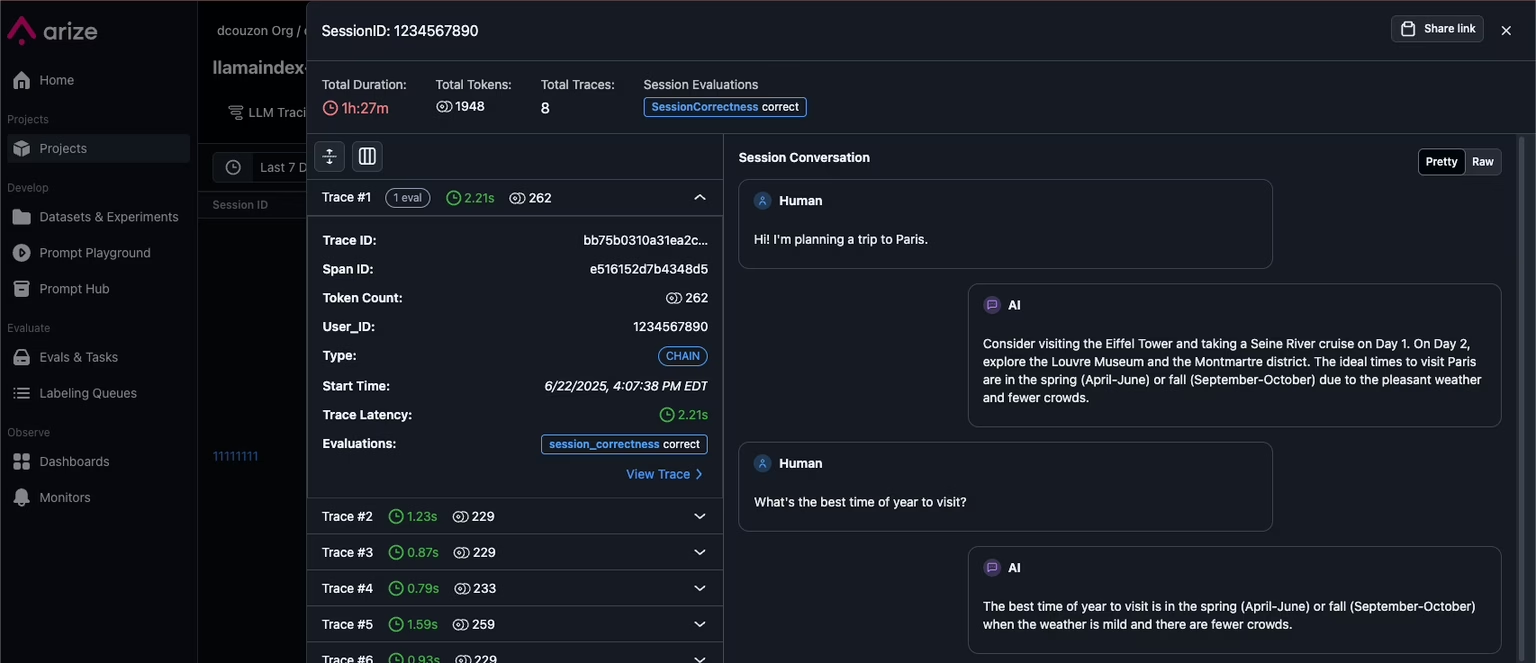
Sessions and Session Evals
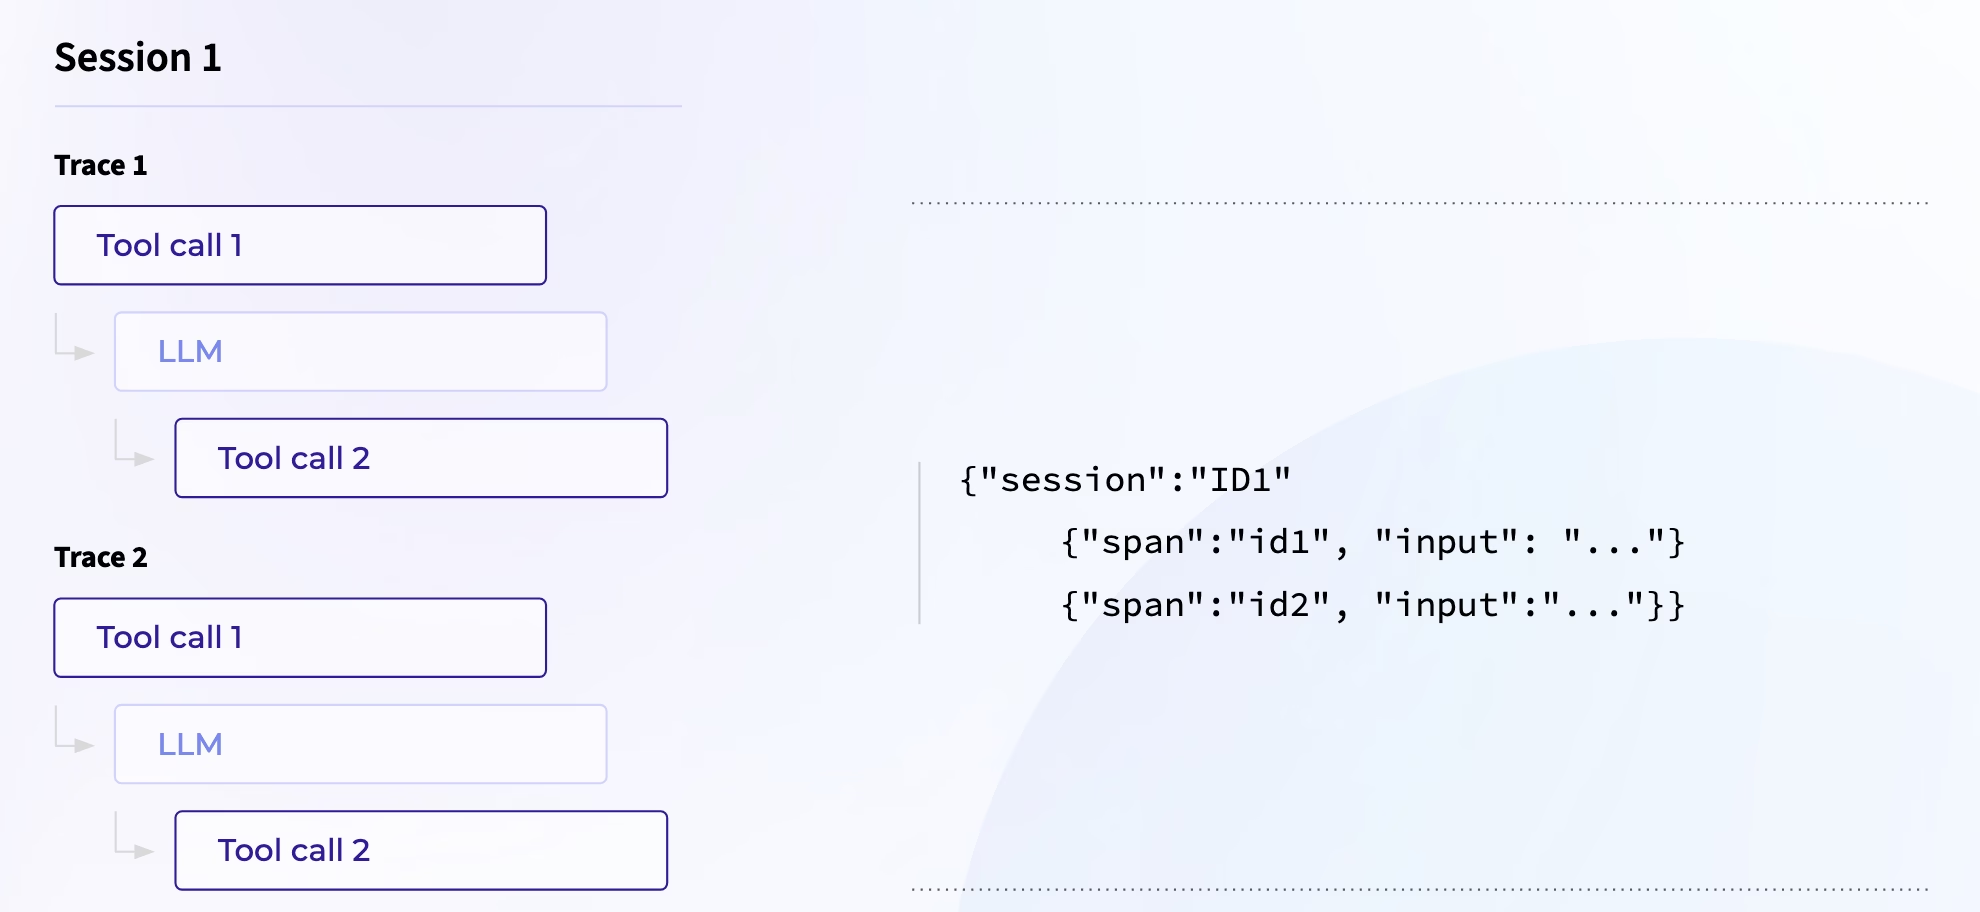
While spans and traces are great for understanding what happens during a single request, sessions allow you to zoom out and see how multiple interactions unfold.
A session groups multiple traces together using a session ID attribute, tying them to a single conversation or user journey. Sessions let you spot where a conversation “breaks” or quietly drifts off track. Individual requests can appear healthy in isolation, but when viewed together, the full conversation can reveal a different story – like when a chatbot’s answers slowly become irrelevant and a user’s curiosity turns to frustration.
Using sessions unlocks session-level evaluations to measure the quality of an interaction. Did the agent maintain a logical, coherent flow? Did it remember and use information from earlier turns? Most importantly, did it actually help the user achieve their goal?
Sessions let you answer these questions, turning a scattered collection of requests into a clear, actionable view of how your AI application behaves on a broader level – a capability that span- or trace-level evaluations alone can’t achieve
Instrumentation Methods: OpenTelemetry (OTel) and OpenInference
OpenInference is an open-source framework designed to instrument and capture detailed telemetry (like traces and spans) from AI agents and LLM-powered workflows. It tracks different code executions across models, frameworks, and vendors and maps them to a set of standardized attributes. The result is rich, structured traces of how your agents operate.
By integrating OpenInference with OpenTelemetry (OTel)—the industry-standard system for collecting application telemetry—you can easily gather and export these traces. This data flows directly into collectors, giving you visibility into every agent interaction and performance metric.
An observability platform like Arize AX or Arize-Phoenix acts as the collector and a UI, ingesting, storing, and visualizing this telemetry to give you real-time insights into how your agents think and act. Together, OpenInference and OpenTelemetry lay the foundation for an end-to-end observability pipeline.
Analytics: Business-Driven Observability
In complex AI systems, it’s easy for your applications to feel like a black box – inputs go in, outputs come out, and what happens in between is anyone’s guess. But guesswork can’t scale, and it certainly doesn’t help when user experience is on the line.
Observability connects the dots between low-level telemetry and the real-world outcomes that matter.
By layering tracing and evaluation, teams gain clear visibility into where interactions break down, where frustration quietly builds, and where goals fall short. Instead of spending time sifting through logs hoping to spot the source of failure, observability lets teams filter and analyze what’s happening inside the system. That means energy can be spent on fixing the problems and maintaining healthy, reliable systems that actually deliver consistent value.
Agent Observability
Agent observability is a specialized form of LLM observability focused on autonomous AI agents. These agents often operate over multiple steps, maintain memory, and make decisions based on internal planning and tool usage. They are also sometimes multiple agents connected together through complex routing logic and handovers that may connect with MCP servers as tools.
Regardless of structure, agent observability tracks this full reasoning process at each step so developers can see exactly how the agent arrived at its final output. For more on this, check out our detailed guide on AI agent observability.
Dev Versus Enterprise Patterns: Alerting
Thorough evaluation helps uncover issues early and establishes the groundwork for maintaining agent reliability. Whether you’re developing locally or running at scale, alerting and monitoring help you stay ahead of potential issues. Alerting can look different when you’re tinkering with your agent locally versus running it in production.
In development, you might rely on lightweight alerts like printing failing evals to your console, dropping Slack notifications for specific error traces, or visual spot checks in your observability dashboards. These custom span property monitors help you iterate quickly without getting bogged down.
In enterprise environments, altering needs grow alongside your workload and business SLAs. Here, structured, threshold-based alerts tied to your evaluation metrics become essential. Before your users run into issues, you’ll want to catch a spike in hallucinations, a jump in voice processing latency, or a drop in tool call accuracy.
Tools like Arize let you create monitors based on your evaluation results and trace metrics. This transforms your observability results into a proactive safety net, helping keep your agents reliable in the wild.
LLM Observability Tools
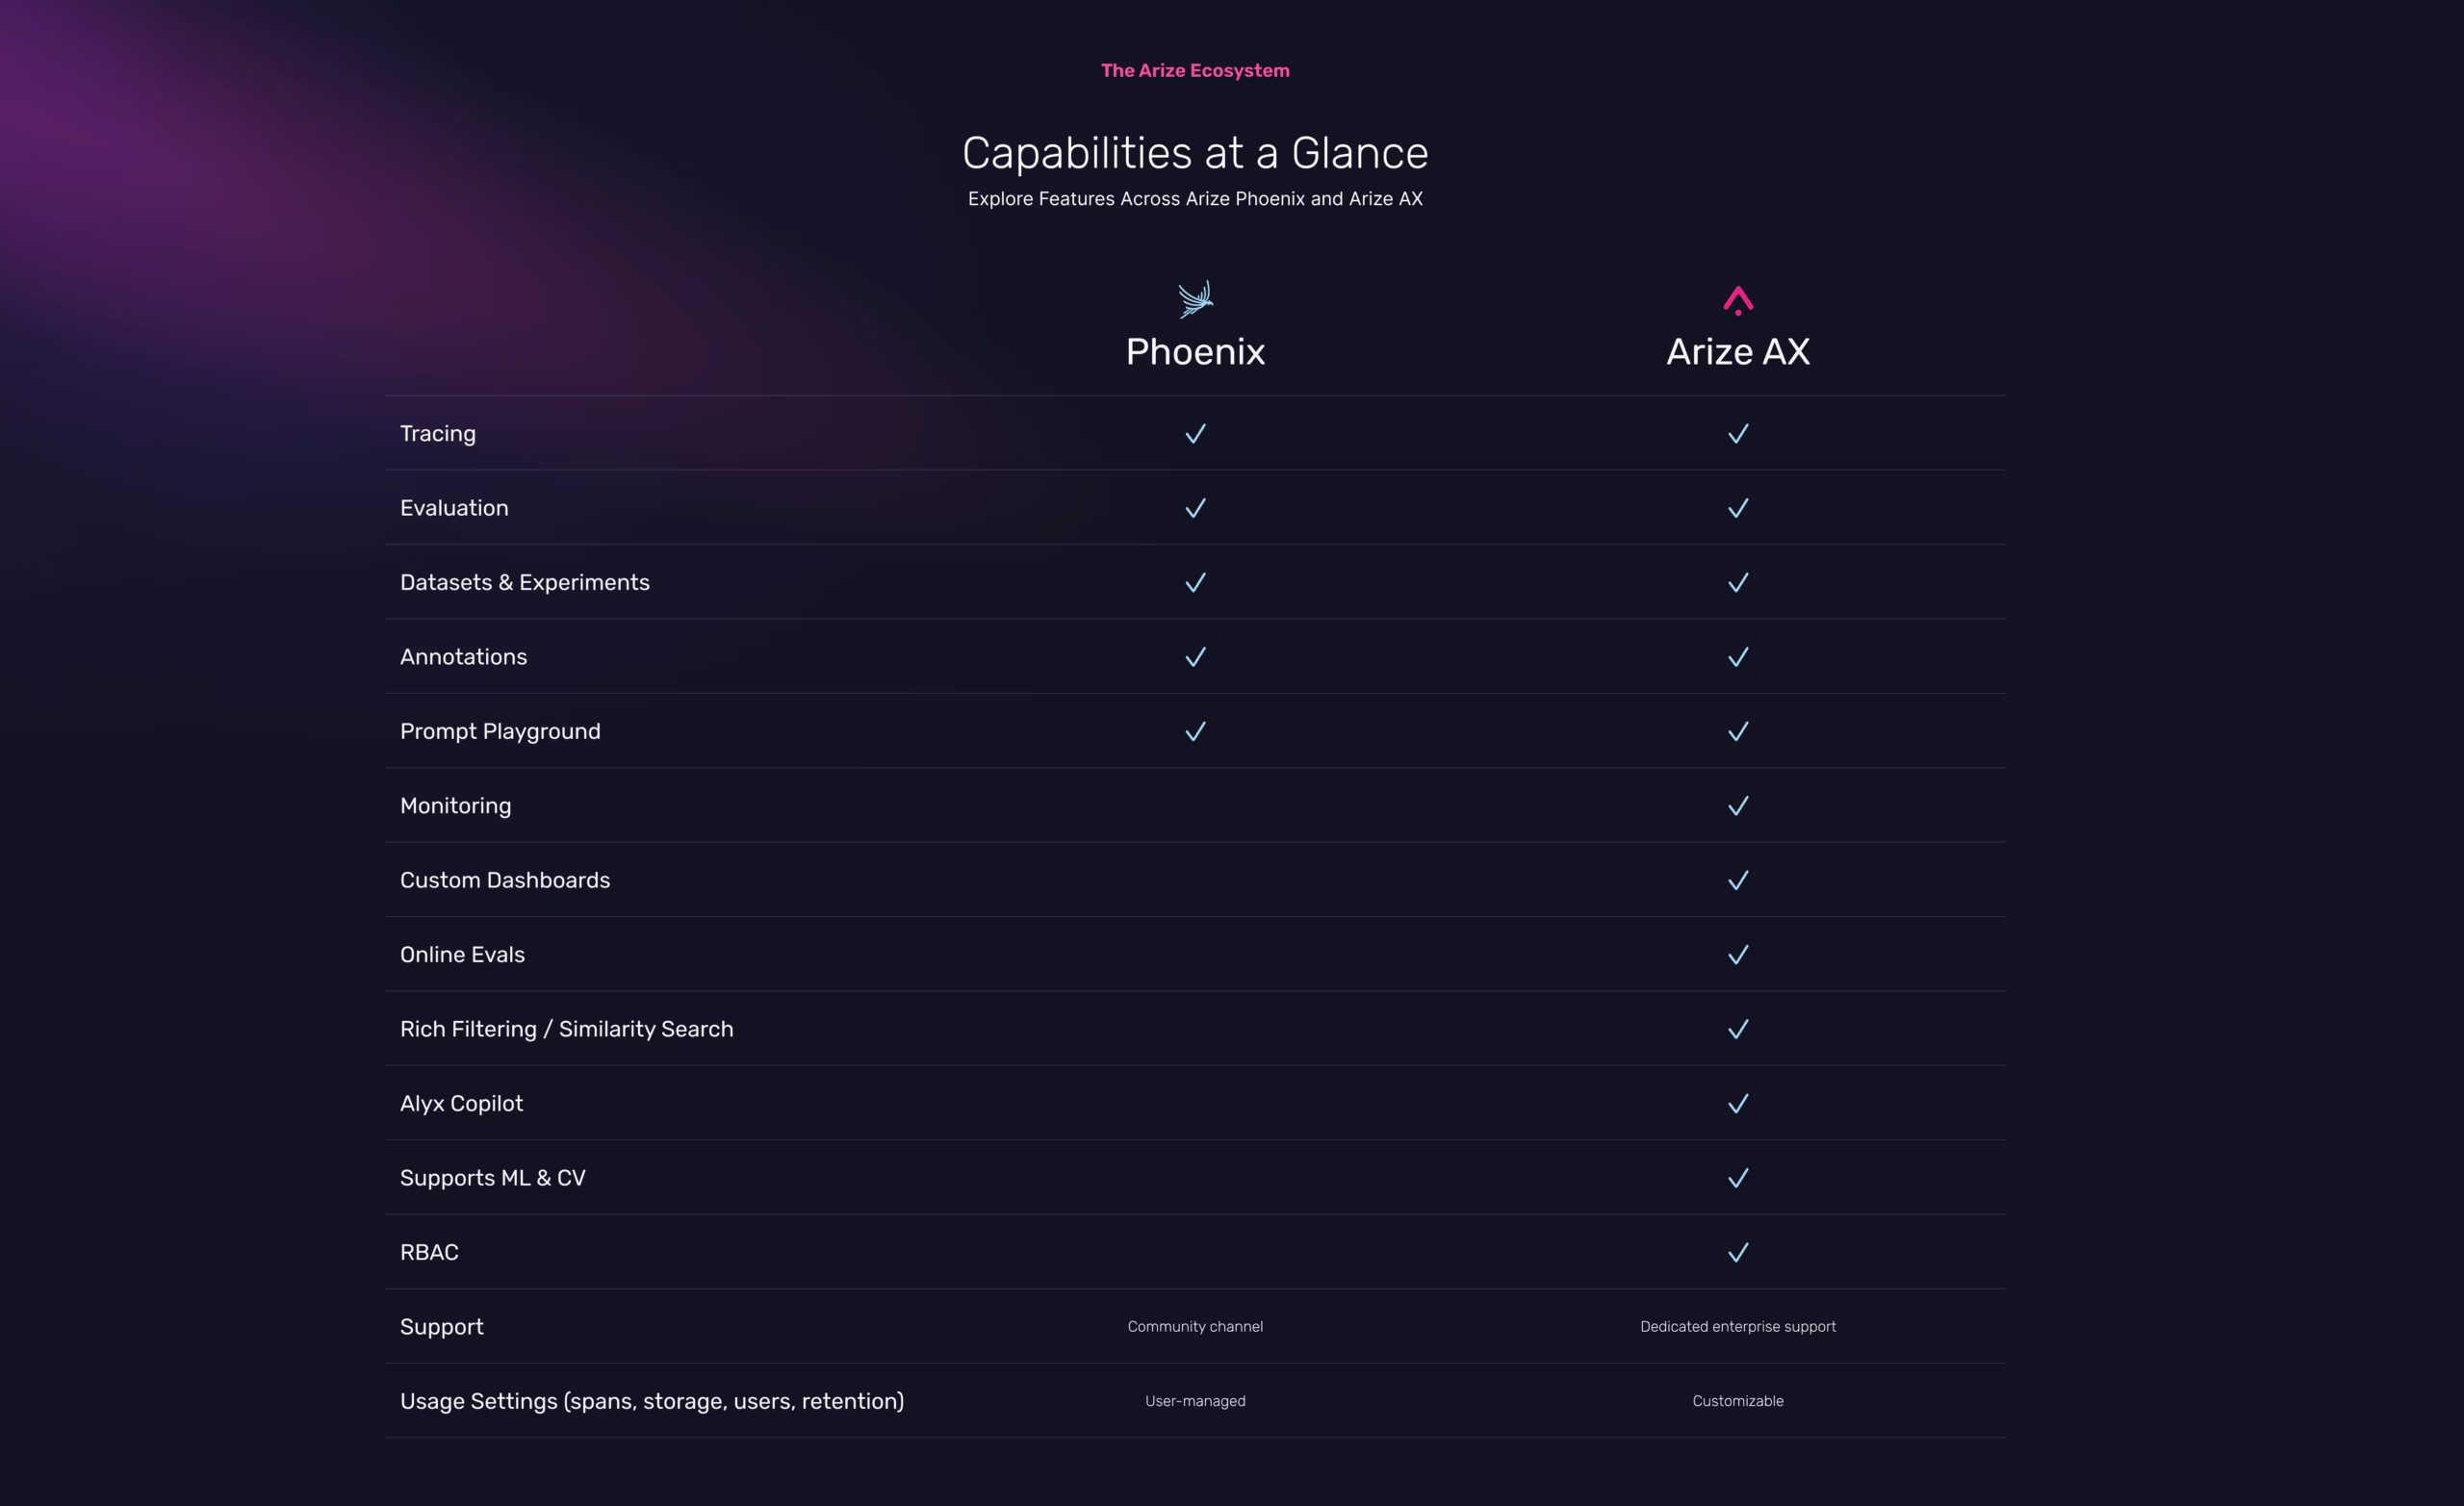
Arize AX (free signup) is built for teams swimming in data and scaling fast. This enterprise-grade observability and evaluation platform combines detailed trace ingestion, dashboards, prompt engineering tools, and agent visualization, supporting both online and offline evaluations so you can test safely before rolling out changes. With Alyx, your AI assistant inside Arize, engineers can optimize prompts, troubleshoot traces, and run semantic search, cutting down manual work and speeding up iteration.
If you need something fast and free: Arize-Phoenix is an open-source observability platform that lets teams debug, test, and iterate on agents with ease, while keeping a clear view of prompt changes, trace data, and evaluation results. You can run Phoenix on managed infrastructure or self-host, giving you flexibility.
While Arize and Phoenix offer end-to-end observability for AI agents, other tools in the industry cover parts of the stack but often come with limitations. Some platforms focus heavily on infrastructure and system metrics but lack agent-specific trace visibility. Others excel at experiment tracking or LLM evaluations but do not support live agent monitoring or debugging workflows at scale. While these tools can be helpful for targeted needs, they often require stitching together multiple systems to achieve the same depth of insight you get with dedicated LLM and agent observability platforms.