


In many ways, bias and fairness in AI are two sides of the same coin; bias is a result, fairness is an action. Bias is inherently present in the world around us and is where prejudice is put into practice (consciously or unconsciously). Fairness is the absence of prejudice or preference for an individual or group based on their characteristics. For decades, bias in machine learning has been recognized as a potential concern, but it remains a complex and challenging issue for machine learning researchers and engineers when deploying models into production.
What Is Bias in Machine Learning?
Bias in machine learning refers to systematic errors that arise during the development and application of ML algorithms, often due to the presence of discriminatory or unfair patterns in data. In these cases, the model perpetuates or amplifies biases or discrimination due to the patterns in the underlying data. When talking about bias, there are two types you should pay attention to: bias in relating to sensitive groups and bias relating to non-sensitive groups.
Let’s dissect each.
Sensitive Group Bias
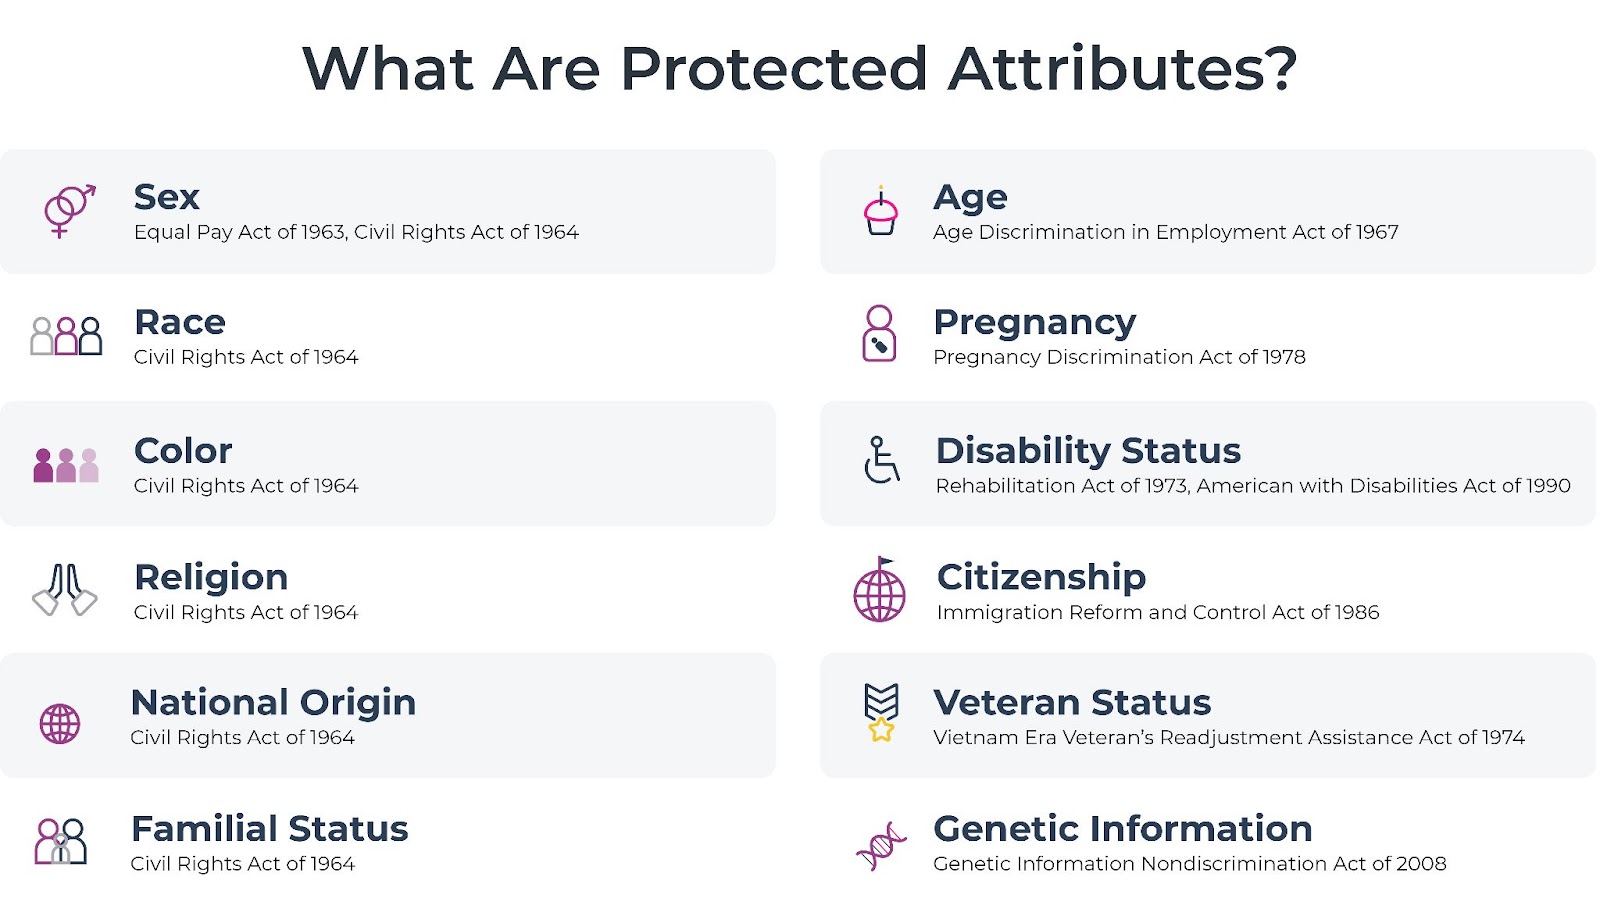
Sensitive groups in machine learning are groups of individuals who are identified by a specific characteristic that is protected by law or ethics, and may be subject to discrimination or unfair treatment. These characteristics include race, ethnicity, gender, age, religion, disability, sexual orientation, and other personal attributes.
Sensitive groups are often the focus of fairness and equity concerns in machine learning because they have historically been subjected to bias and discrimination. When building machine learning models, it is important to ensure that these groups are treated fairly and equitably, and that the models do not perpetuate or amplify biases or discrimination.
It is important to note that while sensitive groups are often the focus of fairness concerns, bias and discrimination can also occur against non-sensitive groups or individuals, and it is important to be aware of and address these concerns as well.
Non-Sensitive Group Bias
Non-sensitive groups are the features that are not protected attributes. Bias for non-sensitive groups occurs when a model consistently makes errors due to its inability to represent certain aspects of the data accurately. This can happen for various reasons, such as overfitting or underfitting, inappropriate assumptions and lack of diversity in the training data.
Addressing Bias
To address bias in machine learning models, it’s important to identify the sources of bias and take steps to mitigate them. This can involve collecting more diverse and representative training data, selecting appropriate model architectures and algorithms, and using techniques such as regularization to prevent overfitting. It’s also important to critically examine the assumptions and decisions made during the model-building process, and to involve diverse stakeholders in the development and evaluation of the model.
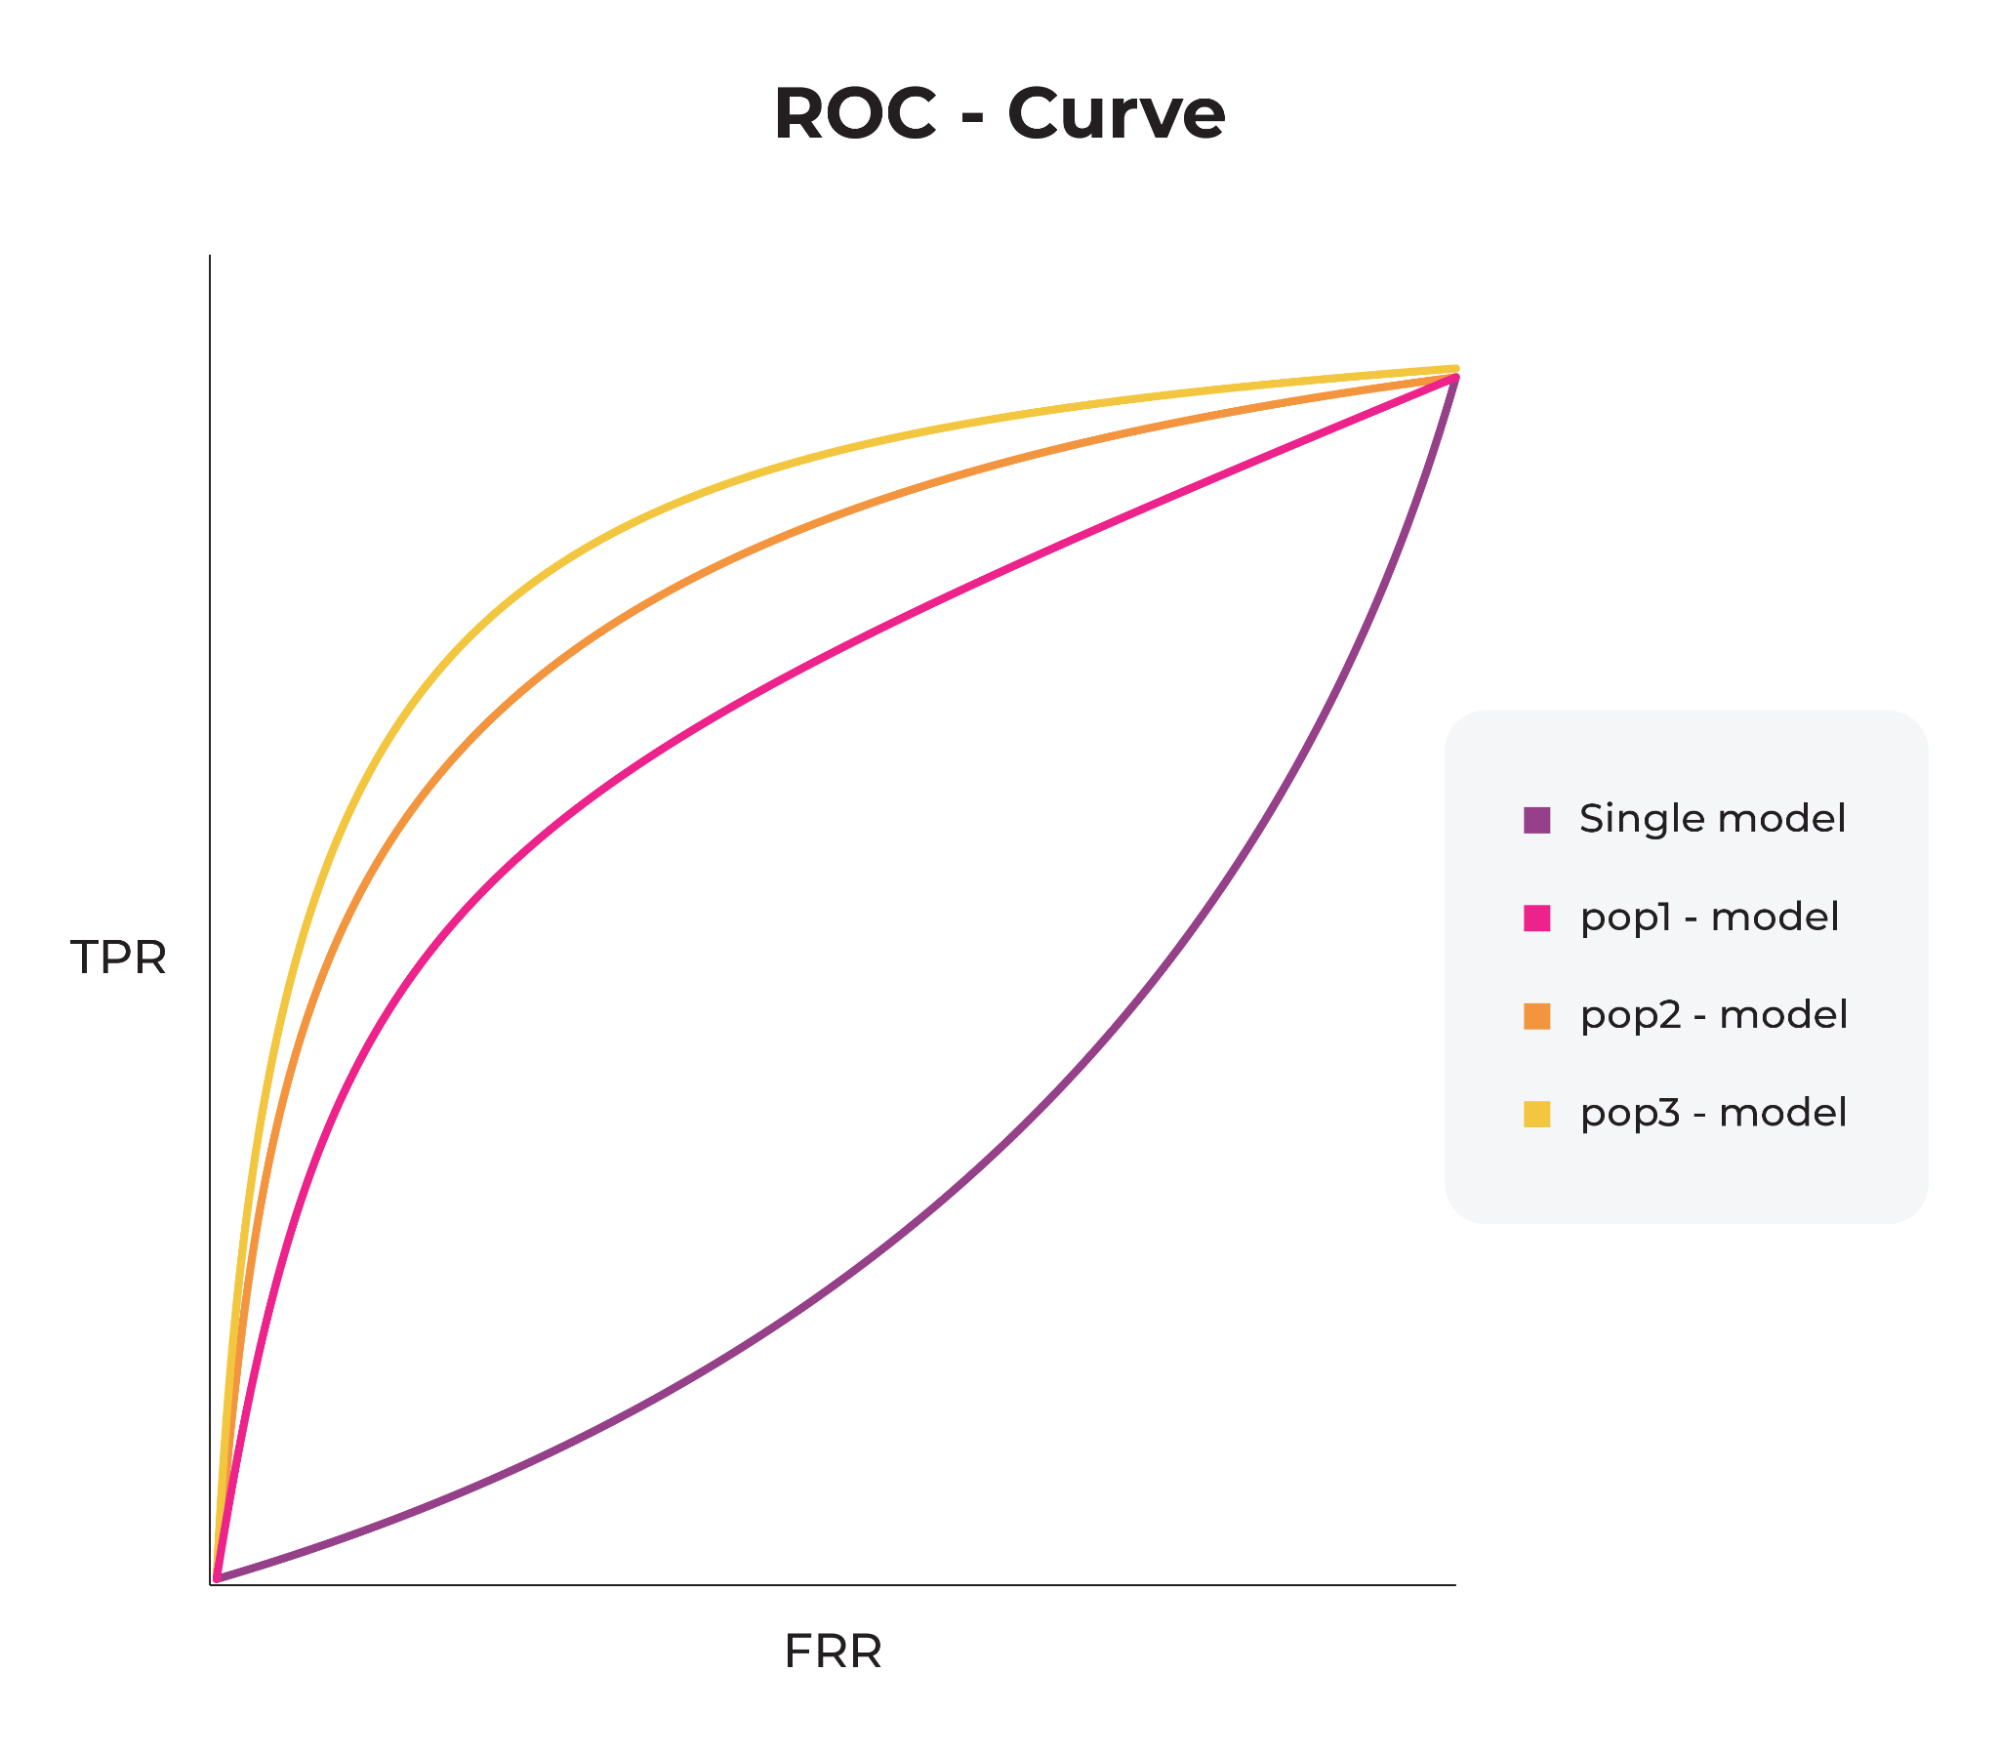
It’s important to note that data is not the only source of bias; even if we have perfect data, our modeling methods can introduce bias. For example, having a single model for all populations is bound to exhibit bias known as aggregation bias. Another example is evaluation bias, where benchmarks used for evaluation do not represent the general population.
Overall, addressing bias in machine learning is crucial for ensuring that the models we create are fair, accurate, and aligned with our values and goals. As machine learning becomes increasingly integrated into our daily lives, it’s important to remain vigilant and proactive in addressing bias and promoting ethical and responsible AI development.
Fairness Metrics
Here are several prevailing model fairness metrics.
Recall Parity Formula
Recall Parity measures whether the model has equal recall rates across different subgroups. You can interpret this as how “sensitive” the model is for one group compared to another, or the model’s ability to predict true positives correctly.
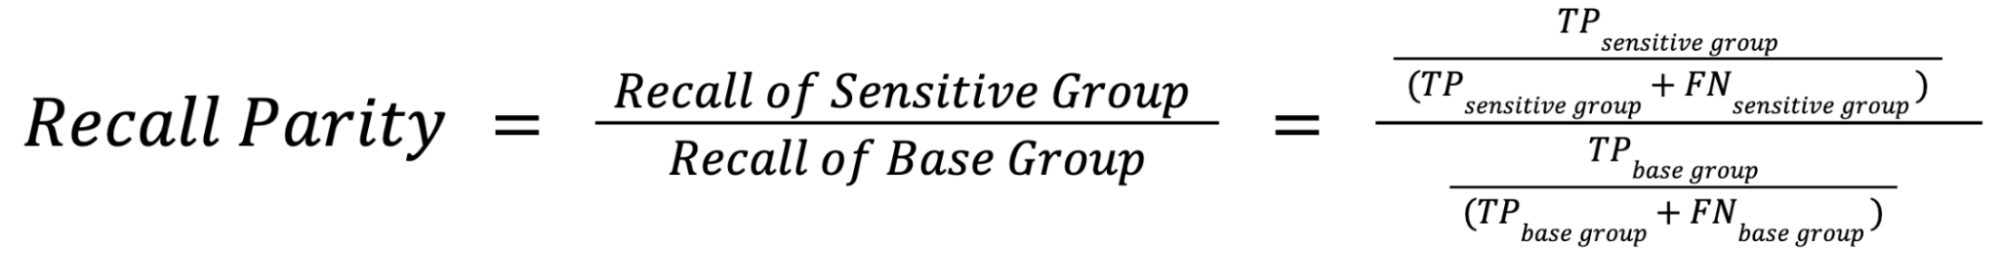
If the recall parity value is greater than 1, it indicates that one subgroup has a higher recall rate than the other subgroups. This may indicate that the model is biased towards that subgroup, or that the model performs better on that subgroup due to differences in the data distribution or feature importance.
This metric is particularly relevant when the cost of a false negative (i.e., failing to identify a positive instance) is high, such as in medical diagnoses or loan approvals. Use this metric when you want to ensure that the model is not biased in favor of or against certain subgroups.
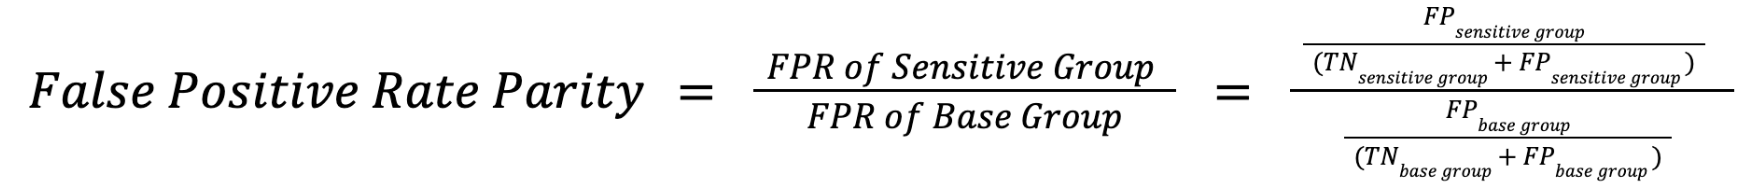
False Positive Rate Parity Formula
False positive rate parity measures whether a model incorrectly predicts the positive class for the sensitive group as compared to the base group. Ideal false positive rate parity is achieved if the false positive rates (the ratio between the number of false positives and the total number of negatives) in the subgroups are close to each other.
If the FPR Parity value is greater than 1, it would mean that the false positive rate is higher for the sensitive group compared to the base group. If the FPR Parity value is less than 1, it would mean that the false positive rate is lower for one subgroup compared to other subgroups.
This metric is particularly relevant when the cost of a false positive (i.e., incorrectly identifying a negative instance as positive) is high, such as in criminal justice or hiring decisions. Use this metric when you want to ensure that the model is not biased in favor of or against certain subgroups.
Disparate Impact Formula
Disparate impact compares the proportion of individuals that receive a positive output for two subgroups. You can interpret disparate impact as a quantitative measure of the adverse treatment of protected classes.
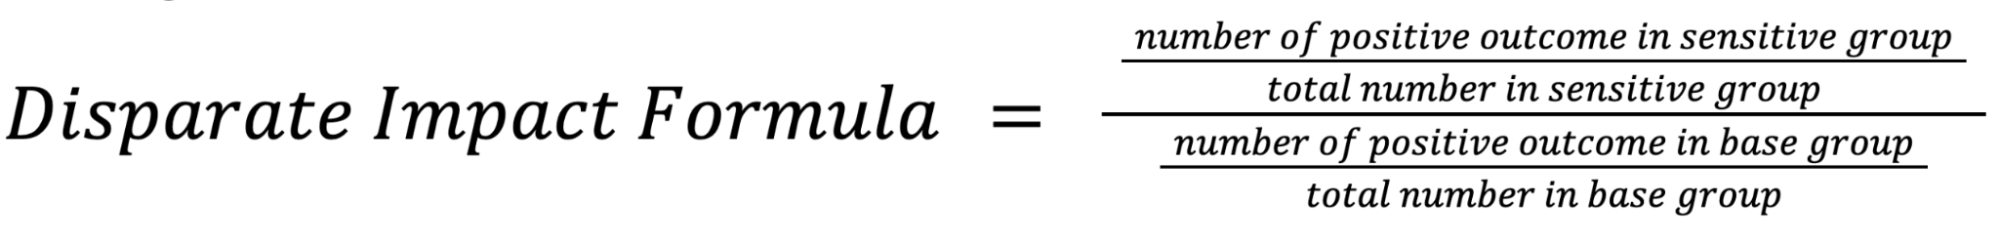
A disparate impact of 1 indicates perfect parity between different subgroups, where each subgroup is represented in the same proportion as the overall population. A value greater than 1 indicates that one subgroup is overrepresented relative to another subgroup or the overall population, while a value less than 1 indicates that one subgroup is underrepresented.
This metric is particularly relevant when the goal is to ensure that the model does not perpetuate historical discrimination or disparities. Use this metric when you want to ensure that the model does not result in unequal outcomes across different subgroups.
Choosing a Fairness Metric
The choice of fairness metric to use between recall parity, false positive rate parity, and disparate impact depends on the specific context and goals of the machine learning model being developed. When deciding on which fairness metric or metrics to use, you must think about what insights you need to ensure your model is not acting discriminately.
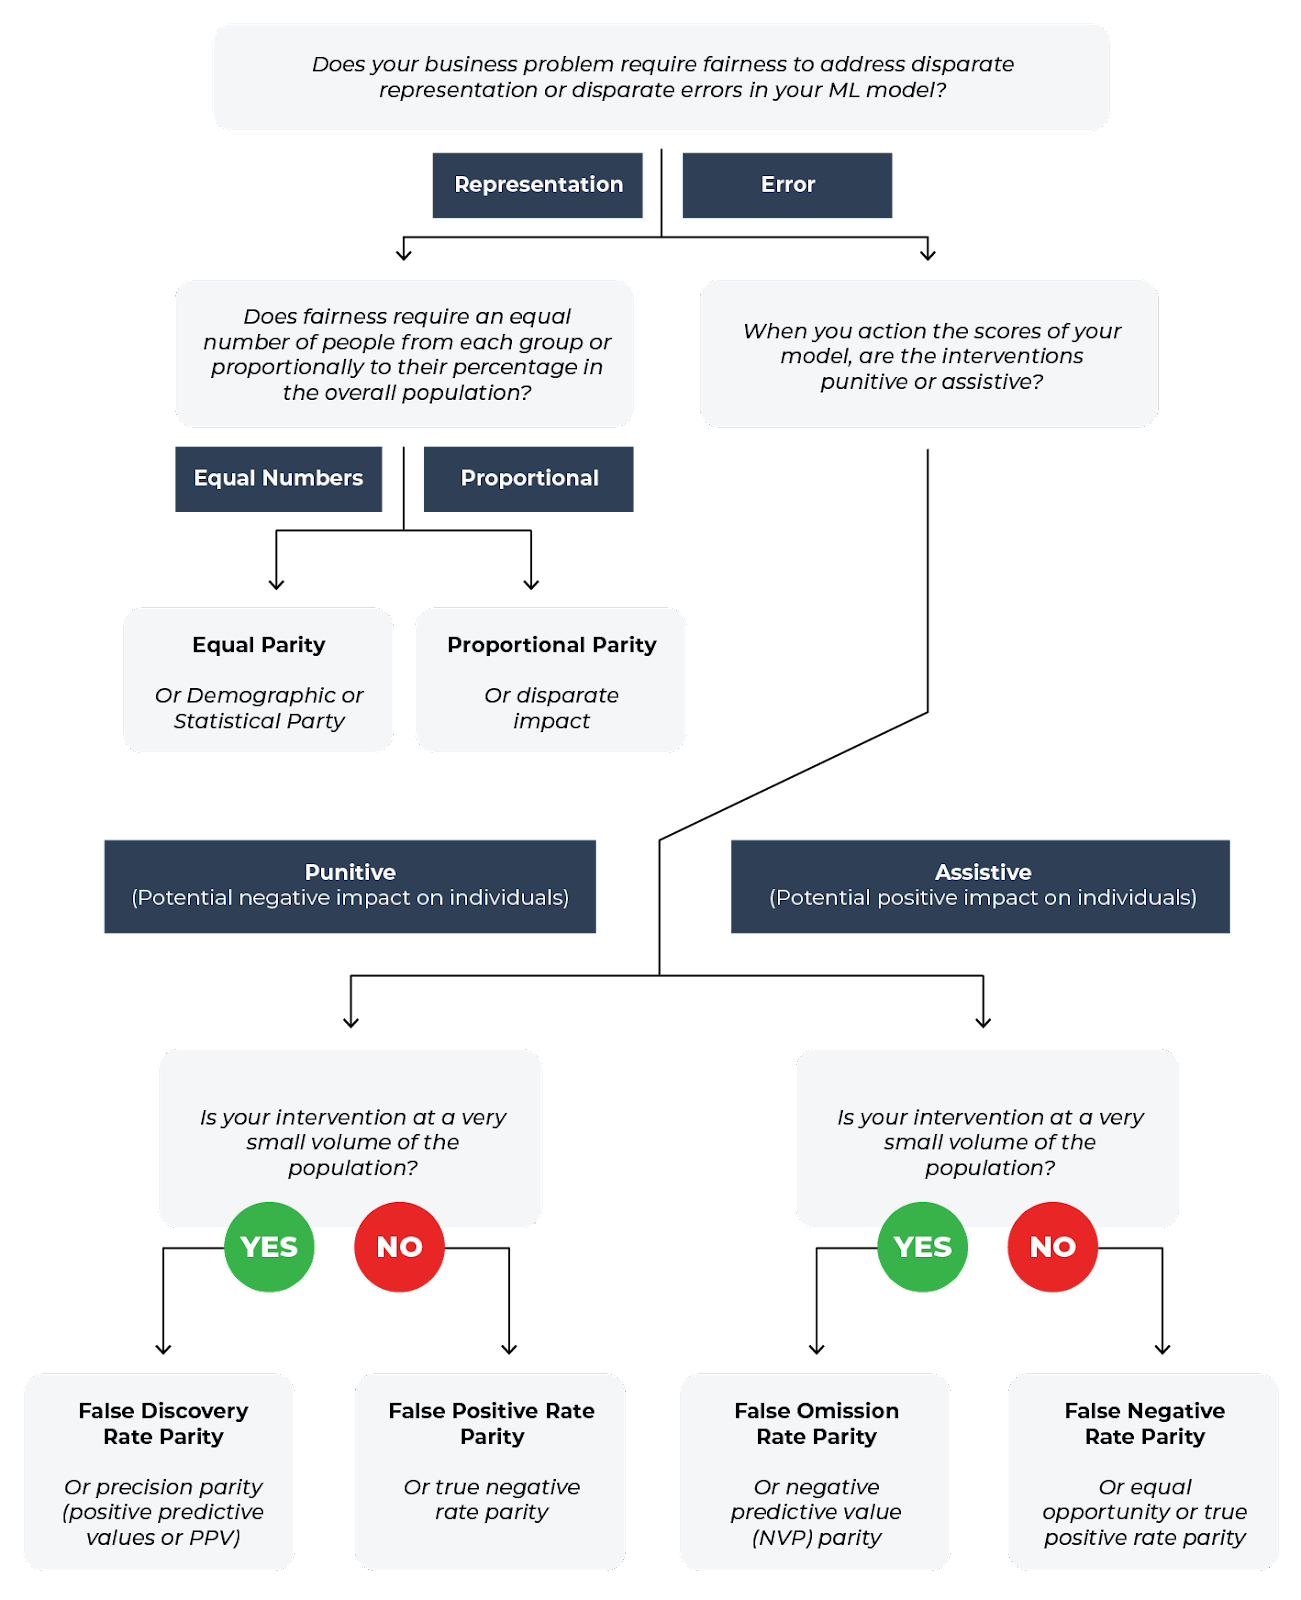
The first question at hand is to determine if your business problem requires you to address disparate representation or errors. Disparate representation refers to an uneven distribution of different groups or subpopulations in the training data used to build the ML model. If certain groups are underrepresented or overrepresented, the model’s performance may be biased, leading to unfair outcomes for these groups. For example, say you have a model used for hiring and candidate selection. The model is trained on historical data to identify and shortlist the most suitable candidates for a specific job role based on various factors, such as experience, skills, and education. Disparate representation could arise if the historical data used to train the model contains an uneven distribution of candidates from different demographic groups, such as gender, race, or age.
Disparate errors occur when an ML model’s performance – such as accuracy, precision, recall – vary significantly across different groups or sub-populations. This can lead to biased outcomes with the model performing better for some groups and worse for others. For example, disparate errors could occur with a financial institution using a machine learning model for credit risk assessment. The model is trained to predict the likelihood of a borrower defaulting on their loan based on various factors, such as credit score, income, race, and employment history.
Once you determine if you want to focus on representation or error, you can continue on considering the questions in the context of your business problem to determine which metric to use. This is just one example of how to choose a metric, but overall, you want to consider the specific context and goals of the machine learning model being developed.
Assessing Bias for Non-Sensitive Groups
Bias can exist in machine learning models for features that are not legally or traditionally considered sensitive groups but nonetheless might be underrepresented or worth paying attention to.
In these cases, fairness metrics are not the only tool used to assess bias:
- Data analysis: Examine the distribution of the data for the feature in question. Are there any trends or patterns that suggest bias, such as certain groups being overrepresented or underrepresented? If so, you may need to take steps to correct for this in your model.
- Model evaluation: Evaluate your model’s performance on different subgroups based on the feature in question. For example, if you are using the age of a car as a feature, you could evaluate the model’s performance on cars of different ages. If you see significant differences in performance between subgroups, this may indicate bias.
- Human review: Finally, consider having human experts review your model and its output to identify any potential sources of bias. This can be especially useful for features that may not be immediately apparent as sensitive groups but could still introduce bias into your model.
Evaluation Thresholds
Sensitive Groups
The industry standard for evaluating fairness metric values is the four-fifths rule. The four-fifths rule is a threshold that is used by regulatory agencies like the United States Equal Employment Opportunity Commission to help in identifying adverse treatment of protected classes. Since an ideal parity score is 1, when leveraging the four-fifths rule you typically measure whether your fairness metric score falls outside of the 0.8-1.25 threshold.
Non-Sensitive Groups
The threshold you should use for a fairness metric depends on a few factors, including the specific metric you are using and the context of your application. In general, there is no one-size-fits-all answer to this question, and you will need to determine the appropriate threshold based on your specific needs and goals.
Here are some general guidelines to consider:
- Determine the unacceptable level of disparity: Depending on the context of your application, you may have a specific threshold for acceptable levels of disparity between different subgroups. For example, you may decide that a disparity ratio of less than 0.8 (80%) is acceptable for a particular metric. This threshold should be based on careful consideration of the potential impact of bias on different subgroups and any legal or ethical requirements that apply to your application.
- Consider trade-offs: Keep in mind that there may be trade-offs between fairness and other performance metrics, such as accuracy or precision. A lower threshold for fairness may result in reduced performance on other metrics. Consider the trade-offs carefully and choose a threshold that balances fairness with other important considerations.
- Evaluate multiple thresholds: You may need to evaluate multiple thresholds to determine the appropriate level of fairness for your application. This can involve testing your model with different thresholds and comparing the results to determine which threshold provides the best balance of fairness and performance.
Overall, the threshold you choose should be based on a careful evaluation of the potential impact of bias on different subgroups and a thorough understanding of the trade-offs involved in achieving fairness in your model.
Take Action
For a deep dive into fairness metrics, check out the relevant section of the Arize advanced course. To see how Arize can help you monitor fairness metrics for your models in production, sign up for a free Arize account.