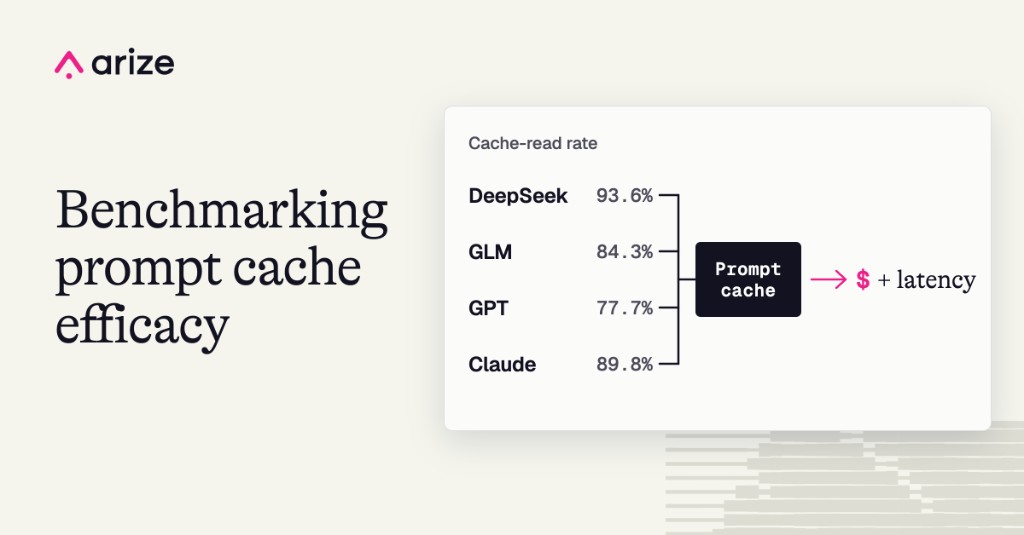
Prompt caching lets an agent reuse previously processed prompt tokens instead of processing the same input again. For multi-turn agents that repeatedly carry forward instructions, application context, or conversation history, that reuse can reduce the cost of repeated input.
In our benchmark, DeepSeek had the highest cache-read rate at 93.6% and the lowest Phoenix-estimated cost. Across all four models, cache reuse increased as conversations got longer. The key finding was that a high cache-read rate did not always mean lower cost: Claude reused 89.8% of prompt tokens and still had the highest estimated cost because output tokens drove most of the spend.
Want to benchmark agents with Harbor in Phoenix?
Harbor is a framework for evaluating agents in sandboxed environments, and you can now use it with Phoenix to run benchmarks, capture traces, and compare experiments. Learn how to use Harbor with Phoenix.
Build better agents with Arize
Trace, evaluate, and learn. Build agents that work with Arize AX and start tracing your runs today.
Prefer open source? Try Arize Phoenix for self-hosted, open source agent observability.

How we benchmarked prompt caching across models with Harbor and Arize Phoenix
We wanted the experiment to be as realistic as we could make it, including multi-turn conversations and repeated product context. An e-commerce shopping assistant felt like a natural fit: shoppers ask follow-up questions and narrow down their choices, so the assistant needs to carry context forward across turns.
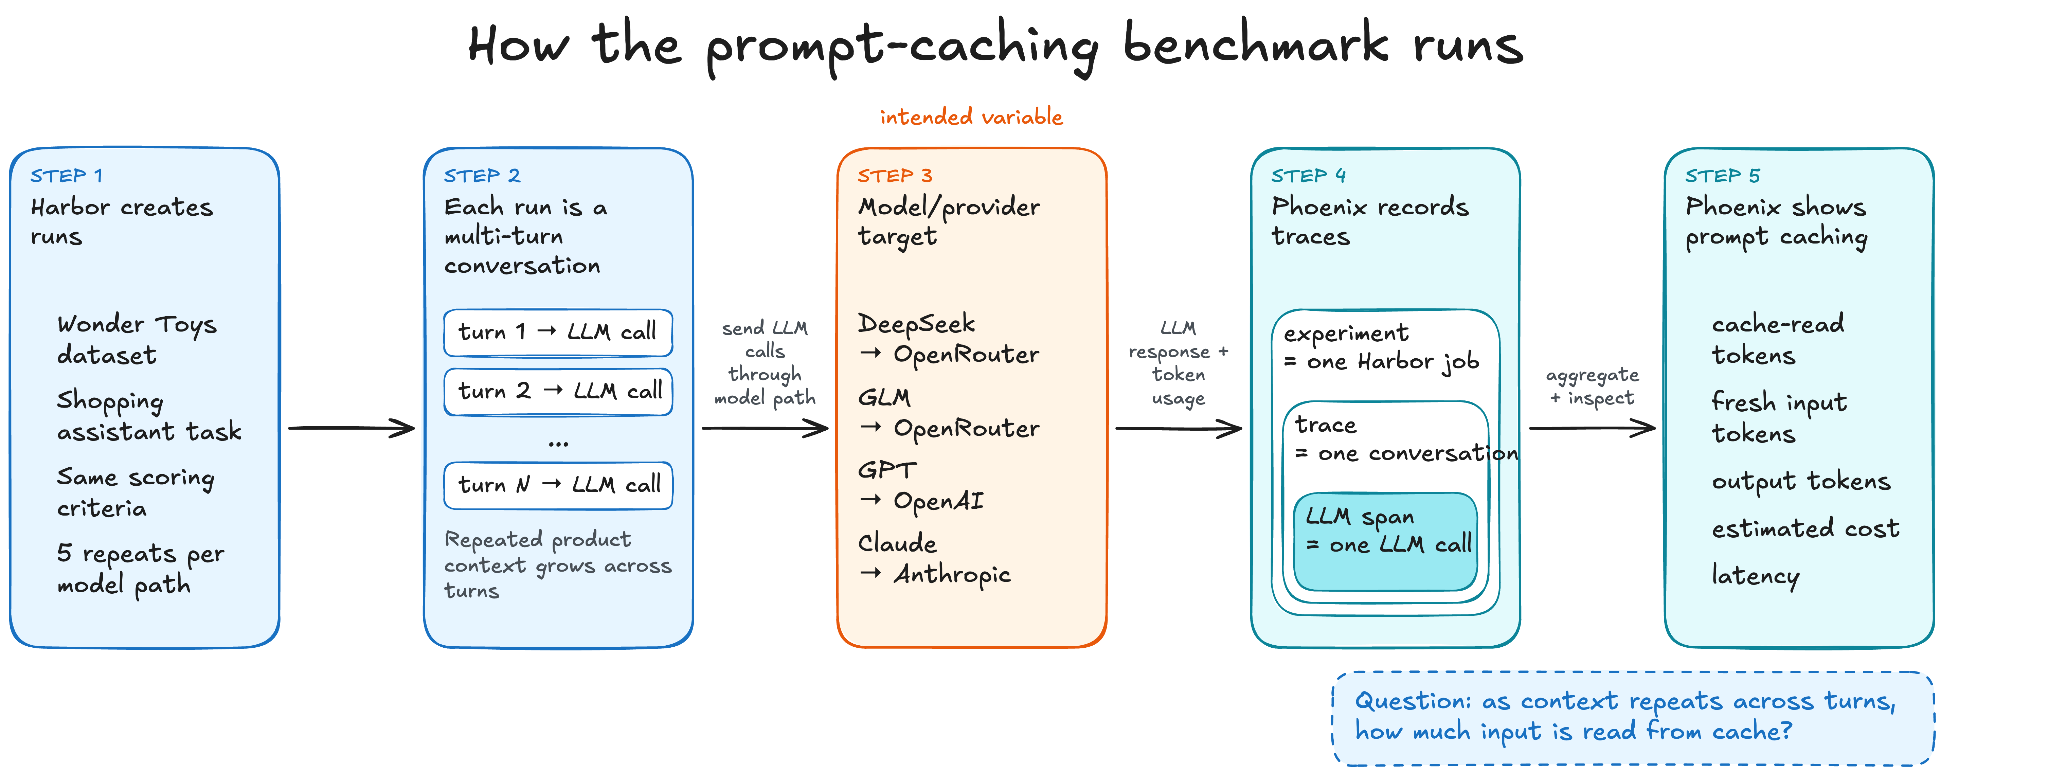
For this benchmark, we used a Wonder Toys shopping assistant and a dataset of 20 multi-turn conversations. We tested conversations from 5 to 20 turns to see how cache reuse changed as the assistant accumulated more history. Each of the 20 conversations was run five times per model/provider path, for 100 conversation traces per model. The results below aggregate cache reuse, estimated cost, and trace duration across those traces.
We used Harbor to run the shopping-assistant tasks across all four models. We kept the product catalog, task instructions, conversation dataset, and evaluation criteria constant while changing the model and provider. The Phoenix Harbor plugin recorded the jobs as versioned datasets and experiments and sent their traces to Phoenix.
The provider path was part of the benchmark setup: DeepSeek and GLM ran through OpenRouter, GPT ran through OpenAI directly, and Claude ran through Anthropic directly. Each path used the provider’s supported caching mechanism. Because the model and provider path changed together, these results compare the observed behavior of each model/provider path rather than isolating model caching efficiency on its own.
In Phoenix, we compared cache usage, estimated cost, and latency, then inspected individual LLM calls within each conversation. Cache usage came from the token counts reported by each provider and captured in the LLM spans sent to Phoenix. Phoenix displayed those counts and estimated costs using token prices from each provider’s pricing page, letting us see how much input was reused and where the spend came from.
Throughout this benchmark, cost refers to these Phoenix estimates, which we used to compare runs. We did not reconcile them against actual provider bills.
Prompt caching benchmark results: cache reuse, cost, and latency
DeepSeek had the highest cache-read rate at 93.6%, followed by Claude at 89.8%, GLM at 84.3%, and GPT at 77.7%.
DeepSeek also had the lowest Phoenix-estimated total cost across 100 runs, at $1.17, and the shortest average trace latency at 34.7 seconds among the four model/provider paths tested. Those results do not establish that caching alone caused either advantage.
| Model | Prompt tokens read from cache | Estimated total cost, 100 runs | Average trace latency |
|---|---|---|---|
| DeepSeek V4 Pro 0813 | 93.6% | $1.17 | 34.7s |
| GLM 5.3 Prime | 84.3% | $4.49 | 91.4s |
| GPT-6.1 Sol | 77.7% | $2.74 | 55.6s |
| Claude Opus 5.5 | 89.8% | $14.63 | 81.2s |
How conversation length affected prompt cache reuse
The first thing we wanted to check was whether cache reuse actually increased as conversations got longer. It should: later turns carry forward more of the product catalog, task instructions, and conversation history, so the provider has more repeated input it can potentially reuse.
That pattern showed up across all four models. GPT had the biggest swing, going from 34.2% cache read at 5 turns to 87.0% at 20 turns. DeepSeek started much higher, at 85.7%, and reached 95.6% at 20 turns.
We tested different conversation lengths to see what the overall averages missed: GPT’s cache-read rate was much lower in short conversations, while DeepSeek’s was already high at five turns.
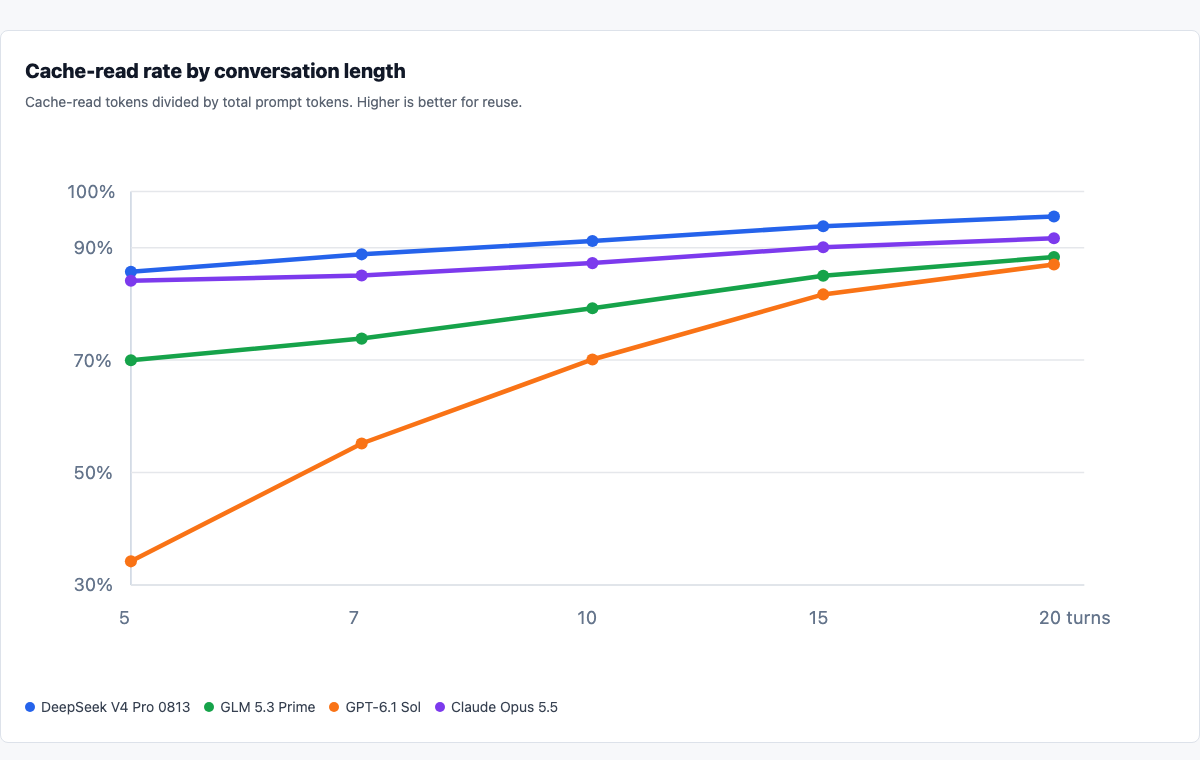
| Model | 5 turns | 7 turns | 10 turns | 15 turns | 20 turns |
|---|---|---|---|---|---|
| DeepSeek V4 Pro 0813 | 85.7% | 88.8% | 91.2% | 93.8% | 95.6% |
| GLM 5.3 Prime | 70.0% | 73.8% | 79.2% | 85.0% | 88.3% |
| GPT-6.1 Sol | 34.2% | 55.2% | 70.1% | 81.7% | 87.0% |
| Claude Opus 5.5 | 84.1% | 85.1% | 87.3% | 90.1% | 91.7% |
If your agent typically has short conversations, the 5-turn results may be more relevant than the aggregate ranking. If your agent usually stays in a long thread, the later-turn behavior may matter more.
Why higher cache reuse did not guarantee lower estimated cost
The second thing we looked at was cost. Cache-read rate tells you how much prompt input was reused, but it does not tell you the whole cost story.
Claude read 89.8% of its prompt tokens from cache, yet its estimated total cost was $14.63, the highest in the test. Output accounted for most of that estimated spend. GPT had a lower cache-read rate than GLM, but its estimated total cost was also lower: $2.74 versus $4.49.
The reason is that output volume and token pricing still matter. GPT generated 157,314 completion tokens across the runs, compared with GLM’s 725,047. So when you’re comparing costs, a cache-read percentage only answers part of the question. You also need to look at completion tokens and the prices used to calculate the estimate.
How to inspect prompt caching in Phoenix at the span level
The third thing we wanted was visibility. Aggregate numbers are useful, but they are not enough when you are trying to understand whether prompt caching is actually working.
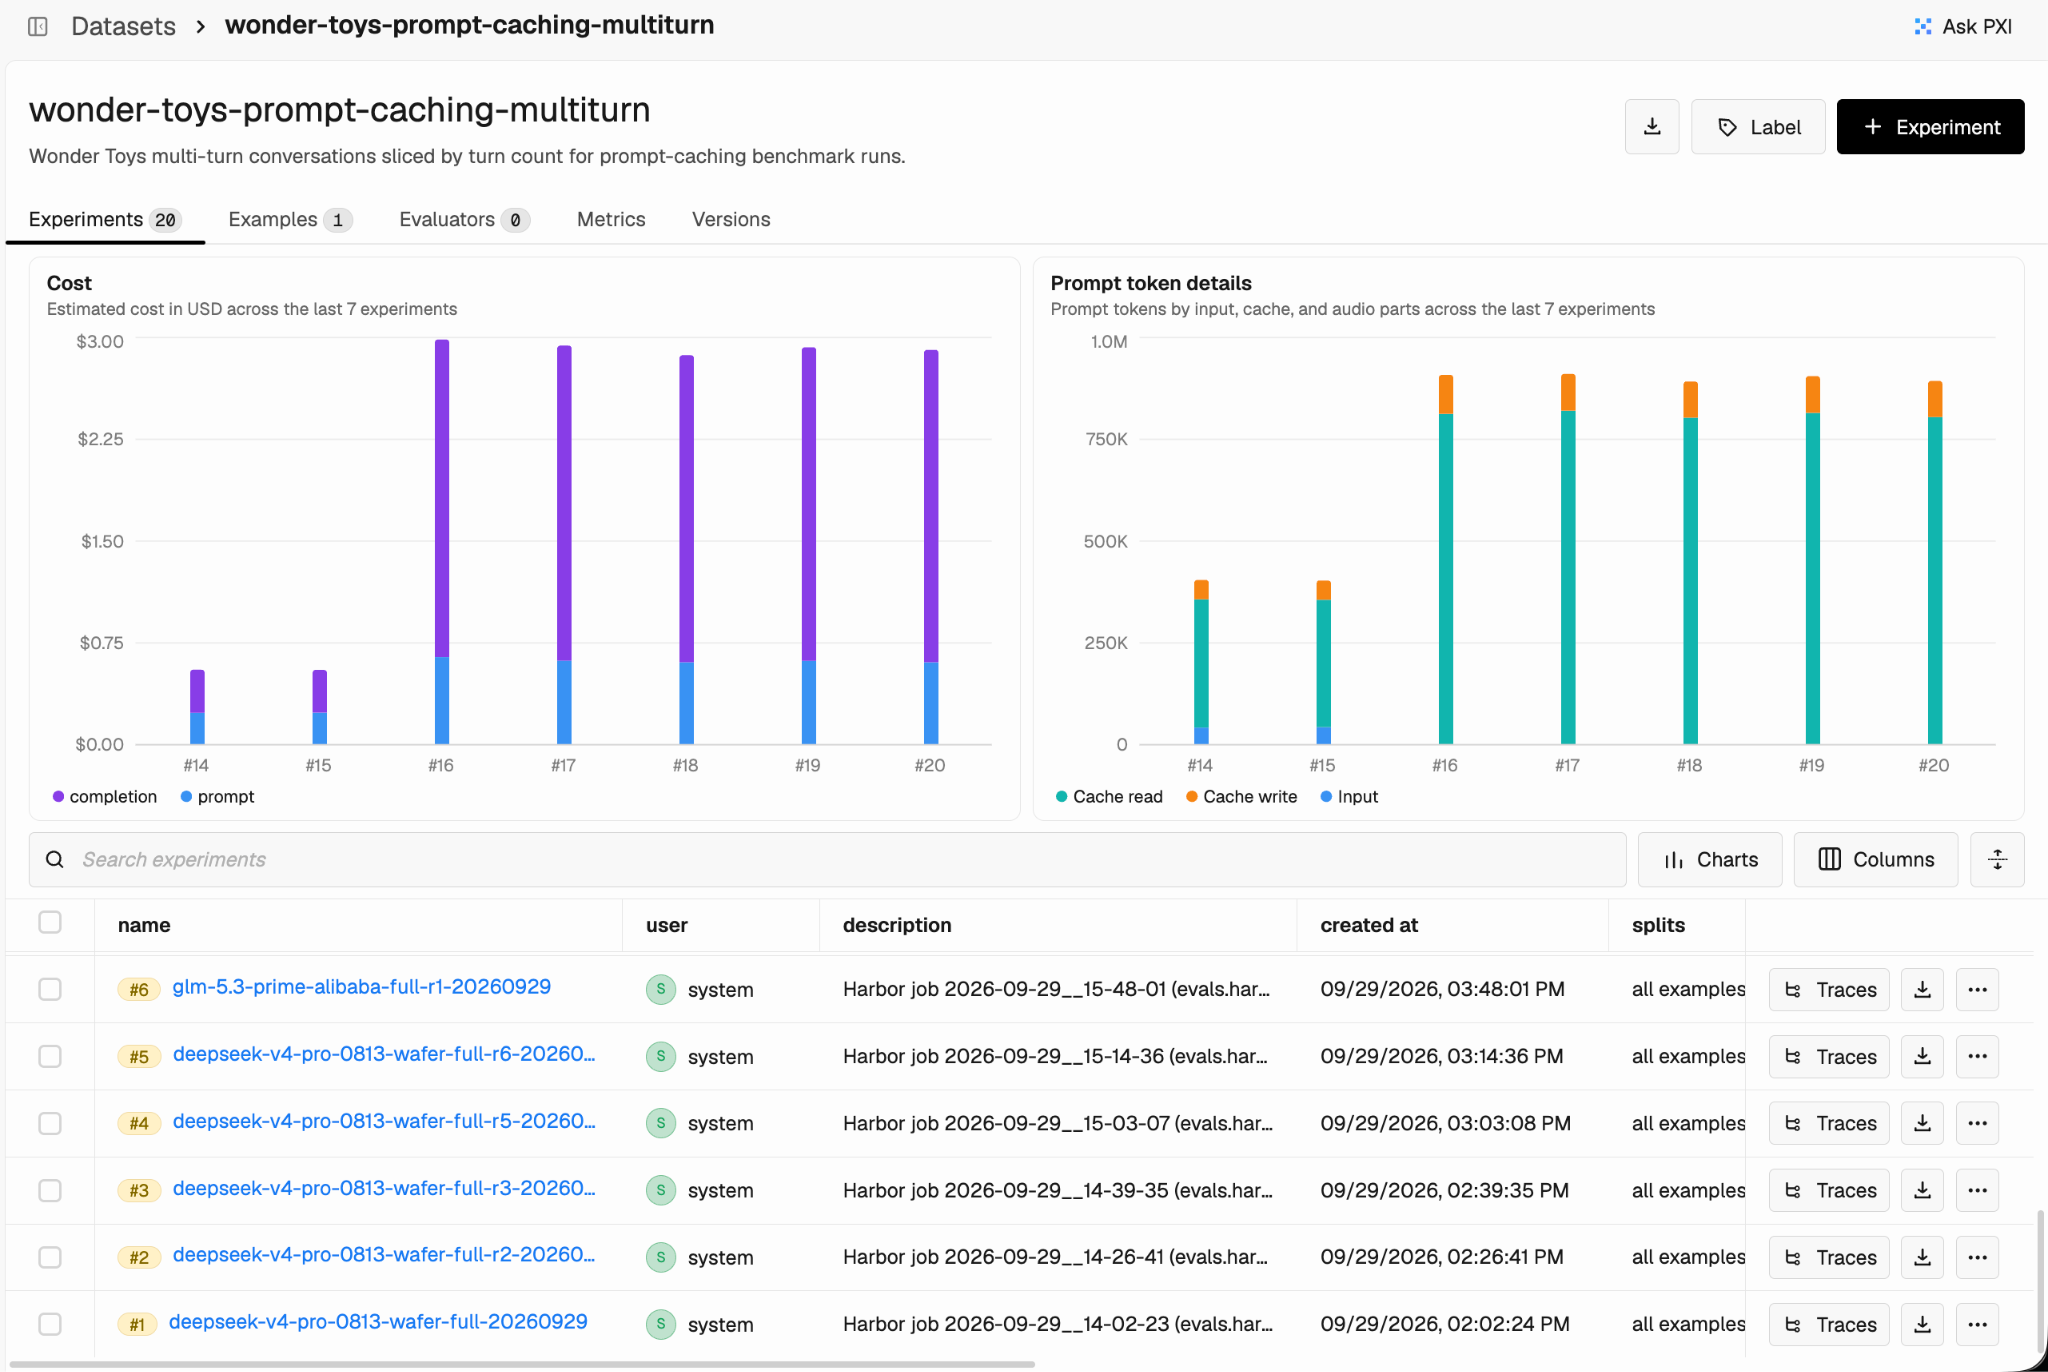
Phoenix gave us two views of the same benchmark. The dataset experiments page showed the aggregate comparison across Harbor runs: cache usage, estimated cost, and latency. The trace view lets us open a single multi-turn run and inspect the LLM spans inside each turn.
And the experiment charts showed how cache reuse differed across models and conversation lengths. To understand the cost behind those results, we opened individual traces and inspected the token and cost breakdown for each LLM call.
Compare prompt caching across experiments
The experiment view is useful when you want to compare model/provider paths side by side and see whether one path has a different cost or cache pattern across the same Harbor runs.
Inspect prompt caching in individual traces
The trace view shows each conversation as a trace with one LLM span for every model call.
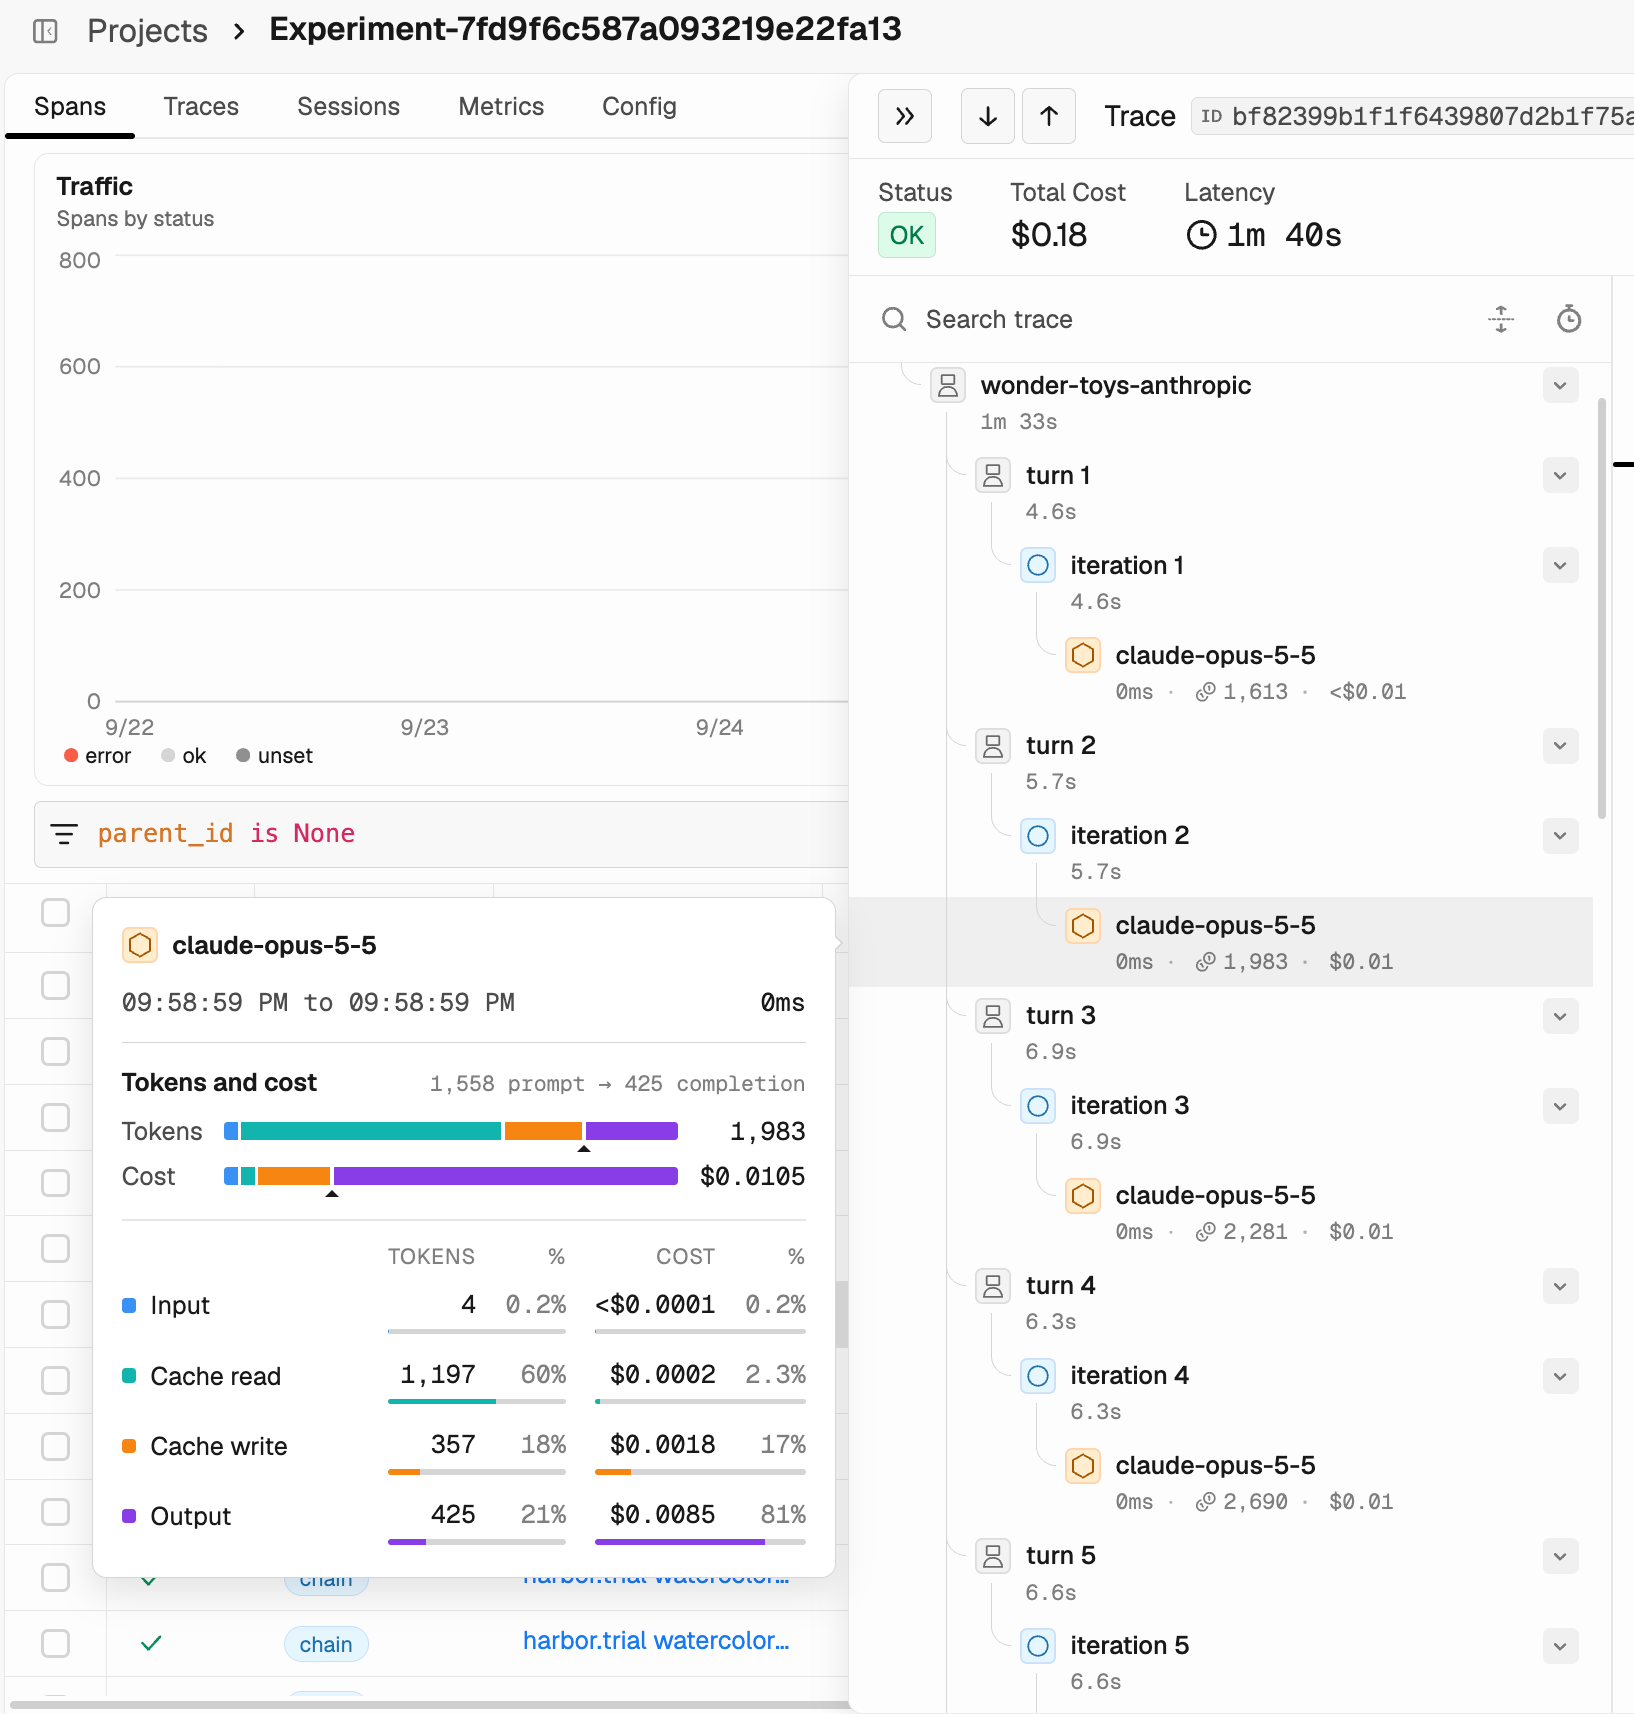
You can use that breakdown to ask whether a call mostly processed uncached input or read existing context from cache. You can also see whether its estimated cost came mainly from input or output.
For example, the Claude call shown in the hover card had 60% of its total tokens classified as cache reads, but output accounted for 81% of its estimated cost. That gives us a concrete example of why substantial input reuse can coexist with cost dominated by output.
This lets a team validate prompt caching while debugging traces, rather than inferring it later from aggregate spend.
How to measure prompt caching on your own workload
Prompt caching behavior depends on the workload, so measure it on the conversations your agent actually runs.
- Use Harbor to keep the task, dataset, and repeated runs fixed.
- Use Phoenix experiment charts to compare cache-read rate, estimated cost, and latency across runs.
- Inspect individual LLM spans to see whether a call reused cached context or processed fresh input.
- Compare cache reuse with output volume and task quality before changing models or provider paths.
These results are specific to this workload and these model/provider paths. Once cache reuse, cost, latency, and output volume are visible together, teams can compare those paths against their own agent workloads and determine which configuration is actually efficient for them.

