

AI observability tools help developers understand how AI applications behave, identify failures, measure quality, and verify that changes improve performance.
Here’s what matters when evaluating them:
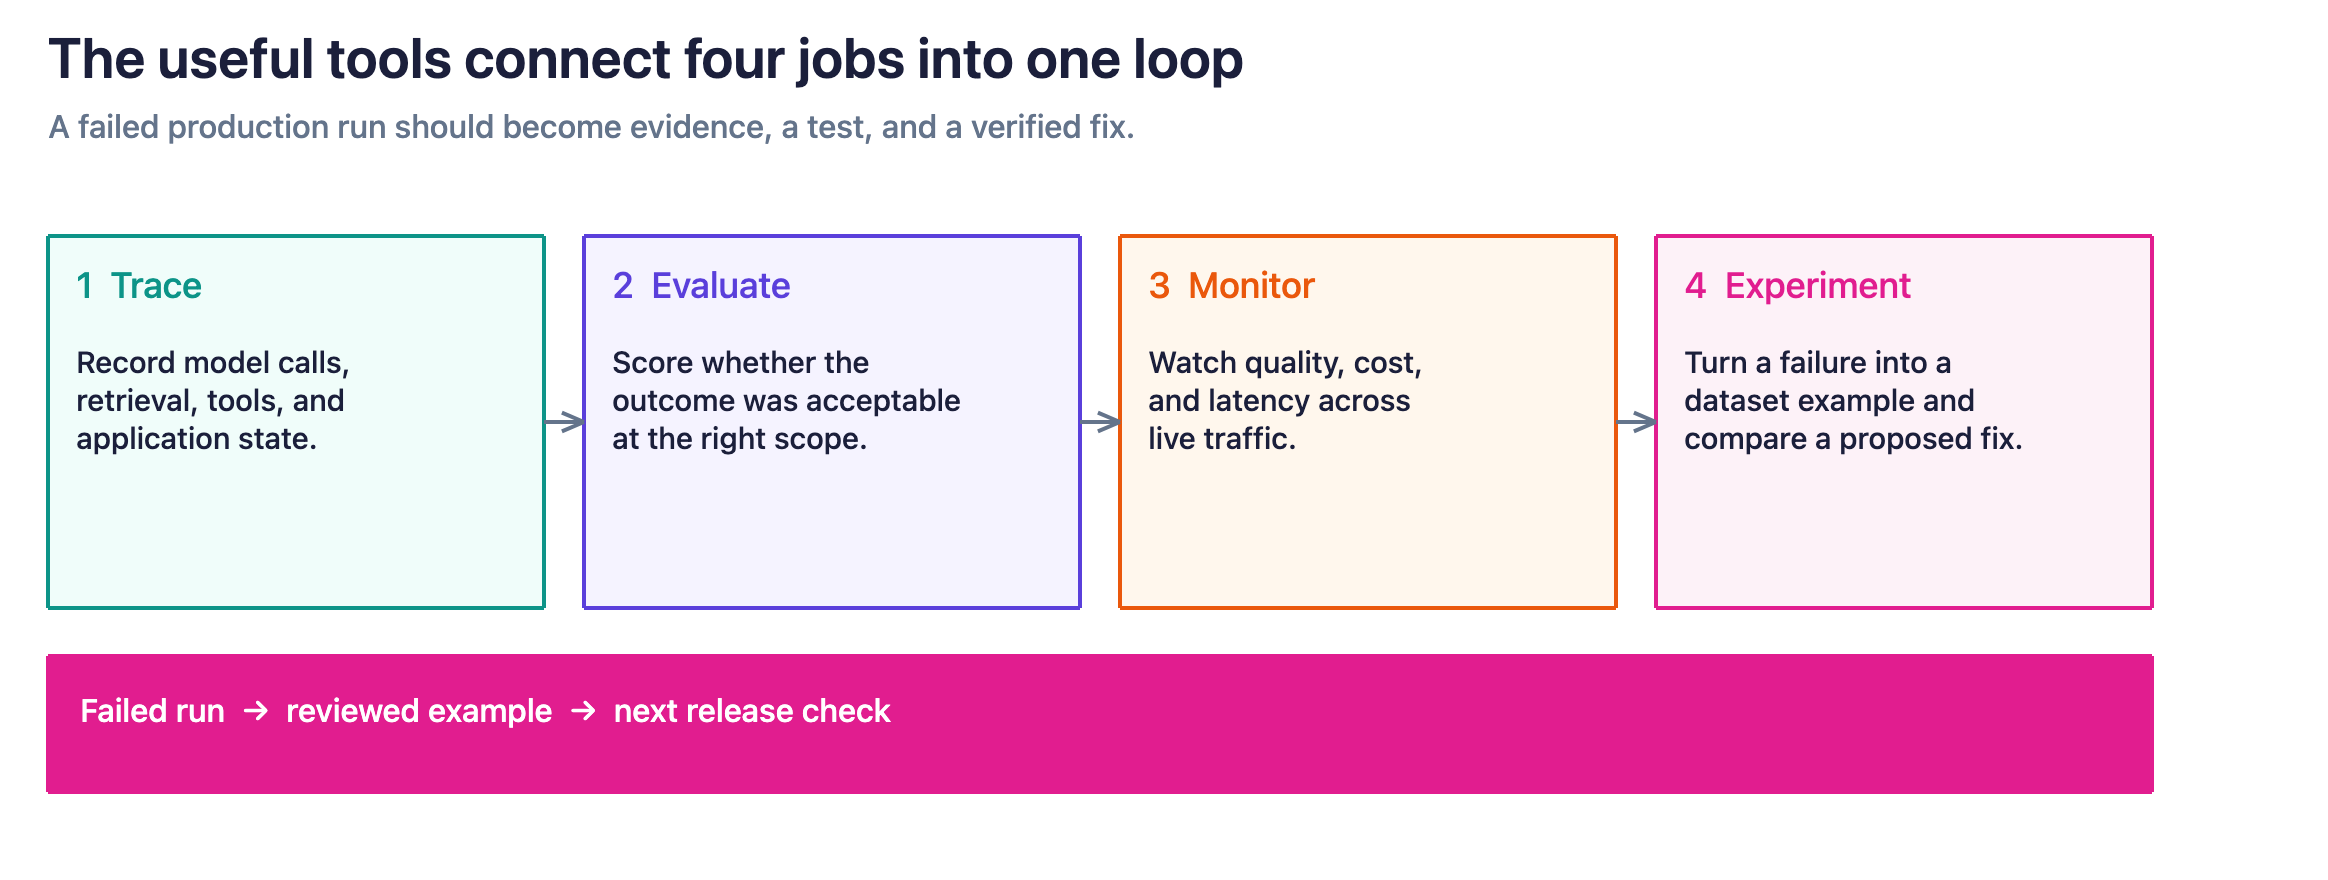
- Core capabilities: AI observability platforms combine tracing, evaluation, monitoring, and experimentation to help teams move from identifying a production failure to testing and verifying a fix.
- What they should capture: Look for visibility into model calls, retrieved context, tool execution, application state, and task outcomes. OpenTelemetry and OpenInference can help make instrumentation portable across platforms.
- How to evaluate tools: Test whether a platform can reconstruct a failed run, evaluate its behavior, identify related failures, and turn the example into a reproducible regression test.
- What separates platforms: Consider evaluation coverage, automated investigation, deployment options, data portability, and how easily developers can move between traces, datasets, and experiments.
- Cost and scalability: Compare pricing at expected production volume, accounting for traces, spans, evaluations, retention, and the engineering effort required to operate the platform.
An AI application can meet its latency target, return a successful HTTP response, and still fail the user. A support assistant might answer a question using an outdated policy, or an agent might confirm a shipping-address change after updating the billing address instead. In both cases, the infrastructure is working as expected, but the application has produced the wrong outcome.
AI observability tools help developers understand why these failures happen. They tie model calls, retrieval, tools, and application state to evaluations (was this outcome acceptable?) and production monitoring (is this failure recurring?).
The most useful tools also connect those signals to the development process. Engineers can investigate a failed run, reproduce the behavior, compare a proposed fix, and verify that the next release handles the task correctly.
This guide explains what AI observability tools do, how they fit into an application stack, and how to evaluate their tracing, evaluation, monitoring, and experimentation capabilities. If you’re building agents specifically, our guide to agent observability covers implementation and debugging in greater depth. If you’re ready to compare individual products, see our comparison of the best AI observability tools for agents.
What are AI observability tools?
AI observability tools are software platforms and libraries that help developers trace, evaluate, and monitor the behavior of AI systems. They collect evidence about model execution, application behavior, and task outcomes so teams can diagnose failures, measure quality, and determine whether changes improve performance.
The category includes tools for predictive machine learning, LLM applications, and AI agents, although the data and workflows involved can differ significantly. Many teams standardize on shared tracing for LLMs and agents; predictive ML often still relies on batch-oriented model monitoring and drift dashboards.
For predictive machine learning, observability often focuses on data quality, feature distributions, drift, prediction performance, and model explainability. For LLM applications, developers also need visibility into prompts, generated responses, retrieved context, and token usage. Agentic applications introduce additional requirements around tool calls, state changes, handoffs, and multi-step task completion.
These systems share an underlying challenge: application health alone cannot confirm whether an AI system is behaving as intended.
AI observability software helps teams connect the technical record of what happened with the evidence needed to judge whether the result was acceptable. Because LLM applications and agents introduce additional requirements for tracing, evaluation, and multi-step execution, this guide focuses primarily on observability tools for those systems.
AI observability tools vs. AI observability platforms
AI observability tools is the broader term for libraries, SDKs, backends, and software that capture and analyze AI application behavior. AI observability platforms typically combine multiple capabilities, such as tracing, evaluation, monitoring, and experimentation, within one environment.
AI monitoring tools often emphasize production metrics, dashboards, and alerts, although some also include tracing and quality evaluations. These categories overlap, so developers should compare what a product actually captures and which workflows it supports rather than relying on how the vendor describes it. For the agent-specific version of this category, see what an agent observability platform is.
How is AI observability different from traditional application monitoring?
Traditional application performance monitoring (APM) helps developers understand whether software and infrastructure are operating correctly. It tracks signals such as error rates, latency, throughput, resource utilization, and service dependencies.
Those signals remain important for AI applications. A model provider might become unavailable, a retrieval service might time out, or an overloaded database might slow down an otherwise reliable agent.
But a healthy application can still generate an incorrect answer or execute an unintended action.
Consider a retrieval-augmented generation (RAG) application that retrieves a document successfully and generates a fluent response. APM can confirm that the retrieval service responded and the model call completed. To verify whether the answer was correct, the team also needs to know which documents were retrieved, whether they contained the necessary evidence, and whether the response was supported by that evidence.
AI observability connects those application-level signals with AI-specific execution data and quality measurements.
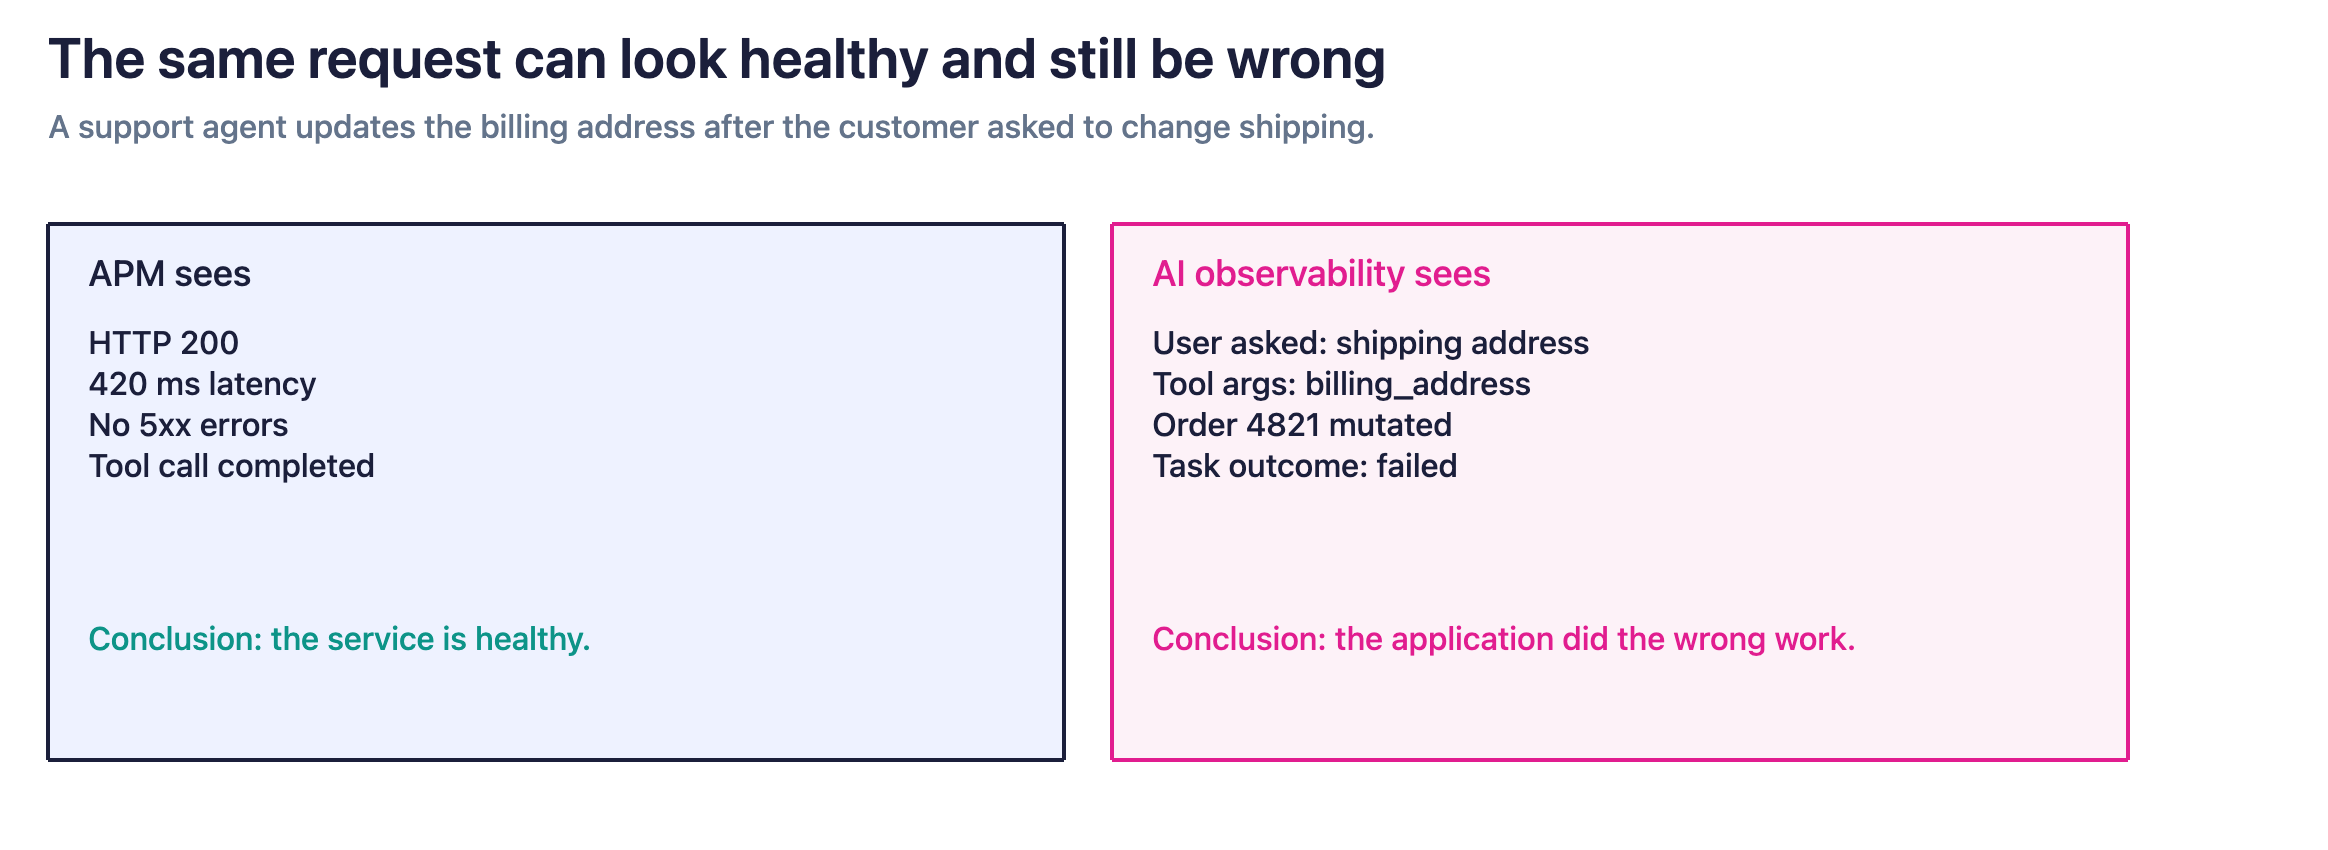
The distinction also matters when evaluating AI monitoring tools. Some products focus primarily on infrastructure and model API performance, while others support evaluations, datasets, experiments, and production quality monitoring. The right capabilities depend on what your team needs to investigate and improve.
What do AI observability tools do?
Most AI observability platforms provide some combination of four capabilities: tracing, evaluation, monitoring, and experimentation. Products differ in how they implement these capabilities and how easily engineers can move between them.
| Capability | What you inspect | Typical failure it explains |
|---|---|---|
| Tracing | Spans, inputs/outputs, timing, errors | Wrong tool args, missing retrieval, silent retries |
| Evaluation | Scores, rubrics, human labels | Fluent but wrong answers, policy violations |
| Monitoring | Aggregates by version, model, task | Regressions after deploy, cost spikes |
| Experimentation | Offline experiments comparing candidate configurations against a shared dataset | Prompt changes that fix one case but introduce regressions elsewhere |
Trace model calls and application execution
Tracing records the operations involved in an AI application’s execution, including model calls, retrieval, tools, and custom application logic.
A trace should let developers inspect the inputs, outputs, timing, and errors associated with each operation, along with the relationships between those operations.
Most AI tracing systems use three important concepts:
- A span records an individual operation, such as a model call, retrieval query, or tool execution.
- A trace connects related spans within a request or application run.
- A session (usually a session ID on spans or traces) groups related traces across a conversation or longer-running task. Not every backend treats sessions as a first-class object.
For example, a customer-support application might retrieve account information, search a knowledge base, call an LLM, and generate a response. Tracing connects those operations so an engineer can understand what information was available to the model and where an error originated.
That context becomes particularly important when applications involve retries, asynchronous work, or multiple agents operating across different services.
For more on the underlying data model, see our guide to spans, traces, and sessions in OpenTelemetry.
Evaluate the quality of outputs and behavior
Tracing shows what the application did. Evaluation applies criteria to verify whether the behavior or outcome was acceptable.
Different problems require different evaluation methods.
A code-based (deterministic) evaluator can check whether a response matches a JSON schema, whether a tool was called with valid arguments, or whether a required approval occurred before a state-changing operation.
An LLM-as-a-Judge evaluator can assess criteria that depend on meaning, such as whether an answer addresses the user’s question, follows instructions, or is supported by retrieved evidence.
Human review remains important for defining acceptable behavior, validating automated judgments, and resolving disagreements that automated evaluators cannot reliably settle. For a product-level view of that stack, see LLM and agent evaluation platforms.
Evaluation also needs to happen at the right scope. A retrieval-quality check may require only one span, while determining whether a support issue was resolved may require the complete trace, several conversation turns, and the resulting application state.
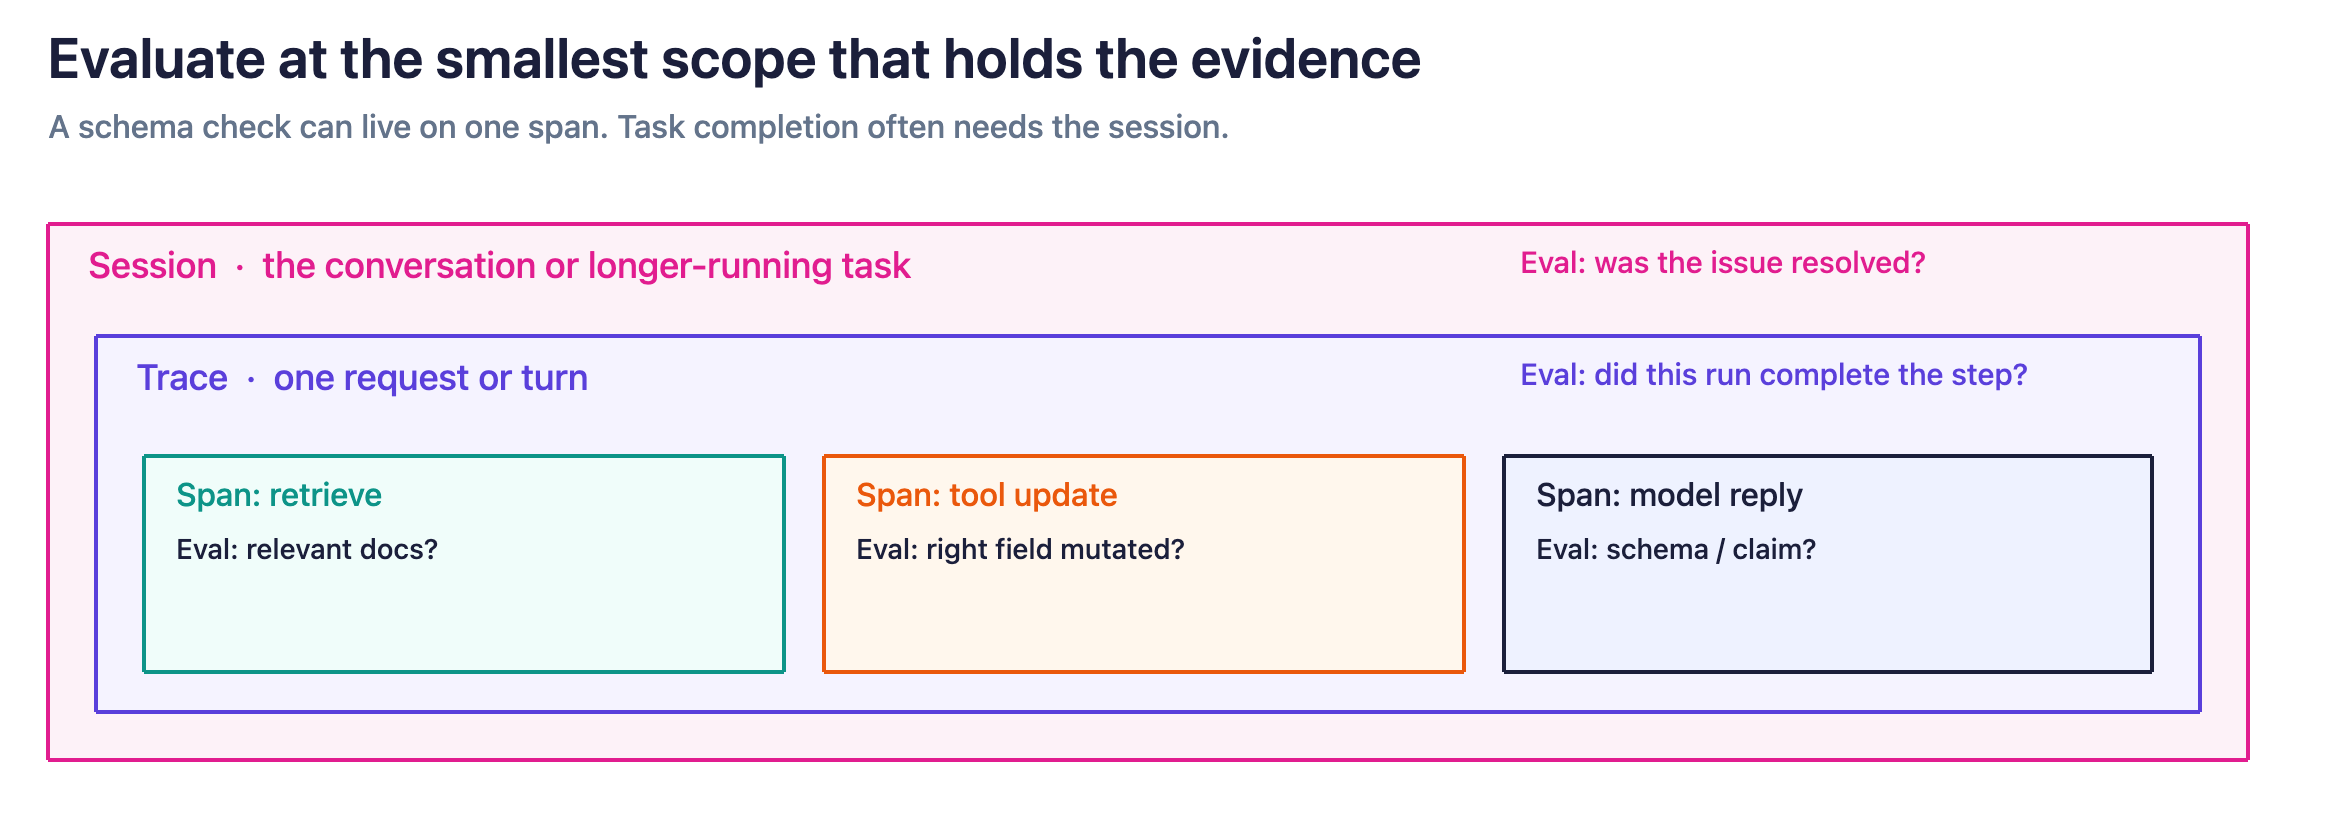
The strongest platforms support evaluations across development and production, allowing teams to reuse criteria rather than rebuild their quality checks for each environment.
Our LLM evaluation guide explains the underlying methods, while the agent evaluation guide covers evaluation of multi-step tasks and agent behavior.
Monitor quality, reliability, latency, and cost in production
Production monitoring helps teams understand how an AI application behaves across real user traffic.
Engineers can track technical signals such as latency, provider errors, token consumption, and tool failures alongside quality measurements such as correctness, groundedness, policy compliance, and task success.
These signals become more useful when they can be segmented by application version, model, prompt, task type, or customer workflow.
Suppose answer quality declines after a retrieval configuration changes. A useful monitoring system should help the team identify the affected traffic, inspect the underlying examples, and determine whether the change altered which documents were retrieved.
Monitoring should also account for evaluation coverage. If fewer runs are evaluated after a deployment, a lower measured failure rate may reflect reduced coverage rather than an improvement in quality.
Online LLM evaluations extend quality measurement into production by applying evaluators to sampled or rule-triggered live traffic (not necessarily every request). Combined with dashboards and alerts, they help teams detect problems that traditional service metrics may miss.
Turn production failures into tested improvements
Observability becomes more useful when developers can take evidence from production and use it to improve an application. A failed run can become a reviewed dataset example, an experiment, and eventually a regression test.
That process depends on preserving context across tracing, evaluation, datasets, and experiments. If the original request, application version, or relevant state disappears when an example moves between tools, engineers must reconstruct the failure before they can test a fix.
When evaluating AI observability software, look for a practical path from an observed failure to a reproducible test. We’ll walk through that process with a concrete example later in this guide.
Build better agents with Arize
Trace, evaluate, and learn. Build agents that work with Arize AX and start tracing your runs today.
Prefer open source? Try Arize Phoenix for self-hosted, open source agent observability.

How do AI observability tools fit into your application stack?
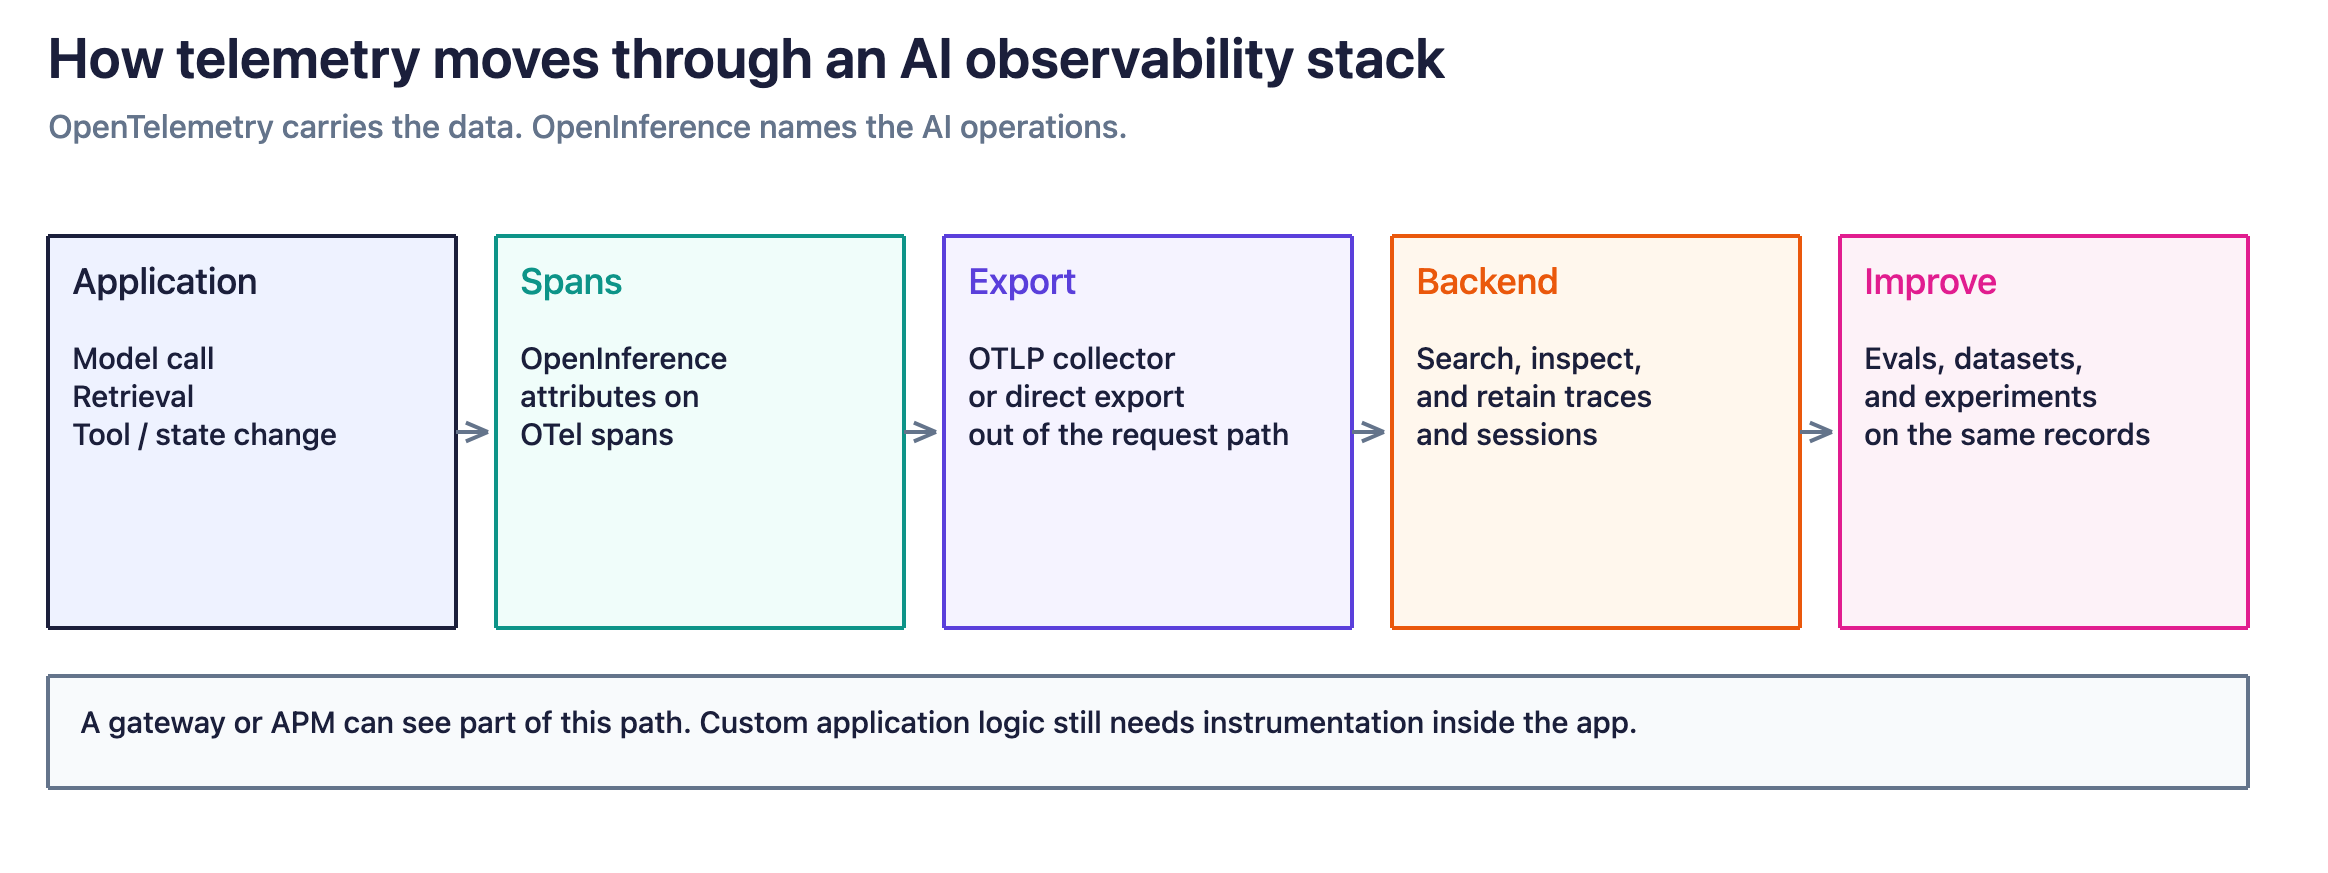
An AI observability stack usually combines instrumentation, telemetry collection, storage, analysis, and evaluation.
The application produces telemetry through instrumented operations. That data is exported to an observability backend, sometimes through an intermediary collector. The backend makes the records available for inspection, search, monitoring, and analysis.
Evaluation and experimentation systems then use those records to assess behavior and compare application changes.
Some platforms combine these capabilities in one environment. Others rely on integrations between specialized tools.
Instrumentation captures the application’s behavior
Instrumentation determines which operations become visible to the observability system.
Automatic instrumentation can capture supported model providers and frameworks without requiring developers to wrap every operation manually. Custom spans are still useful for application logic that automatic instrumentation cannot see.
For example, an application may need additional spans around a proprietary retrieval function, a business-logic validator, or a tool that updates an external system.
The important requirement is maintaining the relationships between operations. If the application loses tracing context when a task moves between services or agents, part of the execution may appear as an unrelated record.
Instrumentation should also preserve the metadata developers need to interpret the behavior, including model versions, prompt versions, deployment environments, and relevant task identifiers.
For an implementation example, see the Arize AX tracing documentation.
OpenTelemetry and OpenInference provide a common foundation
OpenTelemetry provides vendor-neutral APIs, SDKs, and infrastructure for generating, collecting, and exporting telemetry.
OpenInference defines semantic conventions—often implemented as OpenTelemetry span attributes and instrumentation—for LLM calls, retrieval, agents, and tools.
Together, they help developers represent AI application behavior using consistent telemetry concepts rather than relying entirely on framework-specific logging formats.
For example, an application instrumented with OpenTelemetry and OpenInference can send compatible telemetry to different observability backends without necessarily rewriting the application’s tracing logic.
This portability is useful when teams change model providers, introduce another orchestration framework, or need to send trace data to several systems.
However, telemetry portability does not guarantee that every part of an observability workflow is interchangeable. Prompts, annotations, evaluator definitions, datasets, and experiment results may use platform-specific formats or APIs.
When evaluating a platform, test how those records can be exported and reused, along with the raw traces. The same trace can often feed both an APM system and an AI observability backend when instrumentation is shared.
AI gateways and application monitoring provide complementary visibility
AI gateways can log requests, responses, model routing decisions, retries, and other operations that pass through them.
That information can be valuable for tracking model usage, provider reliability, and request-level performance.
But a gateway only sees the activity available at its position in the application architecture. Custom application logic, internal tool execution, or state changes may require instrumentation inside the application itself.
The gateway also introduces a different operational consideration. A gateway that sits in the request path can affect runtime availability and latency, while telemetry exported separately can often be handled without putting the observability backend directly in that path.
Application monitoring, gateways, and AI observability tools can therefore contribute different pieces of the same investigation.
A useful architecture connects them through consistent identifiers so developers can move from an AI quality regression to the underlying model call, service request, or database operation that contributed to it.
What data should AI observability tools capture?
The data an observability tool needs depends on the failures an application can produce.
Start by identifying the behaviors you need to investigate, then work backward to the evidence required to explain them.
Model calls and application context
For LLM applications, capture the model provider, model identifier, relevant invocation parameters, prompt and response data where permitted, token usage, latency, and errors.
Connect these records to the application version, deployment environment, and trace or session in which they occurred.
Prompt versions and tool-schema versions are particularly useful when a change in application behavior follows a deployment.
The goal is to make a model interaction reproducible enough to investigate. A response logged without the relevant prompt, retrieved context, or model configuration may be insufficient to explain why it occurred.
For predictive ML applications, the required evidence may instead include feature values or summaries, prediction distributions, model versions, data-quality signals, drift measurements, and ground-truth outcomes when they become available.
Retrieval, tool execution, and state changes
Retrieval systems should preserve enough information to identify the query, returned documents, ranking information, and retrieval configuration.
This helps developers distinguish failures caused by missing evidence from failures in which the model had the necessary evidence but used it incorrectly.
Tool execution requires similar context. Useful records include the selected operation, submitted arguments, returned result, timing, errors, and retries.
When a tool changes external state, the application should also capture a reliable way to verify the resulting outcome.
A tool returning a successful response confirms that the operation completed according to its API. It does not necessarily confirm that the user requested that operation or that the intended state changed. Log which entity was mutated (for example, order ID and field) so retries and idempotent APIs do not hide mistakes.
For example, a support agent might successfully update an order’s billing address even though the customer asked to change the shipping address. The observability record should make that mismatch discoverable.
Evaluation results and verified outcomes
Evaluation records should retain the criterion being measured, the evaluator version, its scope, and the resulting score or verdict.
Where appropriate, they should also preserve supporting evidence, explanations, and human annotations.
Versioning matters because evaluation results can change when the evaluator changes, even if the application’s behavior stays the same.
Verified application outcomes provide another important source of evidence. A successful tool call, generated answer, or completed model response may not correspond to successful task completion.
For applications that modify records, execute workflows, or produce artifacts, the strongest outcome measures often come from the system where the work was supposed to happen.
Sampling, retention, and sensitive data
Capturing more data can improve visibility, but it also increases storage requirements, processing costs, and privacy risk.
Prompts, retrieved documents, tool arguments, and model responses may contain sensitive customer information. Define what should be redacted, omitted, or replaced with identifiers before telemetry leaves the application, and apply those rules consistently to automatic and custom instrumentation.
Sampling and retention policies also determine what engineers can investigate after an incident. A missing trace may mean the record was sampled out or expired before the problem was reported.
Multimodal applications introduce additional requirements. For example, voice observability may need transcripts, audio references, interruption events, time to first audio, and playback timing to explain what happened during an interaction.
The right capture strategy preserves enough evidence to support debugging and evaluation while respecting the application’s security, privacy, and operating requirements.
How to choose an AI observability tool
Choosing an AI observability tool starts with what the team needs to see, measure, and improve.
A prototype may need straightforward tracing and a small evaluation dataset. A production application handling customer transactions may require session-level evaluation, privacy controls, incident investigation, and reliable monitoring across a much larger volume of traffic.
Regardless of the workload, evaluate candidates against five questions: what the team can see, what it can measure, how it can test improvements, how much of that work can be automated, and whether the platform fits the organization’s operating requirements. The proof-of-concept walkthrough later in this guide provides a practical way to test those capabilities. The buyer’s guide to choosing an AI observability platform covers contract and vendor-review questions in more depth.
Can the tool reconstruct what happened?
Start with a representative application run that includes the frameworks, model providers, retrieval systems, and custom operations your team actually uses.
Check whether the platform preserves parent-child relationships between spans, maintains context across services, and groups related traces into sessions when necessary.
The interface should help an engineer move from an application outcome to the operations that produced it.
Consider how the tool handles long-running tasks, asynchronous execution, retries, and custom spans. A platform may support a framework’s standard operations while missing application-specific logic that matters during an incident.
Also test the available search and export capabilities. Engineers should be able to find affected examples by meaningful attributes and extract the underlying records for further analysis.
Can the tool evaluate quality at the right scope?
Look beyond the presence of an evaluation feature.
Determine whether the platform can run the checks your application needs, using the evidence available at the appropriate level.
For example, schema validation may require only one model response. Evaluating a tool’s arguments may require the tool span and original request. Task completion may require several operations, multiple conversation turns, and external application state.
Check whether the same evaluation criteria can be applied during development, offline experiments, and production monitoring.
Human review should also connect to the evaluation workflow. Engineers need a way to inspect disagreements, validate automated judgments, and use reviewed examples to improve their evaluators.
Platforms differ in the extent to which they support these workflows directly. The trace and session evaluation documentation provides examples of why scope matters.
Can the team move from a production failure to a verified fix?
A useful observability platform should support the work that follows the discovery of a problem.
Take a failed production run and determine whether the team can identify similar failures, review the evidence, create a dataset example, compare a proposed change, and monitor the results after deployment.
Record where engineers have to export data, copy context, recreate evaluator definitions, or maintain separate records manually.
Those handoffs can become expensive as traffic grows and the number of failures increases.
How much investigation and evaluation work can the platform automate?
As production traffic grows, the volume of traces, evaluations, and recurring failures can quickly exceed what engineers can review manually. Some AI observability platforms address this with automated failure discovery, clustering, evaluator generation, and AI-assisted investigation.
These capabilities can reduce engineering work, but their effectiveness depends on how reliably they identify meaningful problems. A platform that generates hundreds of false positives or proposes fixes without sufficient evidence may create more work than it eliminates.
During your proof of concept, test automation against problems your team has already investigated. Measure how long it takes to identify a recurring failure, whether the system selects the correct examples, and how much manual review is needed before an engineer can act on its findings.
The practical question is how much reliable investigation the platform can perform as traffic grows, and what that work costs.
Does the platform fit your deployment and operational requirements?
Review the deployment architecture at the component level.
Identify where telemetry is collected, stored, processed, and evaluated. Determine where authentication, model-provider calls, and administrative services run, along with any external dependencies.
A product described as self-hosted may still depend on services outside the customer’s environment. For a more detailed review of these arrangements, see our guide to self-hosted AI observability.
Then examine the operational requirements that follow from the deployment model: retention, redaction, access control, audit records, backups, upgrades, and data export.
Include the teams that will rely on observability after a production incident. Developers may need raw traces, while product managers, support teams, and security reviewers may need access to specific outcomes or evidence with appropriate permissions.
Finally, evaluate the interfaces your engineers use every day. API, terminal, and coding-agent access may be as important as a graphical interface for teams integrating observability into their development workflows.
How should you test an AI observability platform?
The most useful proof of concept starts with a failure your team understands and follows it through investigation, evaluation, and testing.
Consider an order assistant that confirms a shipping-address change after updating the billing address. The tool call returned successfully, the response sounded reasonable, and the order will still ship to the wrong destination.
This is a useful test because the failure spans several parts of the application. The tool executed, but its arguments did not match the user’s request.
Find the point where behavior diverged
Start by inspecting the original request, the sequence of operations, and the resulting order state.
The first visible mismatch may be the address type passed to the tool. That narrows the investigation to the context, tool description, argument generation, or validation logic surrounding the operation.
A capable platform should make it possible to follow that evidence without reconstructing the entire run from separate logs.
It should also help engineers identify related failures across other requests. For example, the problem might occur only after the customer clarifies an address or when a particular prompt version is deployed.
Evaluate the failure using the correct evidence
A code-based evaluator can inspect whether the operation modified the requested address field.
If the request involved a clarification over several turns, the evaluation may also need the conversation history. A check that sees only the tool response cannot reliably establish whether the intended customer task was completed.
This is where evaluation scope matters. Developers need to apply criteria to the operations and outcomes that contain the evidence required to make the judgment.
Turn the failed run into an experiment
Save the request, relevant context, expected outcome, and constraints as a dataset example.
Add related cases that exercise the same boundary, including a billing-address change, a shipping-address clarification, and an order that can no longer be modified.
If the outcome depends on application state, preserve a test fixture or document how to reconstruct it. Use a controlled environment or mocked tools when experimental runs could otherwise modify production records.
Then compare the current implementation against a proposed fix using the same dataset and evaluation criteria.
The comparison should include task success, relevant policy requirements, latency, retries, and cost. That release-gate pattern is the core of EvalOps. Repeated runs can also help determine whether the new behavior is consistent.
For a developer walkthrough of this process, see how to build agent evals from traces.
Verify that the fix works after deployment
The final test is whether the platform can connect the experiment back to production.
Apply the relevant evaluations to new traffic, monitor the affected task types, and investigate any recurring failures.
Keep evaluation coverage visible so that a reduction in measured failures can be interpreted correctly.
A successful proof of concept should demonstrate that the team can move from an observed problem to a reproducible test and then verify the result in production.
That workflow provides a stronger basis for selecting a platform than the number of integrations or dashboards shown during a vendor demonstration.
6 questions to ask AI observability vendors
A useful platform evaluation should test the capabilities demonstrated against the requirements of your application. Ask every vendor to answer the same questions:
- Which model providers, frameworks, and custom operations can you instrument, and what happens when we add something unsupported?
- Can we export a complete trace, including the context and metadata needed to investigate an application failure?
- Can the same evaluator run in development, offline experiments, CI, and production?
- How does a failed production run become a reviewed dataset example and a regression test?
- What discovers recurring failures automatically, and how do engineers validate those findings?
- Which demonstrated capabilities are generally available, which require a different deployment or plan, and how does pricing change at production volume?
Ask vendors to demonstrate these workflows with your application’s data rather than relying on a predefined example. Record the limitations and manual steps required so your team can compare platforms against the same evidence.
How much do AI observability tools cost?
AI observability pricing depends on the volume of telemetry collected, the work performed on that data, and the resources required to operate the platform.
Vendors may charge by traces, spans, events, ingested data volume, evaluation executions, seats, retention, or combinations of those units.
Those definitions matter because a single user request can generate multiple model calls, retrieval steps, tool operations, retries, and evaluation results.
An application with a small number of long-running requests may produce considerably more telemetry than an application processing many short, single-model interactions.
Estimate cost using your actual workload
Start with the application workload you expect to run in production.
Estimate the number of requests, average trace depth, typical payload size, retention requirements, and proportion of traffic that will be evaluated.
Then apply each vendor’s billing rules to the same workload.
For example, a platform charging by ingested data volume may respond differently to large prompts and retrieved documents than a platform charging by span count. Seat-based pricing may also matter when engineering, product, support, and security teams need access to the same records.
Model-based evaluations create another category of expense. LLM-as-a-Judge evaluations can require additional model calls, while more complex evaluation workflows may involve repeated inference or human review.
A platform may include evaluation features without covering every cost associated with running them.
Our guide to LLM evaluation costs explains how evaluation coverage, judge models, and production traffic affect the budget.
Include the cost of operating the platform
Managed, self-hosted, and internally built systems carry different operating costs.
A self-hosted tool may remove or reduce software subscription fees while leaving the organization responsible for infrastructure, storage, upgrades, reliability, backups, and incident response.
A managed platform transfers more of that work to the vendor, although its pricing and deployment options may introduce other constraints.
For the broader tradeoffs, see our build-versus-buy guide for AI observability.
Include the engineering work involved in maintaining evaluators, investigating failures, and managing data retention. Then compare those costs with the time the platform saves and the improvements it helps the application achieve.
Which AI observability tool is right for your team?
The right choice depends on the application’s maturity, operating requirements, and the engineering work your team is prepared to own.
Prototyping and early development
Start with tracing and a small set of evaluations that help you understand application behavior. Local or open-source tools may be sufficient, provided you can instrument custom operations and preserve the context needed for debugging. OpenTelemetry-based instrumentation can make it easier to expand or change platforms later.
Preparing for production
Prioritize datasets, experiments, and regression testing. Your team should be able to compare changes to prompts, models, retrieval configurations, and application logic against consistent acceptance criteria before deploying them.
Running production AI applications
Look for production tracing, online evaluations, monitoring, and incident investigation workflows. The platform should help engineers identify recurring failures, understand their causes, and assess quality alongside cost, latency, and reliability.
Operating across multiple teams
Governance, deployment options, retention, access controls, and data portability become more important as additional applications depend on the same infrastructure. Evaluate the operating burden alongside the software’s capabilities and pricing.
For named product comparisons, see our guide to the best AI observability tools for agents, which examines individual platforms, deployment options, and tradeoffs.
How should you measure the value of AI observability?
The value of an observability platform should be measured against the problems that motivated its adoption.
Start with the engineering work involved in diagnosing and resolving failures. Track how long it takes to investigate an incident, identify a cause, reproduce the problem, and verify a fix.
Then measure whether the application’s outcomes improve.
Task success, correctness, recurring incidents, policy compliance, and cost per successful task can help establish whether the system is becoming more reliable or efficient.
These measurements need context. Changes in task mix, traffic, model versions, and evaluation coverage can affect the results even when the underlying application has not improved.
For larger organizations, the value may also include faster reviews, stronger operational evidence, and less manual effort spent searching for recurring problems.
Compare similar workloads before and after adopting the platform. The result should show what improved, how that improvement was verified, and how much work it took to achieve it.
Where Arize Phoenix and Arize AX fit
Arize provides two approaches to AI observability that support different deployment and operating requirements.
Arize Phoenix is an open-source platform for tracing, evaluation, datasets, and experiments. Developers can run Phoenix locally, self-host it, or use hosted Phoenix, making it useful for teams that want an open-source stack with flexible deployment.
Phoenix uses OpenTelemetry and OpenInference instrumentation, allowing developers to connect model and application traces with evaluation workflows. For a side-by-side of when to use each product, see Arize AX or Phoenix. Teams that self-host remain responsible for operating the infrastructure, and external model-based evaluations may introduce additional costs.
Arize AX provides a managed AI engineering environment that connects tracing, evaluation, experimentation, and production monitoring.
AX supports workflows for identifying recurring production failures, investigating their causes, creating evaluations, and testing improvements. Signal clusters and surfaces recurring failure patterns from production traces; Alyx is an in-product AI assistant for working across traces, datasets, evaluators, and experiments.
Both approaches support the broader process of capturing application behavior, measuring whether it is acceptable, and testing changes before and after deployment. Other OpenTelemetry-compatible backends can store the same spans; the tradeoff is how tightly eval, dataset, and experiment workflows integrate with that storage.
The choice depends on the team’s deployment requirements, collaboration needs, and willingness to operate the underlying infrastructure. Regulated or air-gapped teams can also run self-hosted Arize AX.
Developers can start with the Phoenix documentation or follow the Arize AX tracing setup guide to begin instrumenting an application. The developer walkthrough is AI agent tracing and evaluation.
Related reading
- What is an agent observability platform?
- How to choose an AI observability platform
- AI agent tracing and evaluation
- LLM-as-a-Judge
- Compare LLM and agent evaluation platforms
- Arize AX or Phoenix
- EvalOps release gates
- Online LLM evaluations
AI observability tools FAQs
What is the difference between AI observability and LLM observability?
AI observability covers the behavior and performance of predictive machine learning systems, LLM applications, and AI agents. LLM observability focuses more specifically on model interactions, including prompts, responses, retrieval, latency, cost, and output quality.
Agent observability extends that view to multi-step execution, tool use, state changes, handoffs, and task completion. These categories overlap, but agent workloads require additional evidence about the actions and decisions that produced an outcome.
For a deeper explanation of how to instrument, trace, and debug agent workflows, see our guide to agent observability.
Can OpenTelemetry replace an AI observability platform?
OpenTelemetry provides the instrumentation and telemetry infrastructure needed to capture and export application data. OpenInference adds AI-specific conventions that help describe model calls, retrieval, tools, and agent operations.
Teams still need a backend or additional systems for storage, visualization, search, monitoring, evaluation, and experimentation. The same exported traces can often feed both APM and AI observability backends.
OpenTelemetry can serve as the common instrumentation foundation for these capabilities without determining which platform provides them.
Do you need AI observability if you already use an APM platform?
That depends on the AI capabilities available in the existing platform.
Some APM products support model tracing, evaluations, and other AI-specific workflows. Others primarily provide infrastructure monitoring and request-level visibility.
Evaluate whether the platform captures the relevant AI operations, supports the quality checks your application requires, and connects failures to reproducible tests.
APM and specialized AI observability can complement each other, particularly when investigating problems that span application infrastructure and model behavior.
Should AI evaluation and observability use the same platform?
Either approach can work.
An integrated platform may simplify the process of connecting traces, evaluation results, datasets, and experiments. Separate tools can offer flexibility when teams have specialized requirements or established systems they want to retain.
The important consideration is whether the tools preserve the identifiers, context, and evaluation criteria needed to move between production analysis and development testing.
Can AI observability tools expose a model’s hidden reasoning?
AI observability tools can record application-visible activity, including prompts, responses, tool calls, retrieved information, and reasoning summaries that a model provider makes available.
They cannot automatically recover a model’s private internal reasoning.
Developers should investigate the actions, inputs, outputs, and application state that are actually observable rather than treating an inferred explanation as a complete record of the model’s internal process.
Can every production run be evaluated?
Evaluation coverage depends on the method, available evidence, latency requirements, cost, and data access.
Deterministic checks can often run broadly when their required data is available. Model-based evaluations may be applied to sampled traffic or selected workloads, particularly when judging an entire trace or session is expensive.
Track which task types and failure modes receive evaluation coverage. Aggregate quality metrics become less reliable when important classes of behavior are missing from the evaluated population.
Do AI observability tools automatically fix application failures?
Some platforms can identify recurring failures, investigate likely causes, and propose changes to prompts, evaluators, or application code.
These capabilities can accelerate engineering work, but proposed changes still need to be checked against the application’s requirements and tested on representative examples.
Monitoring after deployment is necessary to determine whether the change resolved the problem and whether it introduced other regressions.
Next step: evaluate one failure across the stack
The best way to evaluate an AI observability tool is to test it against a failure your application needs to solve. Capture a representative run, identify where execution diverged, evaluate the outcome, and determine whether the platform can help your team reproduce the problem and verify a fix.
That exercise gives you a concrete basis for choosing tooling and a repeatable workflow for improving applications in production.
For an implementation walkthrough, see how to build agent evals from traces. If you’re evaluating vendors, our best AI observability tools comparison covers specific platforms, capabilities, and tradeoffs.

