

Chapter summary
Agents break in ways that look like success: a well-formed answer to the wrong question, a tool call that should not have happened, a session that completed the wrong version of the task. A platform that only logs prompts and outputs will show you a green run. Choosing an AI observability platform in 2026 is really choosing whether you can see the path, score it at span, trace, and session scope, and turn a failed production run into a regression test before the next release.
This guide lays out what the category does, what changed, the criteria that separate the options, and the questions worth asking before a contract gets signed. It’s written for both seats at the table: the engineers who’ll run the platform daily, and the leaders who approve the purchase and own the outcome.
TL;DR
- Evaluate AI observability platforms on four dimensions:
- See: (can the team see what happened)
- Evaluate: (can the team measure whether it was good, at the span, trace, and session level)
- Fix: (how fast the team moves from a failed run to a fix)
- Operate: (whether the platform fits how the company deploys, governs, and pays for infrastructure).
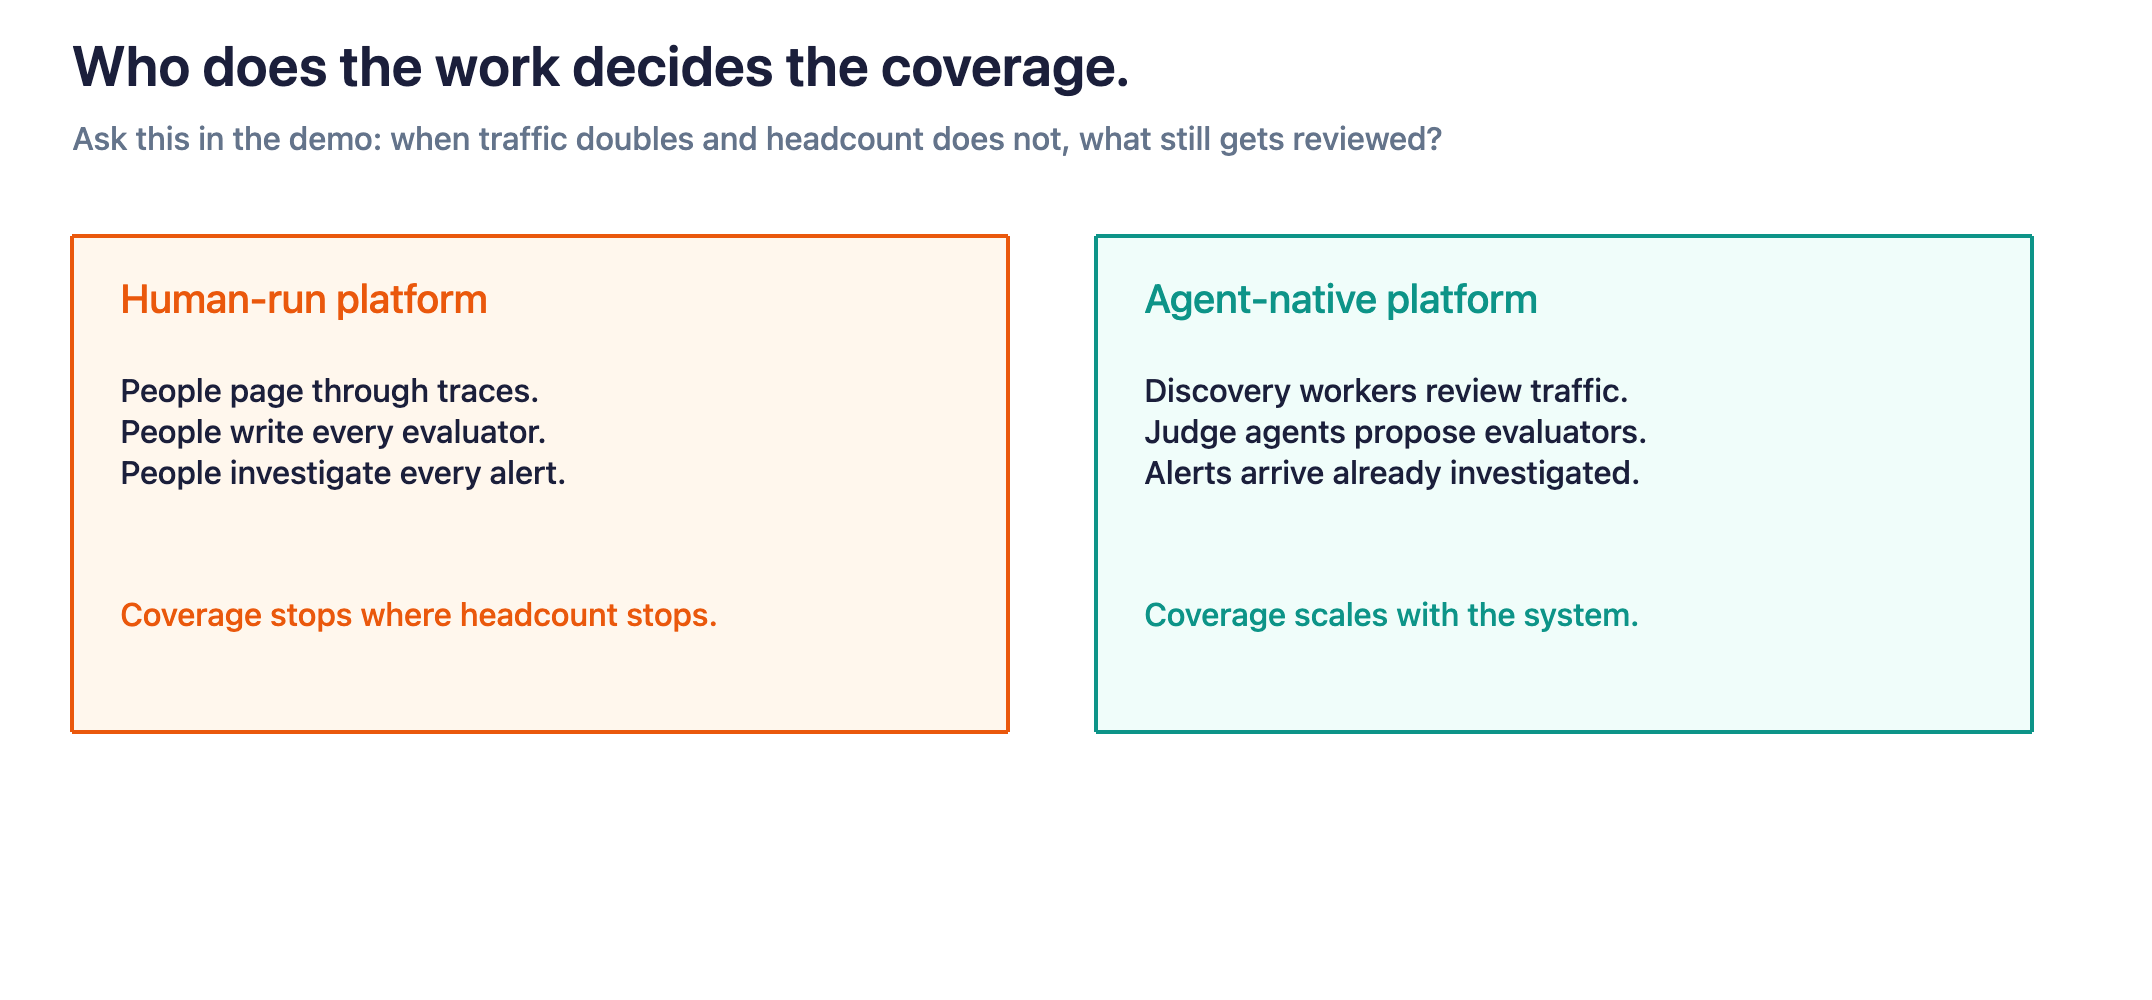
- Then ask the question that now separates the market: who does that work? On most platforms every dimension runs on human effort, so the team is the bottleneck and coverage stops where headcount does. On agent-native platforms, a team of agents runs the loop alongside the team of people, so coverage scales with the system instead of the staff.
- Weight the dimensions by stage, since a prototype needs visibility while a production agent needs the full loop, and model pricing at expected production volume rather than at pilot scale.
Last reviewed September 23, 2026.
What an AI observability platform does
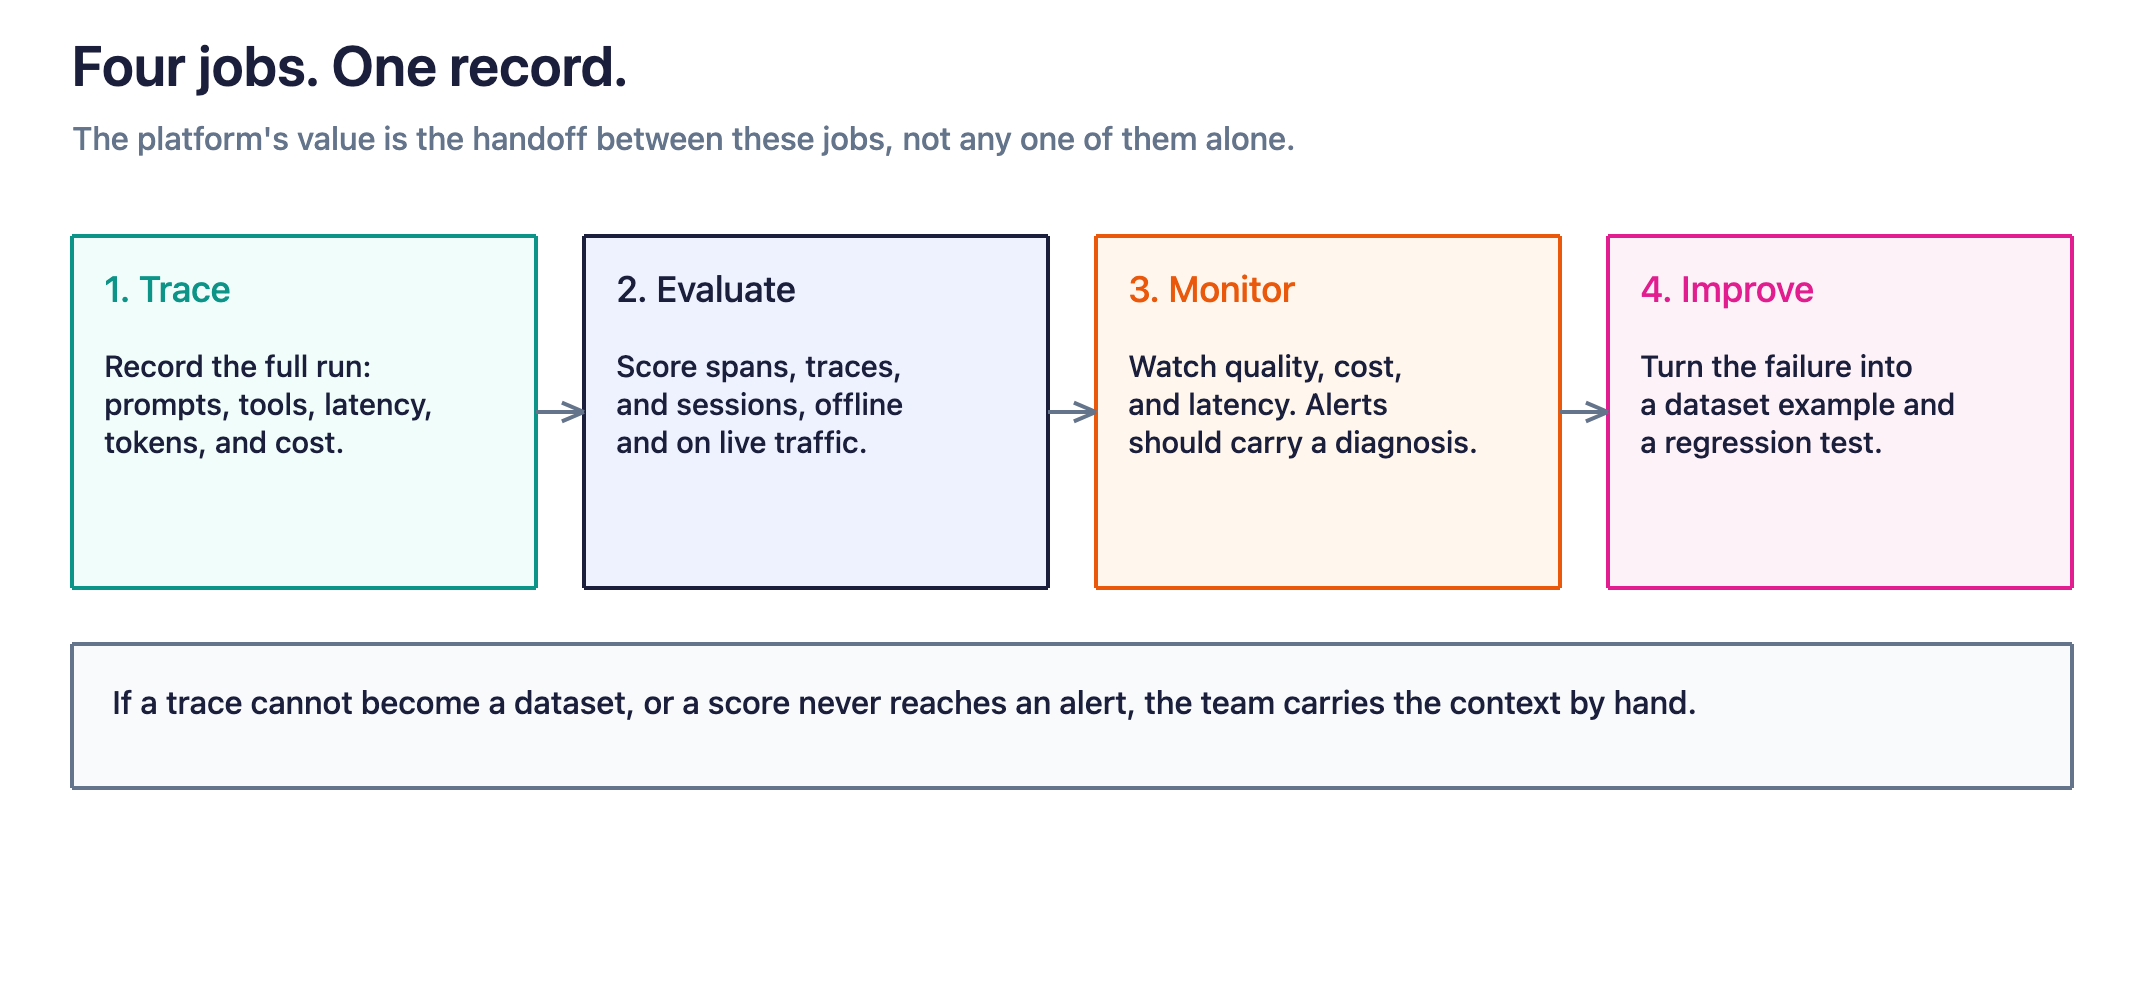
An AI observability platform is the system of record for how an AI application behaves. At minimum, it covers four jobs:
- Tracing: Recording every call the system makes, including prompts, model responses, retrieval steps, tool calls, latency, tokens, and cost, structured so a full run reads as one record.
- Evaluation: Scoring behavior with code-based checks, LLM-as-a-judge evaluators, or human review, both offline against curated datasets and online against live traffic.
- Monitoring: Watching quality, cost, and latency over time, with alerting that increasingly arrives with the diagnosis, examples, and a proposed fix instead of a bare notification.
- Improvement: Turning failures into datasets, testing fixes through experiments, and verifying that a resolved issue stays resolved.
The four jobs sound separable, and in practice the connections between them decide the platform’s value. A trace that can’t become a dataset example, or an eval result that never reaches an alert, leaves the team carrying context by hand between disconnected tools.
Why agents raised the bar
The evaluation criteria changed because the systems changed. The shift amounts to moving from code to consequence: what matters is no longer whether the code ran clean, but what the agent actually did. A prompt-in, answer-out application can be judged mostly on its outputs, and early tooling reflected that. Agents fail differently:
- The final answer can look correct while the run was not. Researchers call the policy version of this corrupt success: the task completes, but the agent skipped a required step, used the wrong evidence, or violated a constraint on the way there. Output-only evals score that as a win.
- Quality lives at the session level, since an agent can answer each turn acceptably while losing context, repeating work, or completing the wrong version of the task across the conversation.
- Failures arrive from more places, whether retrieval, routing, tool schemas, memory, or an intermediate decision several steps before the final answer.
- Production creates failure modes nobody staged, because real users exercise a system in ways a curated test set never will.
A platform built for prompt-response pairs can trace an agent, and the operating questions that follow, such as which sessions failed, whether the pattern is recurring, and whether the fix held after release, need AI agent evaluations and production workflows underneath them.
Build better agents with Arize
Trace, evaluate, and learn. Build agents that work with Arize AX and start tracing your runs today.
Prefer open source? Try Arize Phoenix for self-hosted, open source agent observability.

How leaders should frame the decision
Most material in this category speaks to the engineers who’ll use the platform, and the purchase usually gets approved by someone accountable for outcomes rather than tooling. For that seat, the evaluation reduces to three value drivers:
- Improve agent outcomes. The point of the purchase is an agent that’s accurate, reliable, and trusted in production rather than only in the demo. The platform earns its place by making quality measurable and provable: which sessions failed, whether the pattern is recurring, and whether the fix held after release.
- Operational efficiency. The platform’s cost competes against the cost of running blind: support escalations, churned accounts, engineer hours spent paging through traces by hand, and releases delayed because nobody trusts the eval coverage. A platform earns its price by improving the development-to-production lifecycle while mitigating cost, converting those losses into a measurable loop where failures get found, fixed, and verified instead of rediscovered. The newest lever here is agentic, since platforms where a team of agents runs discovery and investigation return engineering hours instead of consuming them.
- Reduce risk and improve compliance. AI initiatives stall in security review and create regulatory exposure when teams can’t prove what their agents did, why, or whether sensitive data was protected. The risk questions are whether problems become visible before customers report them, whether the evidence survives long enough for escalations and audits, and whether the vendor’s deployment model introduces exposure of its own.
The four dimensions below are the infrastructure test for those three outcomes. Seeing and evaluating determine whether outcomes and risk are visible, the improvement loop drives operational efficiency, fit decides whether the platform survives security review and scale, and the pricing model determines whether the economics track the agent’s success.
The four dimensions that separate platforms
Observability: can the team see what happened?
The trace is the foundation, and the details determine whether it holds up:
- Instrumentation coverage. Claiming OpenTelemetry and OpenInference support is table stakes now, since nearly every platform does. The separating questions are whether open standards are the native pipeline or a fallback that converts into a proprietary schema, how many frameworks and providers are auto-instrumented, and what happens when the stack adds one the platform hasn’t met.
- Data format and egress. Where does the telemetry live, in what schema, and how does it get back out? Data on open standards stays portable, and platforms with a data fabric layer can share the record directly with the warehouse and lakehouse tools the company already runs, while proprietary formats make the platform a one-way door.
- Session and trajectory structure. Can the platform represent a multi-turn session and a multi-agent handoff as first-class objects, or does everything flatten into individual calls?
- Full-cost visibility. Token usage, latency, and spend should attach to the same record as quality signals, so a cost spike and a quality drop can be investigated as one event.
- Modality coverage. Teams shipping voice agents need audio-native tracing, including session playback and signals like interruptions and time-to-first-audio.
Evaluation: can the team measure whether it was good?
Every platform demos an eval. The separating questions are about scope and continuity:
- Evaluation targets. Are spans, traces, and sessions all native targets, so scoring a whole conversation never requires restructuring the data first?
- Agent-native metrics. Does the platform evaluate trajectories, including path optimality, convergence, tool-selection correctness, and session-level task completion, or only outputs?
- Online and offline as one system. Do the evaluators that run in offline experiments and CI also run continuously against live traffic, or does production get a separate, thinner mechanism?
- Evaluator lifecycle. Can evaluators be versioned, so the judge that gated a release is provably the judge running in production afterward?
- Human review. Are annotation queues and labeling workflows built in, and can labels feed datasets and monitors rather than sitting in a spreadsheet?
Improvement loop: how fast does a failure become a fix?
This dimension separates platforms that show problems from platforms that help resolve them, and it’s where team velocity gets decided:
- Failure discovery. Does anything review production traffic proactively and surface patterns the team never predefined, or does discovery depend on someone paging through traces? Purpose-built discovery workers, like Arize’s Signal, exist because manual review stops scaling early.
- The failure-to-coverage loop. How many steps does it take for a bad production run to become a labeled example, a dataset item, and a regression test?
- Alerting that arrives with the answer. Do quality and cost regressions route to PagerDuty and Slack, and does the alert carry the problem, an example of it occurring, and a proposed solution, or does a bare notification start a manual investigation?
- Developer workflow fit. Can engineers drive the platform from the terminal and from coding agents, so debugging production issues lives in the same loop as writing the fix?
- Assisted investigation. Does the platform help investigate, whether through an in-platform agent proposing evaluators and root causes or through automated clustering of related failures?
Fit: does it work with how the company runs?
The dimension that procurement and security care about, and the one hardest to retrofit:
- Deployment model. Read the fine print on “self-hosting.” Some platforms run fully in your environment with the control plane included, some offer hybrid models where your VPC holds the data while the vendor’s cloud keeps the control plane and auth, and some gate self-hosting to Enterprise contracts entirely. For regulated environments, a third party in the auth path carries outbound dependencies and version-skew risk.
- Data portability. If the platform disappeared tomorrow, what would exporting the record take?
- Retention. Debugging an issue a customer reported three weeks ago requires the traces from three weeks ago, and retention windows of 14 to 30 days on lower tiers run short for production systems.
- Cross-functional access. Production AI failures reach support, product, operations, and finance, so the platform should give each function a view without forcing everyone through raw traces.
- Governance. SOC 2, GDPR, HIPAA, RBAC, and audit controls, matched against what the workload actually requires.
Who actually does the work?
Every criterion above assumes someone executes it, and on most platforms that someone is the team, which makes headcount the ceiling on coverage. The market is splitting on exactly this point. On a human-run platform, people page through traces, write every evaluator, review every queue, and investigate every alert, so seeing, evaluating, and fixing all scale with staff. On an agent-native platform, a team of agents runs the loop alongside the team of people: discovery workers review production traffic continuously and judge agents propose and refine evaluators, while an alert arrives already investigated, with the diagnosis, an example, and a candidate fix. The buyer’s version of the question is easy to ask in any demo: for each dimension above, who does the work, and what happens to coverage when traffic doubles and headcount doesn’t?
Understand the pricing model before the demo
Pricing models in this category differ structurally, and each one scales differently once agents carry traffic:
| Model | How it works | How it scales with agents |
|---|---|---|
| Per seat plus usage | Every user needs a seat, with traces billed on top | Costs scale with team size and traffic at the same time, and cross-functional reviewers get expensive |
| Per ingested unit | Traces, observations, and scores each count | One agent run with many tool calls and evaluator scores burns many units, so deep instrumentation multiplies the bill |
| Per score | Evaluation volume is metered directly | Deep eval coverage on sessions and trajectories scales the price with it, which taxes exactly the practice the platform should encourage |
| Data volume | Spans and ingestion are metered, with seats and eval depth free | The bill tracks how much the system runs, and adding reviewers or evaluation depth costs nothing |
The practical advice is the same regardless of model: build a cost model at expected production volume, including evaluation depth, retention needs, and everyone who’ll touch the platform, rather than at pilot scale. The tiers that look generous for a prototype are the ones that surprise teams at launch.
Questions to ask every vendor
- Which frameworks and providers are auto-instrumented today, and what does instrumenting an unsupported one take?
- What format does trace data live in, and what does a full export look like?
- Can the same evaluator run in CI, offline experiments, and continuously against production traffic?
- How does the platform evaluate a multi-turn session or an agent trajectory, and is that native or assembled?
- What discovers failure patterns the team hasn’t predefined?
- How many steps from a bad production trace to a regression test in CI?
- In the self-hosted deployment, what runs in our environment and what stays in yours, including auth?
- What are the retention windows per tier, and what does extending them cost?
- How does the bill change if we double evaluation coverage without changing traffic?
- Which capabilities on the demo are generally available, and which are beta or Enterprise-gated?
The last question matters quite a bit, by the way, as category demos increasingly feature capabilities that ship behind gates the pricing page doesn’t mention.
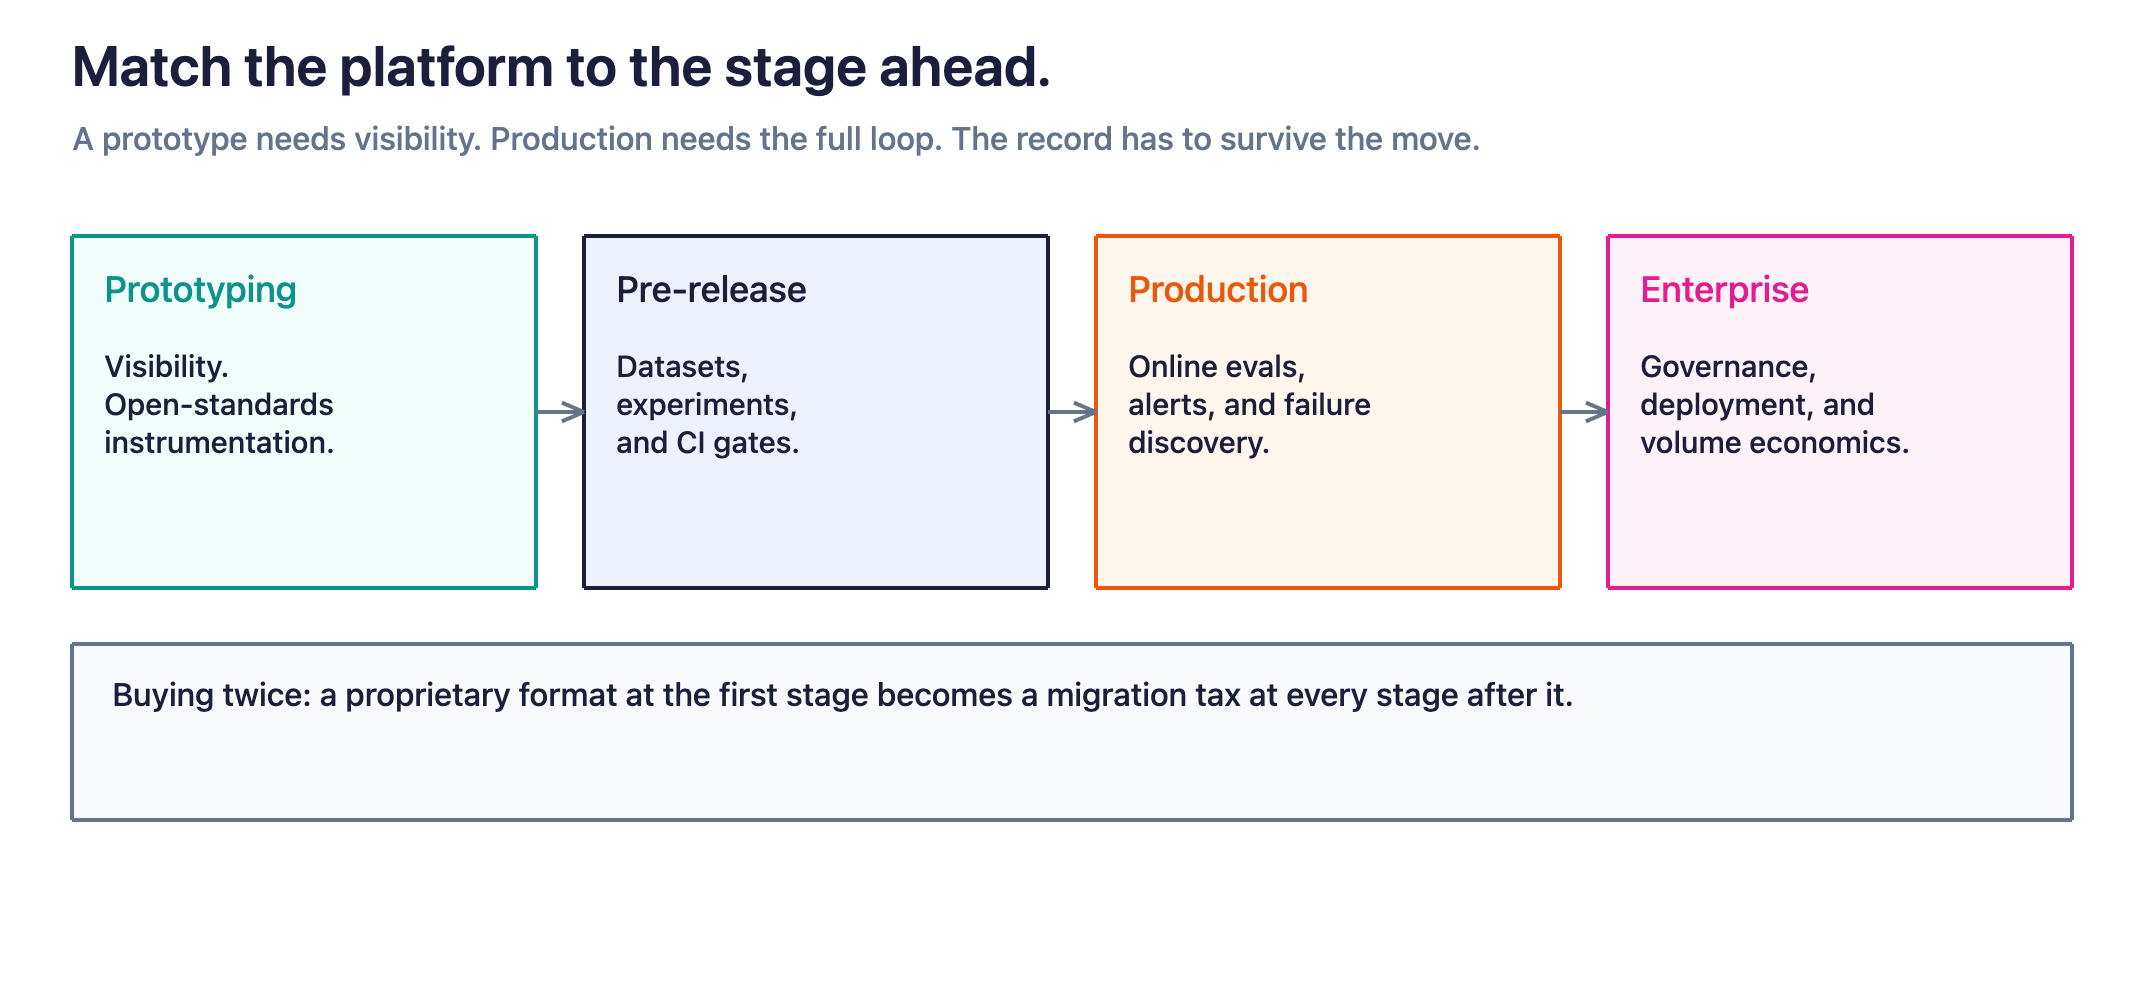
Match the platform to your stage
- Prototyping. Visibility is the whole job, so a lightweight tracer or an open-source tool running locally covers it. The smart move at this stage is picking instrumentation on open standards, since that decision carries forward even if the platform changes.
- Pre-release. Datasets, experiments, scorers, and CI gates matter most, and eval-first tools do this loop well. The question to ask is what happens to the workflow the day the system ships.
- Production. Online evals, monitoring, alerting, failure discovery, and root-cause workflows become the daily work, and this is where the four dimensions above separate the field hardest.
- Enterprise scale. Governance, deployment control, cross-functional review, and volume economics join the list, and the platforms that survive this stage are the ones with production infrastructure underneath rather than a dev tool stretched upward.
The trap in stage-matching is buying twice. A team that picks a stage-one tool, instruments against its proprietary format, and builds its eval suite inside it pays a migration tax at every following stage. Teams that expect to reach production save that tax by starting on a record that carries through, which usually means open-standards instrumentation from day one and a platform whose free tier grows into a production tier rather than ending at one.
Where Arize fits
Arize was built around the full lifecycle this guide describes: one record from development through production on OpenTelemetry and OpenInference, evals at span, trace, and session scope with agent-native trajectory metrics, Signal and Alyx for discovery and investigation, VPC and on-prem deployment with the control plane included, and pricing on data volume rather than seats or eval depth.
Phoenix, the open source project, covers the prototyping and pre-release stages free and self-hosted, and Arize AX adds the managed production layer on the same record. In leader terms, the continuous record is what makes risk visible before customers report it, and the discovery loop is what compresses the time from failure to verified fix, while the pricing model keeps the ROI math intact as usage grows.
Already looking at a specific platform? Each comparison page applies this guide’s criteria head to head:
Considering Braintrust for eval workflows? Read Arize vs. Braintrust
Building on LangChain or LangGraph? Read Arize vs. LangSmith
Weighing open-source options? Read Arize Phoenix vs. Langfuse
Comparing tools for autonomous agents? Read the 2026 tools roundup
Mapping the wider field? Start with the guide to LLM and agent evaluation platforms
AI observability buyer’s guide FAQs
What is AI observability?
AI observability is the practice of tracing, evaluating, and monitoring AI applications so teams can see what the system did, measure whether it was good, and fix what went wrong. For agents, it extends beyond individual calls to trajectories and sessions, since quality lives in the path the agent took as much as in the final answer.
How is AI observability different from application performance monitoring (APM)?
Traditional application performance monitoring tracks infrastructure signals like errors, throughput, and latency, where correctness is binary. AI systems fail semantically, since a response can return quickly, throw no errors, and still be wrong, ungrounded, or off-policy. AI observability adds the evaluation layer that measures quality, alongside the tracing structures, including sessions and trajectories, that AI systems need.
Should evaluation and observability be separate tools?
They can be, and the handoffs between separate tools cost more than they appear to. When evals live in one tool and traces in another, failures get investigated in one place, tested in a second, and monitored in a third, with the context carried by hand. Platforms that treat evaluation and observability as one record let a production failure become a dataset example and a regression test without translation between systems.
Open source or managed?
The honest answer is both, sequenced. Open-source tools prove the workflow with full control and no procurement, and managed platforms add the production layer, including continuous discovery, alerting, governance, and scale, when the workload justifies it. The detail that makes the sequence cheap is shared instrumentation, since a team that starts on open standards graduates without re-instrumenting.
How should leaders measure the ROI of AI observability?
Baseline the current costs first: hours engineers spend in manual trace review, the time from a customer report to a verified fix, escalation volume tied to AI behavior, and releases delayed by low confidence in coverage. Track the same numbers after adoption, and add the avoided costs, including the migration tax of re-instrumenting later and the failures caught before they reached customers. The platforms that support this measurement natively, with cost attribution and quality trends on shared dashboards, make the ROI case easier to keep making after the purchase.
How much should an AI observability platform cost?
Model it at production volume across whichever units the vendor meters. The structural test matters more than the sticker price: the right platform is the one whose bill scales alongside the success of your agent, so the vendor only makes money when the agent is doing real work for you. Models that meter seats or evaluation depth grow with adoption and diligence instead, which taxes the practices you want more of.

